01
Annual ESG Performance Review
Presenting carbon reduction targets and R&D investment to institutional investors. The card-based KPI layouts allow for clear year-over-year comparisons.
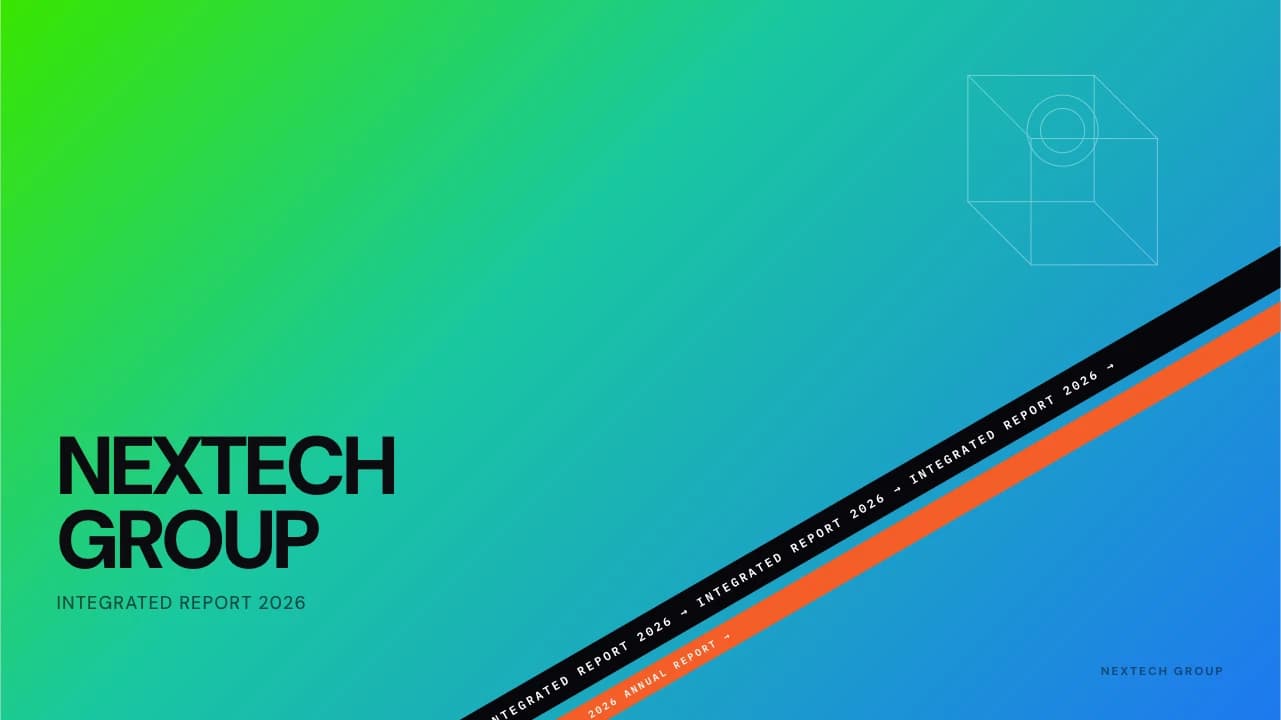
High-chroma gradients and diagonal motion for data-driven technology narratives.
Prism Signal draws inspiration from the high-energy visual identity of tech conglomerates.
The cover sets a bold tone with a full-bleed diagonal gradient shifting from electric lime to deep azure, intersected by a repeating 'ticker tape' graphic that adds a sense of constant motion.
Typography is grounded in DM Sans, using heavy weights for section headers and clear, tabular layouts for data.
The interior slides transition to a clean, off-white background (#F5F5F7) to ensure legibility, organized into a four-card grid for KPI reporting.
Each card features subtle progress bars and large-scale numerical callouts in brand green.
Glassmorphism is utilized through delicate 3D wireframe cubes that float in the background, providing depth without distracting from the core financial and ESG metrics.
The visual system is built on a 45-degree diagonal axis, visible in both background gradients and the decorative text strips.
The primary accent color, a high-visibility lime (#39E600), is used for emphasis on data points and progress bars against a neutral light-grey background.
DM Sans provides a geometric feel that complements the thin-line 3D wireframe illustrations.
Layouts favor a card-based architecture, grouping information into logical zones with generous padding to prevent cognitive overload during dense financial presentations.
Every theme has a stage it belongs on. These are the moments this one was built for.
Presenting carbon reduction targets and R&D investment to institutional investors. The card-based KPI layouts allow for clear year-over-year comparisons.
Synthesizing financial health and corporate social responsibility for a large conglomerate. The high-chroma brand elements reflect a modern, innovative image.
Pitching new AI infrastructure projects to board members. The 3D wireframe props and technical typography support a narrative of growth and sophistication.
01 / 8 02 / 8
 03 / 8
 04 / 8
 05 / 8
 06 / 8
 07 / 8
 08 / 8
Pick this template, upload your content, and our AI will compose it into the 8-slide arc of Prism Signal Tech Annual Report & ESG Dashboard Template — your job is just to polish the key data.