01
AI Product Launch
Presenting a new autonomous agent platform to potential clients, using the tiered gradient visuals to explain the complexity of the underlying LLM layers.

A clean, high-contrast deck for explaining autonomous AI workflows and business integration.
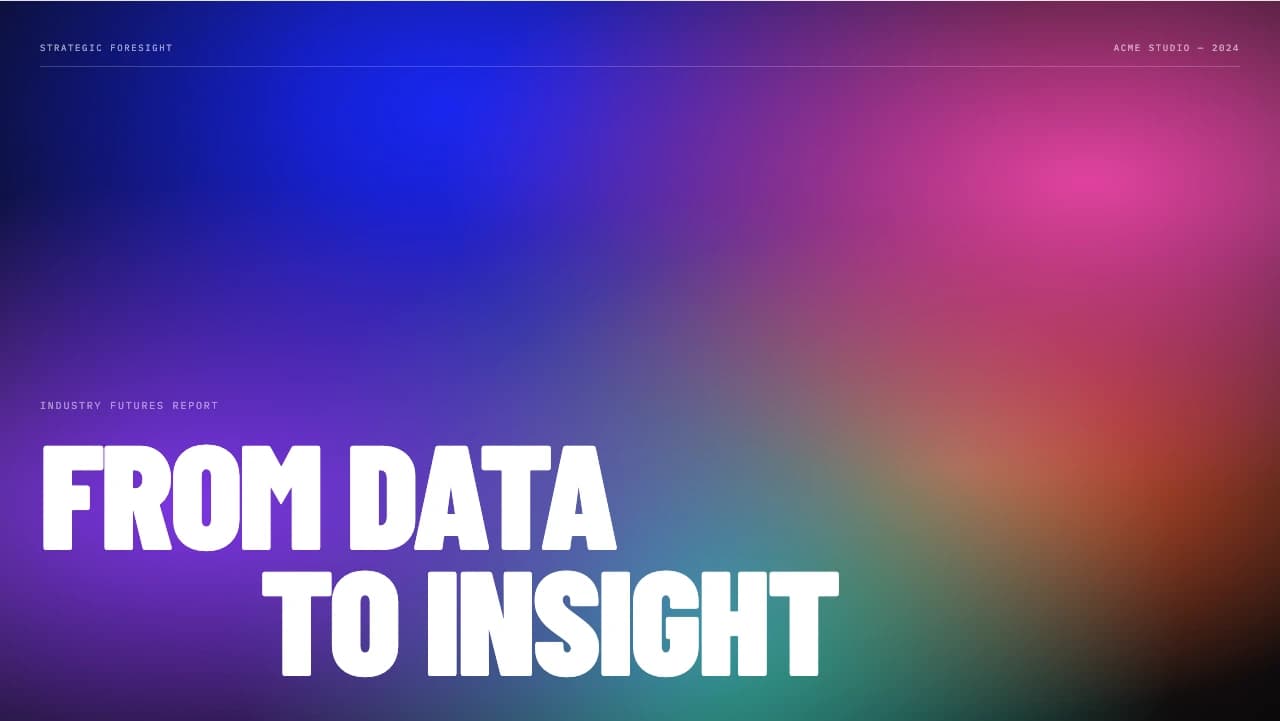
This template uses a vibrant warm-toned palette to break away from the typical cold blues of tech presentations.
The visual identity is anchored by a striking circular tiered gradient graphic in the lead slide, symbolizing layers of intelligence and growth.
Typography is handled with a bold sans-serif, prioritizing legibility for complex technical concepts.
The layout follows a logical progression from high-level statistics—housed in soft-shadowed floating cards—to detailed five-step process lists and split-screen data comparisons.
It avoids cluttered backgrounds, opting for a crisp white and deep charcoal contrast that keeps the focus on the data visualization and the 'agentic' narrative arc.
This is suited for product managers or consultants who need to communicate the practical application of AI in a business environment without losing the audience in jargon.
The color system uses a primary #F74504 orange transitioning through #FFB800 into a soft #FCF9E7 cream, creating a warm but professional atmosphere.
UI-inspired elements like rounded-corner containers (radius approx 12px) and subtle drop shadows give the slides a contemporary SaaS feel.
The iconography is minimalist, using thin-line strokes that match the weight of the body text.
A key layout pattern is the use of 'split-environment' slides, where dark mode blocks are used to highlight data metrics against a light-mode conceptual explanation, effectively guiding the eye toward quantitative results.
Every theme has a stage it belongs on. These are the moments this one was built for.
Presenting a new autonomous agent platform to potential clients, using the tiered gradient visuals to explain the complexity of the underlying LLM layers.
A consultant presenting a 5-step AI implementation roadmap to a board of directors, utilizing the clean process lists to show measurable growth phases.
A marketing lead showcasing how AI tools have reduced acquisition costs, using the split-screen data bars to compare human vs. agent-driven results.
01 / 9 02 / 9
 03 / 9
 04 / 9
 05 / 9
 06 / 9
 07 / 9
 08 / 9
 09 / 9
Pick this template, upload your content, and our AI will compose it into the 9-slide arc of AI Agents Orange Gradient Tech Presentation — your job is just to polish the key data.