01
Executive Strategy Alignment
A Chief Transformation Officer presenting a multi-year performance roadmap to the board, requiring clear data evidence and a sober, professional tone to secure funding.

Strategic data storytelling built on a foundation of high-contrast layouts and rigorous hierarchy.
This template draws inspiration from the Oliver Wyman 2025 Global Performance Transformation Report, emphasizing a clean, authoritative aesthetic.
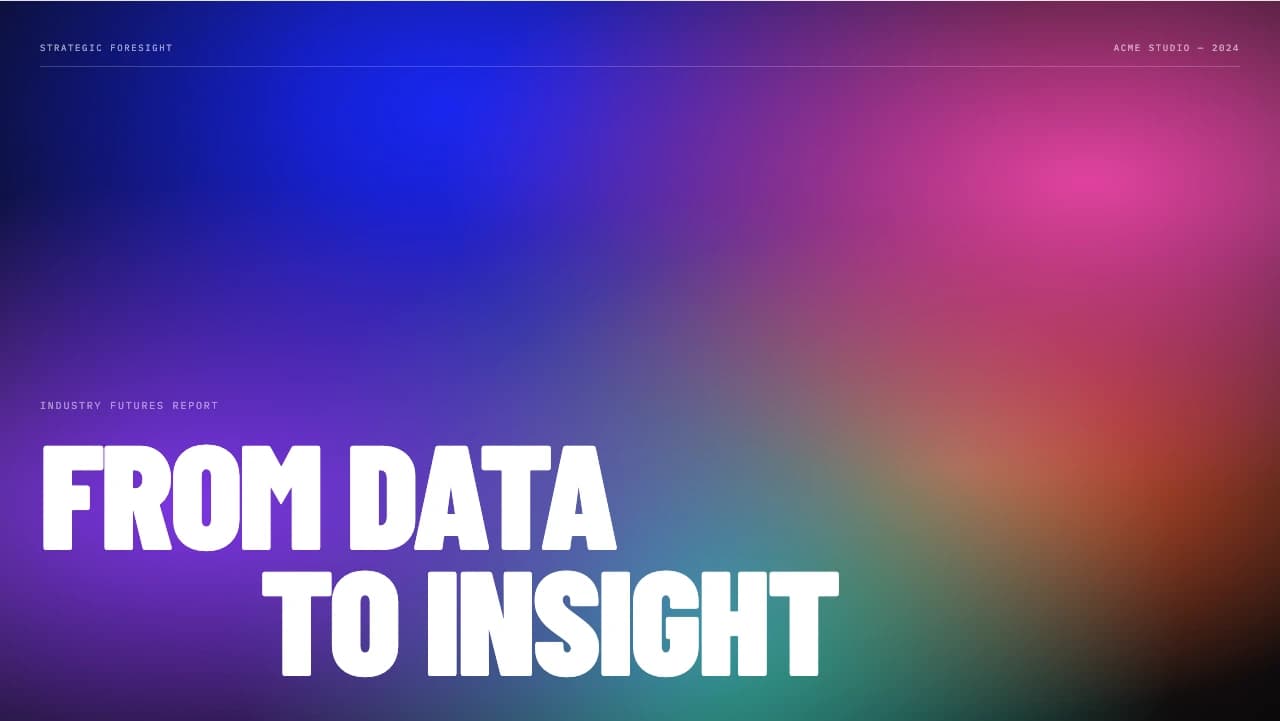
The cover slide utilizes a wide-angle urban landscape with a lone figure to establish scale, paired with bold, all-caps condensed typography that commands attention.
Internal slides transition to a white-background editorial layout, prioritizing readability for complex datasets.
You will find sophisticated bar charts that use solid black and diagonal hatching to denote year-over-year comparisons, alongside circular node diagrams for priority mapping.
The design avoids unnecessary decorative elements, relying instead on a thin horizontal rule at the top of each slide to anchor the content.
It is structured for C-suite presentations where evidence-based insights must be paired with a clear, uncompromising visual identity.
The visual system is anchored by a palette of Charcoal (#5E6467) and a muted Sand accent (#BBAE9C), providing a professional yet warm contrast.
Typography is a critical component, utilizing a tall, condensed sans-serif for primary headlines to maximize vertical space.
Data visualizations are rendered in a monochrome-plus-hatch style, which ensures clarity in high-density charts without relying solely on color.
The layout follows a strict three-column grid for body text, allowing for integrated 'Exhibits' that sit comfortably alongside analytical prose.
Negative space is used strategically to prevent dense text blocks from feeling overwhelming, while icons and directional arrows (green/red) provide immediate semantic cues for data trends.
Every theme has a stage it belongs on. These are the moments this one was built for.
A Chief Transformation Officer presenting a multi-year performance roadmap to the board, requiring clear data evidence and a sober, professional tone to secure funding.
A consulting lead delivering a competitive landscape analysis to a client, using the template's structured 'Exhibits' to compare market challenges and peer performance.
An internal research team summarizing global headwinds like inflation and supply chain shifts for regional managers, using the condensed typography for high information density.
01 / 9 02 / 9
 03 / 9
 04 / 9
 05 / 9
 06 / 9
 07 / 9
 08 / 9
 09 / 9
Pick this template, upload your content, and our AI will compose it into the 9-slide arc of Oliver Wyman Global Performance Report Template — your job is just to polish the key data.