01
Annual Shareholder Meeting
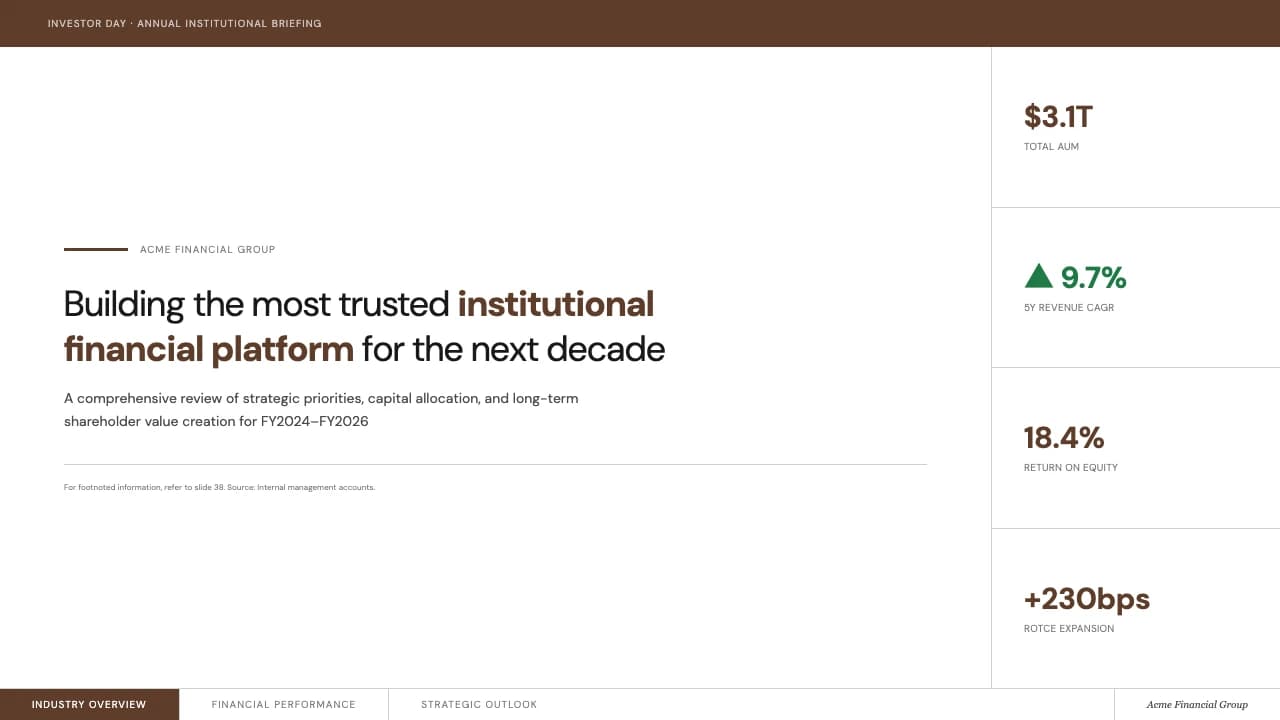
Presenting financial health and long-term value creation to investors. The clear CAGR charts and debt-to-equity visualizations help communicate fiscal discipline and growth potential effectively.

A sophisticated financial deck with curved gold accents and high-contrast editorial layouts.
This annual report template utilizes a classic navy blue (#0E1B33) and champagne gold (#C9A24B) color scheme to establish an immediate sense of institutional trust.
The cover features a bold organic curve that frames architectural photography, creating a dynamic window into the company's physical presence.
Typography is handled with a mix of elegant serifs for main headings and clean sans-serifs for data points, ensuring readability across dense financial metrics.
The slide transitions from broad executive summaries to specific data-driven sections, including bar charts for revenue growth and line graphs for debt ratios.
The inclusion of thin gold linear elements and circular iconography maintains a cohesive visual language that feels like a printed high-end magazine rather than a standard office slide deck.
The design is anchored by a 'Swoosh' motif—a thick gold curved border that separates photography from content areas.
The color system relies on a high-contrast dark navy background for sidebars and a warm cream/off-white for main content bodies, reducing eye strain while maintaining a premium feel.
Data visualization uses the primary navy and accent gold to differentiate variables, such as CAGR projections.
Layouts follow a modular grid, particularly evident in the 'Outlook' and 'Next Steps' slides, where icons are paired with vertical dividers to organize strategic pillars clearly.
The use of negative space around the gold-rimmed images prevents the slides from feeling cluttered despite the professional density of information.
Every theme has a stage it belongs on. These are the moments this one was built for.
Presenting financial health and long-term value creation to investors. The clear CAGR charts and debt-to-equity visualizations help communicate fiscal discipline and growth potential effectively.
Using the 'Outlook' and 'Next Steps' slides to showcase operational strength and alignment for potential joint ventures or major corporate alliances.
Internal high-level meetings where department heads report on revenue growth and profitability milestones using the template's consistent iconography and data layouts.
01 / 6 02 / 6
 03 / 6
 04 / 6
 05 / 6
 06 / 6
Pick this template, upload your content, and our AI will compose it into the 6-slide arc of Corporate Navy & Gold Annual Report Presentation — your job is just to polish the key data.