01
Annual General Meeting
Presenting fiscal year results to shareholders where clarity of data and a sense of institutional stability are paramount for maintaining investor confidence.

A high-contrast executive deck designed for financial storytelling and strategic roadmapping.
This presentation deck uses a high-contrast palette of midnight navy (#0B1E3F) and metallic gold (#C9A24B) to establish an executive presence.
The cover slide centers on massive 3D-modeled numbers and light-trail photography that suggests forward motion and urban growth.
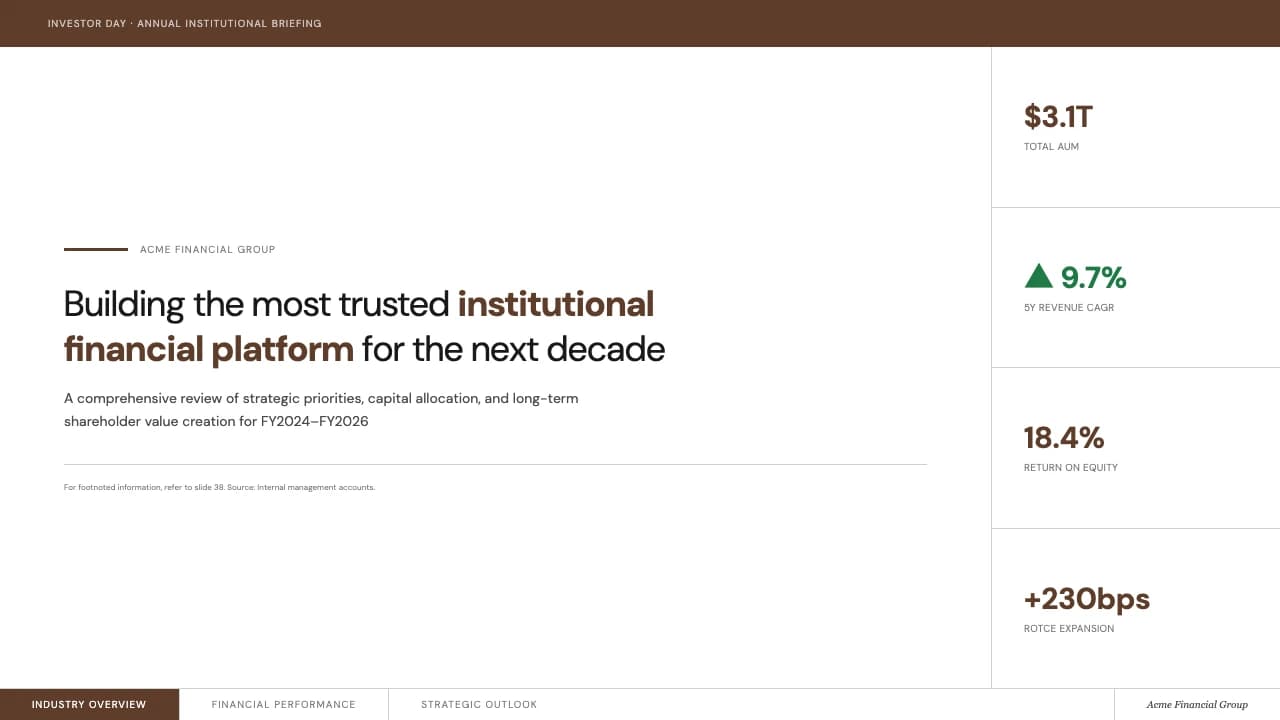
Moving into the data slides, the layout shifts to a sophisticated dashboard style.
You will find bar charts with gold gradients, line graphs tracking profitability, and a donut chart for regional revenue splits.
Each slide maintains a consistent horizontal horizon line where a cityscape meets glowing light trails, providing a grounded yet aspirational visual anchor.
The typography relies on a clean, sans-serif font family used in all-caps for headers to ensure legibility against the dark, textured backgrounds.
This structure is ideal for senior leadership teams who need to present complex financial wins alongside qualitative cultural achievements.
The visual system is built on a 'City of Light' concept, utilizing long-exposure photography of highways as a metaphor for progress.
The color system uses gradients of gold to simulate a metallic sheen, contrasting sharply against the matte navy background.
Layouts follow a modular grid, particularly evident in the 'Key Metrics' slide where cards separate financial data from qualitative takeaways.
Icons are rendered in thin-line gold circles, maintaining a minimal footprint.
The use of negative space in the upper-left corners balances the heavy visual weight of the 3D typography and light trails on the right, creating a diagonal flow that guides the viewer's eye from the brand logo to the core message.
Every theme has a stage it belongs on. These are the moments this one was built for.
Presenting fiscal year results to shareholders where clarity of data and a sense of institutional stability are paramount for maintaining investor confidence.
Department heads reporting on regional growth and operational efficiency to the CEO, using the dashboard slides to compare YoY performance.
Setting the tone for the upcoming year by reflecting on past wins and detailing the four-pillar plan for expansion and innovation.
01 / 6 02 / 6
 03 / 6
 04 / 6
 05 / 6
 06 / 6
Pick this template, upload your content, and our AI will compose it into the 6-slide arc of Corporate Year in Review with Cinematic Gold Accents — your job is just to polish the key data.