01
Quarterly Performance Review
Presenting Q1 2025 results to board members or major shareholders. Use the highlight slide to show trading revenue growth and ROE metrics alongside qualitative commentary on market volatility.

A structured financial deck using architectural motifs and high-density data visualization.
This presentation template mirrors the institutional rigor of top-tier investment banking decks.
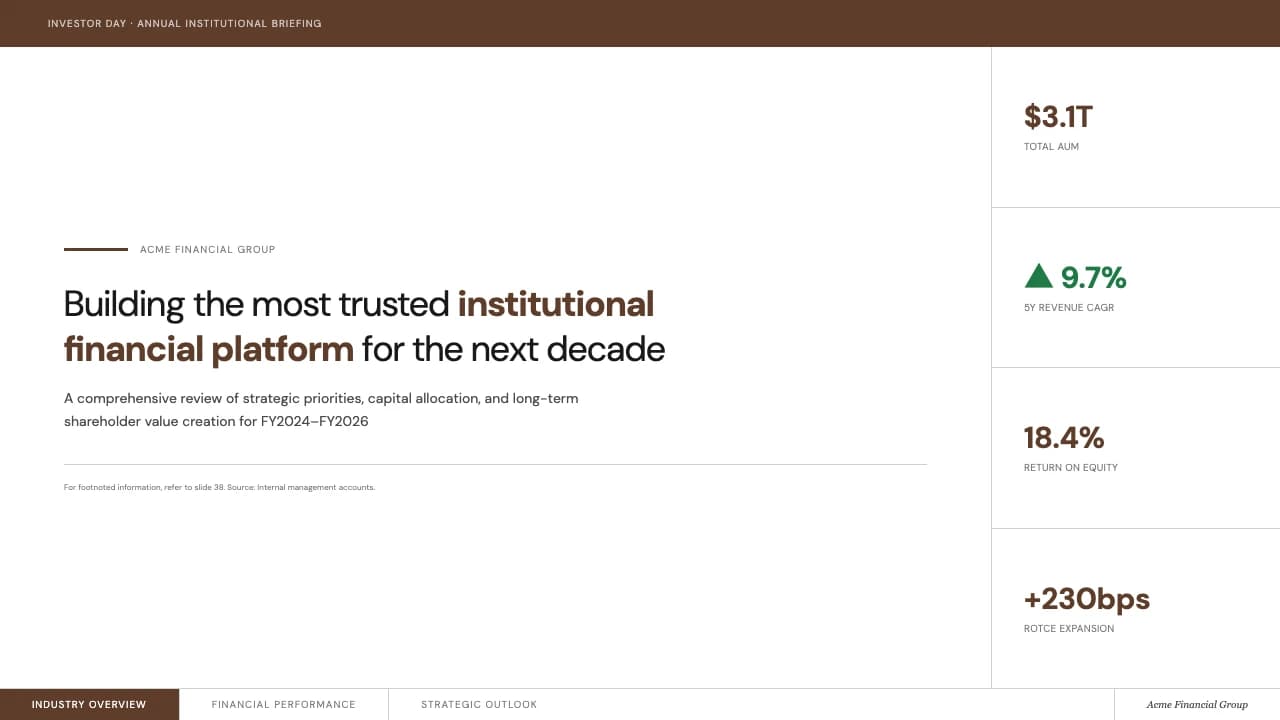
The cover utilizes a high-contrast architectural shot with a sweeping curve, establishing a sense of stability and scale.
Throughout the slides, a disciplined grid manages high-density information without crowding.
You will find specific layouts for quarterly highlights that combine circular KPIs with detailed commentary columns.
The data visualization relies on a professional blue-to-light-blue palette, specifically seen in the stacked bar charts and the horizontal chevron process flow.
This flow slide effectively breaks down complex investment methodologies into five distinct, color-coded phases.
The typography is a clean sans-serif, using weight and scale to create a clear hierarchy between large-figure AUM stats and granular footnotes.
It is designed for analysts and fund managers who need to present performance metrics and risk management frameworks to institutional clients.
The color system is built on a foundation of #C5BCB5 (Warm Grey) and #676666 (Cool Grey), accented by a corporate blue spectrum.
Layouts prioritize logical flow, using thin horizontal rules to separate headers from content.
Typography is characterized by bold, condensed sans-serif headings for immediate impact, paired with smaller, high-readability body text for data-heavy sections.
Data visualization utilizes 'ghost' icons—thin-stroke circular iconography—to categorize qualitative insights like 'Market Environment' and 'Outlook.' The use of negative space around large numerical values ($1,087Bn) ensures that key financial data remains the focal point against a clean white background.
Every theme has a stage it belongs on. These are the moments this one was built for.
Presenting Q1 2025 results to board members or major shareholders. Use the highlight slide to show trading revenue growth and ROE metrics alongside qualitative commentary on market volatility.
Asset managers pitching to pension funds. Use the 5-step workflow slide to demonstrate the disciplined process from macro assessment to trade execution and risk monitoring.
Internal department heads aligning on regional targets. The clean, data-heavy layouts allow for detailed comparison of sector-specific research and global platform supporting factors.
01 / 9 02 / 9
 03 / 9
 04 / 9
 05 / 9
 06 / 9
 07 / 9
 08 / 9
 09 / 9
Pick this template, upload your content, and our AI will compose it into the 9-slide arc of Fixed Income Investor Presentation Template — your job is just to polish the key data.