01
Quarterly Earnings Call
An IR Director presents Q1 results to analysts. The template's clear breakdown of Non-GAAP measures helps clarify the gap between reported results and managed insights, ensuring transparency for the market.

A sophisticated layout for institutional reporting and structural financial analysis.
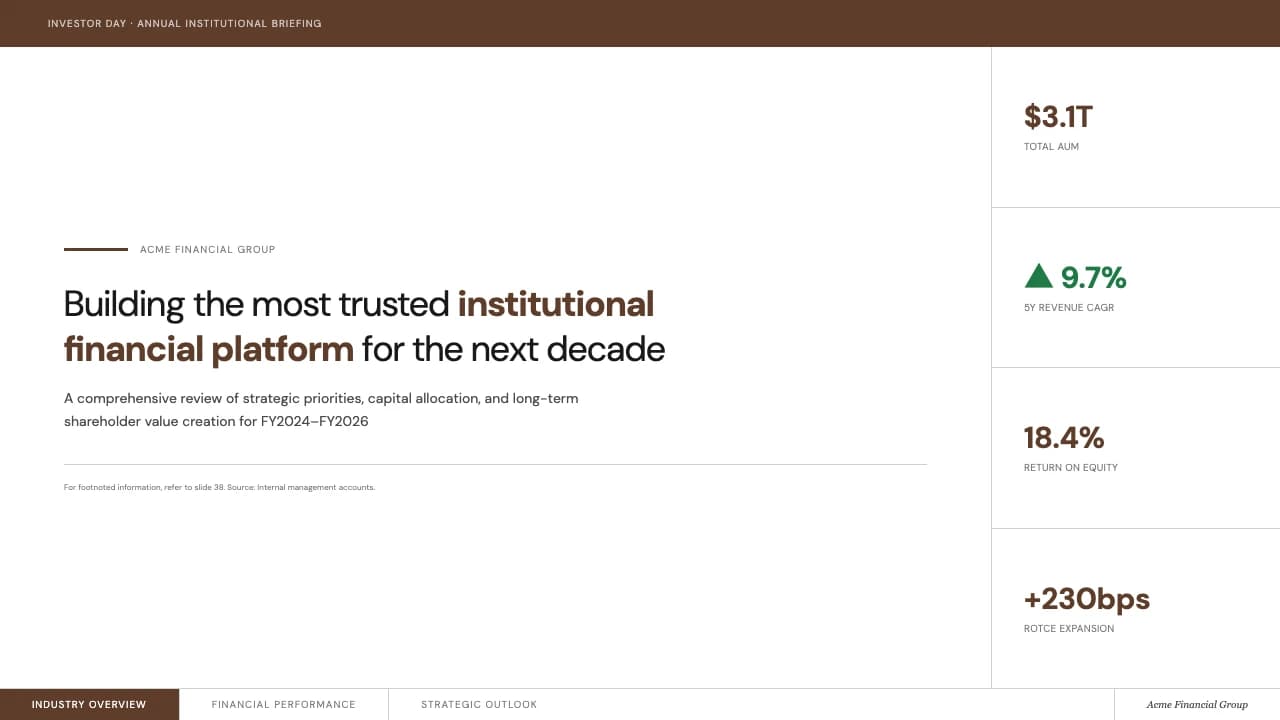
This template adopts the authoritative visual language of major financial institutions.
The color system relies on a warm #F8F5F0 cream background, providing a softer, more readable alternative to white, while #846958 mocha accents ground the typography.
The cover slide utilizes a dramatic curved architectural perspective, balancing the heavy serif headings with modern sans-serif body text.
Throughout the deck, information is organized into logical blocks—such as the five-step horizontal process flow for 'Managed Insights' and the multi-layered 'Key Benefits' list.
It includes specialized layouts for Non-GAAP financial measures, impact projections over a three-year horizon, and high-level strategic pillars.
This structure is intended for CFOs, investor relations teams, and corporate strategists who need to present complex fiscal data without sacrificing brand prestige.
The design utilizes a high-contrast typographic hierarchy, pairing a bold, traditional serif for primary headers with a clean, functional sans-serif for data points.
The color palette is intentionally restrained, using earth tones and deep blues (#1A3668) to denote different metric categories.
Layouts follow a modular grid system, often splitting the screen into a 70/30 ratio to balance primary content with sidebar definitions.
Subtle thin-line dividers and circular iconography help guide the eye through dense financial disclosures.
The use of negative space around key charts ensures that figures remain the focal point, while the consistent use of the corporate logo in the top-left corner maintains institutional alignment.
Every theme has a stage it belongs on. These are the moments this one was built for.
An IR Director presents Q1 results to analysts. The template's clear breakdown of Non-GAAP measures helps clarify the gap between reported results and managed insights, ensuring transparency for the market.
The CFO reviews the three-year impact projection with the board. The 'Illustrative Impact Over Time' chart allows for a side-by-side comparison of revenue, efficiency, and client outcomes.
A relationship manager pitches a new financial framework to a corporate client. Using the 'Key Benefits' and 'Our Approach' slides, they demonstrate a disciplined, multi-step process for long-term growth.
01 / 9 02 / 9
 03 / 9
 04 / 9
 05 / 9
 06 / 9
 07 / 9
 08 / 9
 09 / 9
Pick this template, upload your content, and our AI will compose it into the 9-slide arc of Corporate Financial Performance and Quarterly Results — your job is just to polish the key data.