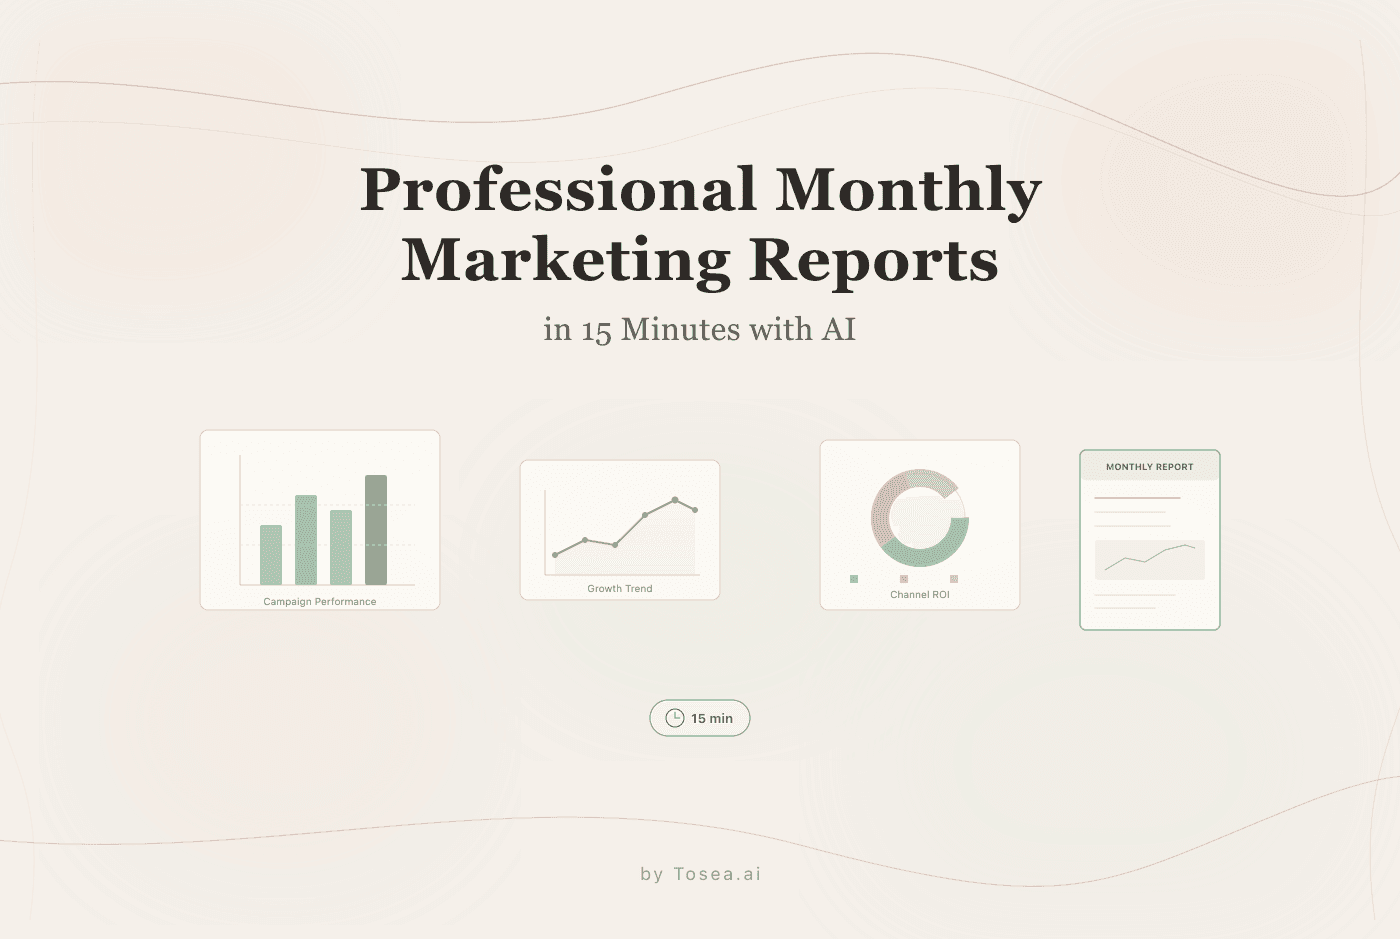
How to Create Professional Monthly Marketing Reports in 15 Minutes with AI
A practical guide for marketing managers to create data-driven monthly reports using AI agents, cutting reporting time from hours to minutes.
If you are a marketing manager staring down the barrel of another month-end reporting deadline, you know the drill: Extract campaign data from five different platforms, build pivot tables in Excel, create visualizations that actually make sense, format everything in PowerPoint to match brand guidelines, and somehow distill 30 days of activity into a coherent narrative that executives will actually read.
The entire process typically consumes 4-6 hours of your most productive working time—time that could be spent analyzing data for strategic insights or supporting customer engagement initiatives. And for what? So stakeholders can spend 90 seconds scanning your slides before asking the same questions they asked last month.
In 2026, monthly marketing reports are simultaneously the most critical and most dreaded task in corporate marketing departments. They are how you prove ROI, justify budgets, and communicate strategy. But the manual process of creating them remains an outsized drain on talent and time.
The Monthly Reporting Crisis Nobody Talks About
Marketing teams globally lose an estimated 48 hours per month—per person—on reporting activities. That's nearly 600 hours annually that could be spent on actual strategic work, creative development, or customer support. When you multiply this across all team members in a typical marketing department, the cumulative waste becomes staggering.
The problem has three dimensions:
Data Fragmentation: Your marketing metrics live in Google Analytics, Facebook Ads Manager, HubSpot, Salesforce, LinkedIn Campaign Manager, and three different email platforms. Consolidating this data requires either manual export-import cycles or expensive integration tools that still require human interpretation. Automating workflows across these disparate systems has proven nearly impossible with traditional tools.
Analytical Complexity: Modern marketing demands sophisticated attribution modeling, cohort analysis, and predictive forecasting. Most marketers lack the statistical training to implement these methods correctly, leading to either oversimplified metrics (vanity metrics like "total impressions") or expensive consultants who deliver insights weeks after they're relevant. The challenge of analyzing data from multiple sources simultaneously creates bottlenecks that slow decision-making.
Executive Communication: Even when you have the data and analysis, translating it into executive-friendly visualizations is its own skill set. The charts that impress your team often confuse the C-suite, and the simplified dashboards that executives prefer often strip away the nuance that explains actual performance.
This creates what I call the "Marketing Reporting Trilemma": You can have reports that are fast, comprehensive, or professionally presented—but traditional workflows force you to pick only two.
Why Traditional Reporting Solutions Fall Short
You've likely tried the standard approaches. Here's why they continue to underperform for marketing teams in 2026.
The "Manual Grind" Approach: Trading Time for Control
This is still the most common method: Download CSVs from each platform, copy-paste into a master spreadsheet, calculate metrics manually, build charts in Excel, transfer everything to PowerPoint, adjust formatting for 45 minutes because text boxes won't align, and finally send for review only to receive feedback that requires rebuilding three slides.
The total time investment? Anywhere from 180 to 360 minutes per month. For a marketing manager earning 2,000-$4,000 in opportunity cost per month on pure reporting mechanics.
The "Dashboard Tool" Trap
Marketing analytics platforms like Tableau, Looker, or Google Data Studio promise salvation. The reality is more nuanced.
These tools excel at real-time dashboards but falter at narrative reporting. Dashboards show what happened; reports explain why it matters and what comes next. Most executives don't want to log into yet another platform to explore interactive charts—they want a curated story delivered to their inbox.
Furthermore, these tools require significant setup time, technical knowledge for custom metrics, and ongoing maintenance when data sources change. For small-to-medium marketing teams, the ROI often doesn't materialize.
The "Agency Outsource" Option: Expensive and Slow
Some companies outsource monthly reporting to agencies or consultants. This solves the time problem but creates new issues.
External teams lack the contextual knowledge about strategic decisions, internal challenges, or competitive dynamics that make reports valuable. Their output tends toward generic insights and surface-level analysis. And at 8,000 per monthly report, the cost becomes prohibitive for all but the largest marketing budgets.
Enter the AI Marketing Report Agent: A New Paradigm
Stop thinking about reporting as a manual task. Start thinking about it as a conversation with an intelligent agent.
Tosea.ai offers a different approach to how marketing reports get created. It's not a simple dashboard that displays your data, and it's not a template that you fill in manually. It's an AI agent that understands marketing analytics, business context, and executive communication—then generates presentation-ready reports with minimal manual effort.
The platform uses a multi-agent architecture where specialized AI systems collaborate on different aspects of report generation. This approach handles complex tasks that would typically require hours of human effort.
Data Integration Agent: Connects to your marketing platforms, extracts relevant metrics, and handles data cleaning automatically. This serves as your starting point for comprehensive analysis.
Analytics Agent: Applies appropriate statistical methods (cohort analysis, attribution modeling, trend forecasting) based on your reporting goals. This agent processes your data set with the same rigor a dedicated analyst would apply.
Visualization Agent: Creates executive-appropriate charts that follow data visualization best practices and your brand guidelines.
Narrative Agent: Generates insights and recommendations based on performance patterns, competitive benchmarks, and strategic objectives.
The AI handles the mechanical work while you focus on strategic interpretation and decision-making. That said, the output is a starting point—your domain expertise and organizational knowledge remain essential for final polish.
Real-World Impact: A Case Study
Consider the experience of a SaaS company's marketing director managing a $2M annual digital marketing budget across SEO, paid search, content marketing, and social media. Her role required close collaboration with sales teams to track lead quality and conversion metrics, while also ensuring positive user experiences across all digital touchpoints.
Before Tosea.ai: Creating the monthly CMO report required gathering data from Google Analytics, Google Ads, LinkedIn, HubSpot, and SEMrush. The challenge of managing data from multiple sources was overwhelming. She would spend roughly 5 hours each month building Excel models to calculate customer acquisition cost by channel, lifetime value trends, and content ROI. The data process involved manual cleaning, transformation, and validation before any analysis could begin. Another 2 hours went into PowerPoint creation and formatting.
After Tosea.ai: She uploads raw data exports (or connects via API) and provides context: "Create our monthly CMO report. Focus on paid acquisition efficiency, content marketing ROI, and SEO performance. Compare to Q4 targets and industry benchmarks. Highlight any anomalies in conversion rates."
The AI agent processes the request, runs appropriate analyses, generates professional visualizations, and assembles a complete 15-slide deck in approximately 12 minutes. She spends 30 minutes reviewing, adding strategic commentary, and customizing 2-3 slides that require her specific domain expertise.
Total time saved: 6 hours monthly, or 72 hours annually. At her compensation level, this represents roughly $8,000 in recovered capacity that can be redirected to strategic initiatives.
It's worth noting that the first report required more hands-on review—about an hour of adjustments. The time savings compound as the AI learns your reporting preferences and you refine your prompts over successive months.
Step-by-Step: Creating Your First AI-Generated Marketing Report
Here's a practical guide on how to use Tosea.ai to replace your manual reporting workflow.
Step 1: Define Your Reporting Structure (Time: 10 Minutes)
Establish the framework once, reuse it monthly.
Prompt Example: "Create a monthly marketing report template with the following sections: Executive Summary (1 slide), Campaign Performance Overview (2 slides showing spend and results by channel), Conversion Funnel Analysis (1 slide), Content Marketing Performance (2 slides on blog traffic and engagement), SEO Progress (1 slide on rankings and organic traffic), Paid Advertising Deep Dive (3 slides on ad performance and optimization opportunities), and Strategic Recommendations (1 slide). Use our corporate color scheme: navy blue (#1B365D) and orange accent (#FF6B35)."
Step 2: Upload Your Data (Time: 5 Minutes)
Provide the raw metrics from your marketing platforms.
You can upload CSV files from each platform, connect via API for automated data pulling, or paste data directly into the interface for quick one-off reports.
Prompt Example: "I've uploaded CSVs from Google Analytics, LinkedIn Ads, and HubSpot covering January 2026. Extract relevant metrics: website traffic, conversion rates, lead generation, cost per lead by channel, and email engagement rates."
Step 3: Request Analysis and Visualization (Time: 2 Minutes)
Let the AI agent handle the analytical heavy lifting.
Prompt Example: "Run cohort analysis on the leads generated in January to calculate projected 90-day conversion rates. Compare paid vs. organic lead quality. Create a waterfall chart showing our conversion funnel from landing page visits to closed deals. Highlight where we're losing prospects."
The agent automatically selects appropriate statistical methods, generates accurate calculations, and creates professional charts optimized for executive presentation.
Step 4: Iterate and Refine (Time: 15 Minutes)
Review the initial output and make strategic adjustments.
Prompt Example: "The funnel analysis looks good, but let's break down the 'website visitors to lead' conversion rate by traffic source. Show me a table comparing organic, paid search, paid social, and referral traffic. Add a trend line showing how our overall conversion rate has changed over the last six months."
The conversational interface enables rapid iteration without rebuilding slides from scratch.
Step 5: Add Your Strategic Layer (Time: 10 Minutes)
This is where your expertise matters most. The AI provides data and initial insights; you add context, strategic interpretation, and recommendations based on organizational priorities, competitive dynamics, and market conditions that the AI can't fully know.
Total Time Investment: Approximately 42 minutes for a comprehensive monthly report that previously required 4+ hours.
Comparative Analysis: Traditional vs. AI-Assisted Reporting
| Metric | Manual Approach | Dashboard Tools | Tosea.ai Agent |
|---|---|---|---|
| Setup Time | None | 20-40 hours initial | 15 minutes first report |
| Monthly Time | 240-360 minutes | 120-180 minutes (custom slides) | 30-45 minutes |
| Data Integration | Manual export/import | API connections (technical) | Automated with guidance |
| Statistical Analysis | Basic (if any) | Requires custom formulas | Advanced methods built-in |
| Narrative Insights | Manually written | None (dashboard only) | Auto-generated + editable |
| Executive Readiness | High (if formatted well) | Low (requires explanation) | High (presentation-ready) |
| Consistency | Variable by person | High for format, low for insights | High across both |
Beyond Monthly Reports: Broader Marketing Intelligence
While monthly performance reports are the primary use case, the same AI-driven workflow extends to other reporting needs across the marketing function.
Campaign Post-Mortems: Generate detailed analysis of specific campaign performance within hours of completion, enabling rapid learning and iteration for future campaigns.
Competitive Intelligence Briefings: Upload competitor marketing data, industry benchmarks, and market research—get structured competitive positioning analysis.
Budget Planning Presentations: Create data-driven budget allocation recommendations based on historical ROI by channel, market opportunity sizing, and predictive models that forecast future performance.
Quarterly Business Reviews: Scale up from monthly reports to comprehensive quarterly strategic reviews with deeper analytics and forward-looking forecasts.
The consistent thread: The AI handles analytical complexity and production mechanics while you focus on strategic decision-making and stakeholder communication.
The ROI Calculation: Why This Matters
Let's quantify the impact for a typical marketing team.
Assumptions: Marketing manager earning $85,000 annually, spends 5 hours monthly on reporting, reduced to 45 minutes with AI assistance.
Time Saved: 4.25 hours monthly = 51 hours annually
Value of Reclaimed Time: At 2,040 annually per person
Multiply Across Team: A 5-person marketing team saves $10,200 annually in opportunity cost.
But the real value isn't just efficiency—it's capability enhancement. Teams using AI reporting agents produce more frequent insights, test more hypotheses, and respond faster to performance trends. This qualitative improvement in marketing intelligence is worth far more than the time savings alone.
Implementation Best Practices
Based on early adopter experiences, here are key success factors:
Start Simple: Begin with one monthly report before expanding to weekly dashboards or campaign-specific analysis.
Maintain Human Oversight: AI-generated insights should always be reviewed and contextualized by someone with marketing expertise and organizational knowledge. The AI may miss internal context—a product launch delay, a competitor's move, a seasonal factor—that fundamentally changes how numbers should be interpreted.
Iterate Your Templates: Your first AI-generated report won't be perfect. Refine the structure and prompts over 2-3 months to match your specific needs.
Combine with Human Storytelling: Use the AI for data processing and visualization; add your strategic narrative layer that explains implications and recommendations.
Conclusion: The Future of Marketing Intelligence
The marketing teams that will thrive in 2026 and beyond aren't those with the biggest budgets or the most sophisticated tools. They're the teams that have figured out how to spend less time assembling reports and more time acting on what the data reveals.
Monthly marketing reports are just the beginning. As AI agents mature, they'll take on progressively complex analytical tasks: multi-touch attribution modeling, predictive customer lifetime value calculation, marketing mix optimization, and real-time campaign performance forecasting.
The "reporting crisis" isn't about creating better slides—it's about freeing marketing talent from mechanical tasks so they can focus on what actually drives business results: strategy, creativity, and customer understanding. Tools like Tosea.ai are making that shift practical for teams of any size, and the marketers who adopt these workflows early will have a meaningful advantage as reporting expectations continue to rise.