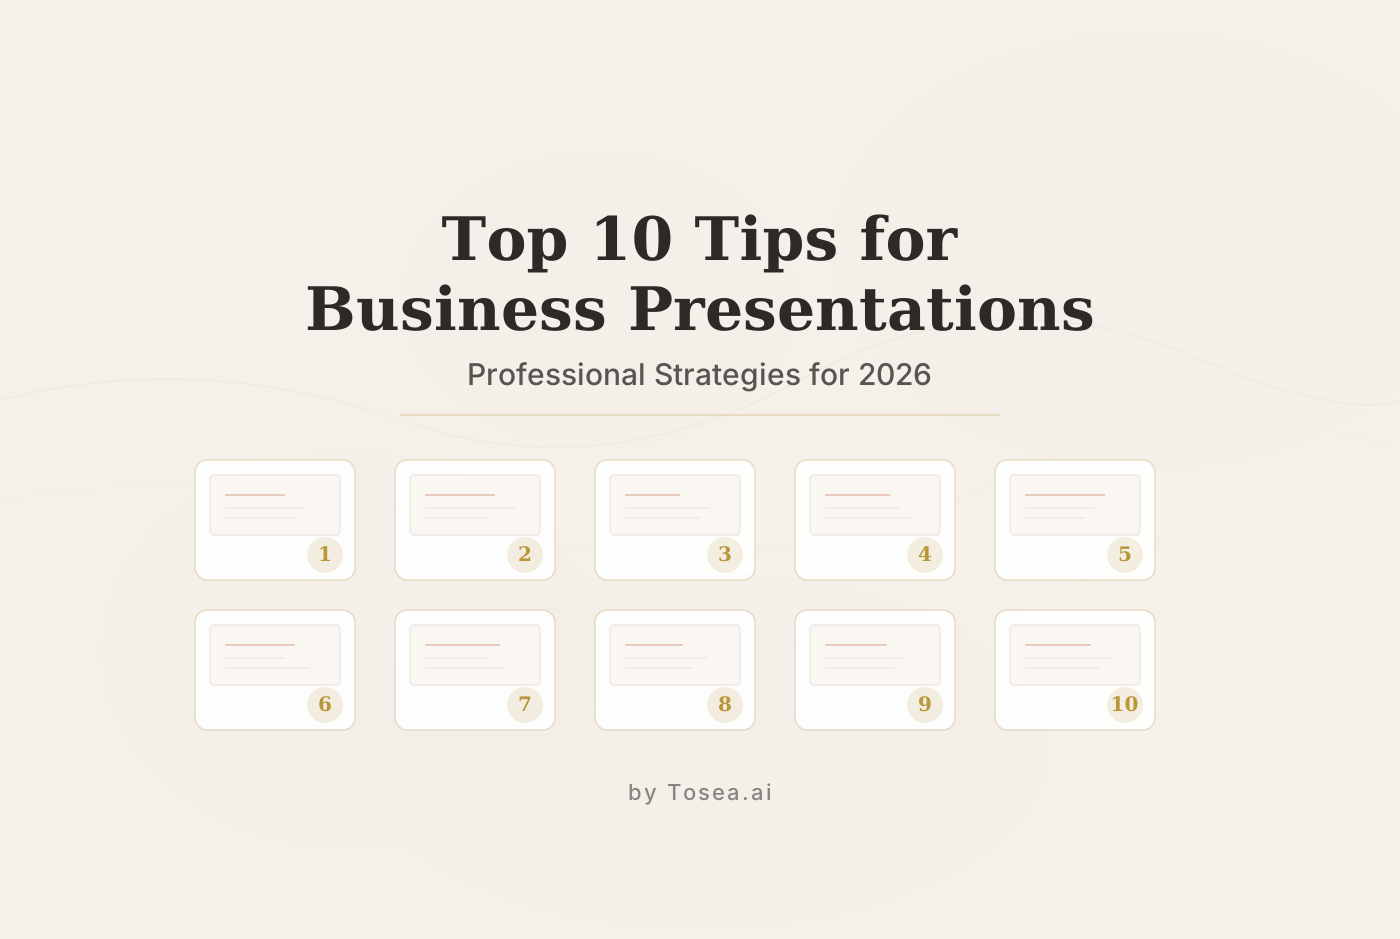
Top 10 Tips for Creating a Professional Business Presentation in 2026
Ten expert tips for building professional business presentations that combine data accuracy, visual authority, and strategic storytelling.
What Is a Professional Business Presentation?
A business presentation is more than a set of slides. It is a communication tool designed to convey key information about a company, a product, or a strategic initiative. Its purpose varies -- securing funding, aligning a team during a company meeting, proposing a project, or reporting quarterly results -- but the goal is always the same: generate a lasting impression and secure a positive outcome.
In 2026, the standard has moved well beyond aesthetic beauty. Audiences expect logical integrity, data accuracy, and a clear narrative thread. The ten tips that follow address both the strategic and tactical sides of presentation building, whether you are assembling slides manually or using AI-assisted tools like Tosea.ai to accelerate the process.
10 Expert Tips for Modern Business Presentations
1. Treat Presentations as Visual Support, Not a Script
The single most common mistake in business presentations is cluttering slides with every word of the speech. Your slides should function as a visual anchor -- a set of reference points that reinforce what you are saying, not replace it.
What this looks like in practice:
- A 100-page annual report should yield roughly 20 to 30 high-impact slides, not 100 text-heavy ones.
- Each slide should contain one core idea, supported by two to four bullet points or a single data visualization.
- If your audience can read the entire slide content in five seconds, the density is about right. If it takes thirty seconds, cut ruthlessly.
AI-powered parsing tools can help here by automatically identifying the most critical headers and data points from source documents, distilling dense material into visual summaries. Tosea.ai's layout models, for instance, isolate key structural elements so your deck reflects the document's logic rather than its verbosity.
Example: Instead of pasting a full paragraph about market growth, show a single bar chart with the headline "Market grew 34% YoY" and deliver the context verbally.
2. Establish Authority with Data Traceability
Credibility is the currency of the boardroom. If you present a figure, you must be able to defend it. Stakeholders increasingly ask, "Where does this number come from?" -- and "I think it was in the report somewhere" is not an acceptable answer.
How to build traceability into your workflow:
- Maintain a source index: for every claim on a slide, note the document, page number, and paragraph it originated from.
- Use footnotes or an appendix slide that maps each key figure back to its source.
- When using AI tools, select ones that preserve source attribution. Tosea.ai's traceability feature links every generated conclusion to the specific paragraph or table in the original file.
Example: A slide claiming "Customer acquisition cost fell 18% in Q3" should include a footnote like "Source: Q3 Operations Report, p. 42, Table 3.1." The presence of citations changes the room's perception of rigor.
3. Leverage Deep Parsing for Complex Logic
For ultra-long documents -- a 200-page IPO prospectus, a multi-year strategic plan, a comprehensive audit -- maintaining logical consistency across slides is exceptionally difficult. A footnote on page 20 may qualify a chart on page 150, and missing that connection can undermine your entire argument.
Strategies for maintaining logical coherence:
- Before building slides, create a document map: a one-page outline showing how sections relate to each other, including cross-references.
- When using AI tools for slide generation, choose platforms that handle document splitting and re-synthesis. Tosea.ai uses agentic engineering to process massive files in coordinated segments, preserving the narrative thread across sections.
- After generating a draft deck, read through it with fresh eyes specifically looking for logical gaps. Does slide 14 contradict slide 6? Does the conclusion follow from the evidence presented?
Example: Revenue projections in an executive summary (page 3) may assume different growth rates than the detailed model (page 97). Deep parsing catches this; surface-level copy-paste does not.
4. Capture Attention in the First Three Minutes
The opening of your presentation is your window of peak audience attention. Research on cognitive engagement consistently shows that listeners form a judgment about whether to pay close attention within the first two to three minutes.
Techniques for strong openings:
- Lead with a surprising or counterintuitive statistic. "We spent $4.2 million on customer retention last year. Our churn rate went up."
- Pose an open question that the rest of the presentation will answer. "What would our margins look like if we automated 40% of our fulfillment process?"
- Show a brief before-and-after comparison that sets up the narrative arc.
Avoid the common trap of starting with an agenda slide or a company overview. Those belong on slide two or three, not slide one. Your first slide should make the audience lean forward.
Example: Open with a single slide showing two numbers: last year's revenue target and the actual result. No commentary -- just the gap. The rest of the presentation explains what caused it and what the plan is.
5. Humanize the Data Through Storytelling
Behind every set of figures is a human story. Pure data, no matter how accurate, rarely moves people to action. What moves them is understanding what the data means for real people, real teams, and real outcomes.
Practical storytelling techniques:
- Frame data as a journey: "Twelve months ago, our support team was handling 3,000 tickets a month with a 72-hour average response time. Here is what changed."
- Introduce a protagonist. It could be a customer, a team, or even the company itself. "When our largest client told us they were considering competitors, we had to rethink our entire onboarding process."
- Use the AI-generated structure as a backbone, then add the "human touch" by explaining the why behind the growth or the who behind the innovation.
The most effective business presentations alternate between data slides and narrative slides. A chart showing a 40% improvement lands differently when it follows a slide explaining the specific operational change that produced it.
6. Convey Confidence Through Professional Aesthetics
Your body language and voice matter, but your visual presentation is your armor. A poorly aligned, off-brand deck subtly undermines your credibility before you say a word.
Design principles that signal authority:
- Use a consistent color palette drawn from your brand guidelines. Three to four colors maximum.
- Maintain strict alignment grids. Misaligned text boxes and uneven margins are immediately noticeable to experienced audiences.
- Follow a clear font hierarchy: one typeface for headings, one for body text, consistent sizes throughout.
- Leave white space intentionally. A slide that is 40% empty is almost always more effective than one that is 100% full.
Tools like Tosea.ai follow a consulting aesthetic modeled after top-tier firms like McKinsey and BCG, ensuring that layouts, font hierarchies, and chart placements are balanced. When your slides look authoritative, you feel more confident, which translates to better eye contact and more natural delivery.
Example: Compare two versions of the same quarterly results slide. Version A has a cluttered layout with five different font sizes, a gradient background, and clip art. Version B has a clean white background, a single headline, one chart, and two lines of annotation. Version B always wins in a professional setting.
7. Shift from Monologue to Interaction
The most memorable presentations are conversations, not lectures. Interactive elements increase retention and give you real-time feedback on whether your message is landing.
Ways to build interaction into your deck:
- Design "discussion slides" that present a finding and pose a direct question. "We've seen this trend accelerate across three markets. How is it showing up in your department?"
- Use live polls or show-of-hands moments at natural transition points.
- Use first-person plural language: "As we evaluate these options..." fosters partnership, while "As I present the options..." creates distance.
- Build in planned pauses after dense or surprising slides.
Example: After presenting a trend analysis, ask the room: "Which of these three trends represents the biggest risk for us in Q3?" This transforms passive listeners into engaged participants.
8. Lead with "Big Numbers"
Impactful data catches the eye instantly. If your company achieved a 40% growth rate, saved $2 million in operational costs, or reduced churn by 25%, that number should be the visual center of the slide -- not buried in a paragraph of supporting text.
How to present key metrics effectively:
- Isolate one to two KPIs per slide. A slide with seven numbers has zero emphasis.
- Use large, bold typography for the headline number. Supporting context goes in smaller text below.
- Provide comparison context: "40% growth" is strong, but "40% growth vs. industry average of 12%" is a story.
- AI tools with vision-language capabilities can automatically identify and highlight KPIs from source charts. Tosea.ai's parsing models are fine-tuned to recognize these performance indicators and feature them prominently.
Example: A slide with "2.1M" in 72-point font, followed by "new users acquired in Q4, up from 1.4M in Q3" in 24-point font, communicates the win instantly. The audience gets the message even if they only glance at the slide for two seconds.
9. Anticipate the "Tough Questions"
The Q&A session is where deals are won or lost. Presenting polished slides is the minimum expectation; handling unexpected challenges with composure and data is what separates good presenters from great ones.
How to prepare for Q&A:
- Before your presentation, review your source documents for potential weaknesses, edge cases, or data points that could invite scrutiny.
- Build an appendix of 10 to 15 backup slides covering topics you deliberately excluded from the main deck. If someone asks about a risk mentioned on page 84, you can pull up the relevant backup slide instantly.
- Rehearse with a colleague who plays devil's advocate. Ask them to challenge your weakest assumptions.
- For complex source material, use deep-search tools to query specific sections. Tosea.ai's document parsing allows you to search source files for particular topics, so you can internalize the details before walking into the room.
Example: An M&A team presenting a deal thesis should have backup slides on regulatory risks, integration timelines, customer overlap analysis, and historical comparable transactions -- even if none of these appear in the main 15-slide deck.
10. End with a Clear and Compelling Close
Just as you opened with a hook, end with a high note. A flat "Thank You" slide with no context is a missed opportunity. Your closing slide should crystallize the entire presentation's argument into a single, memorable takeaway.
Techniques for strong closings:
- Summarize the core value proposition in one sentence. "If we execute on these three initiatives, we project $12M in incremental revenue by Q4 2027."
- Show a forward-looking projection or roadmap that gives the audience something concrete to consider.
- If appropriate, state the specific decision or action you are requesting. "We are asking for board approval to proceed with Phase 2, which requires a $3.5M capital allocation."
- Avoid introducing new information in the closing. It should feel like a natural conclusion, not a surprise twist.
Example: A startup founder closing a Series B pitch might end with a single slide showing three numbers: current ARR, projected ARR in 18 months, and the funding amount requested. Clean, confident, and actionable.
Quick Reference Checklist
Use this checklist before every major presentation to confirm you have covered the fundamentals:
- Slide density: No slide contains more than one core idea.
- Data traceability: Every key figure can be traced to a specific source document and page.
- Logical consistency: Cross-references between slides are accurate and non-contradictory.
- Opening hook: The first slide presents a surprising insight, question, or comparison.
- Narrative thread: Data slides are interleaved with context and storytelling.
- Visual consistency: Font sizes, colors, and alignment follow a single design system.
- Interaction points: At least two moments in the deck invite audience participation.
- Big numbers featured: Key metrics are visually dominant, not buried in text.
- Q&A preparation: Appendix slides cover 10+ anticipated tough questions.
- Strong close: The final slide states a clear takeaway or specific ask.
- Rehearsed delivery: You have practiced the full presentation at least once with a timer.
- Technical check: Fonts, animations, and embedded media work on the presentation machine.
Common Mistakes That Undermine Professional Presentations
Even experienced presenters fall into recurring traps. Here are the six most common ones and how to fix them:
Overloading slides with text. When slides contain full paragraphs, the audience reads ahead and stops listening. Apply the "billboard test" -- if someone driving past at 60 mph could not grasp the slide's message, it has too much text.
Inconsistent visual design. Mixing fonts, varying colors, and uneven alignment signal a lack of attention to detail. Lock in your color palette, font stack, and margin widths before you begin, and apply them without exception.
Burying the lead. Saving your most important point for the final third of the presentation means attention has already dropped. Present your key conclusion within the first five slides and use the rest to support it.
Ignoring the audience's expertise level. A presentation that is too technical will confuse; one that is too basic will bore. Research your audience beforehand and prepare two versions of key explanations to adjust in real time.
Skipping the rehearsal. Unrehearsed presentations run long, contain awkward transitions, and suffer from poor pacing. Do at least one full run-through with a timer and a colleague who can give honest feedback.
Neglecting the appendix. When a stakeholder asks an unexpected question and you have nothing to reference, your credibility takes a hit. For every main slide, ask: "What follow-up question might this provoke?" Build a backup slide for the most likely ones.
The Technical Advantage of AI-Assisted Presentation Building
Professional-grade document conversion requires more than basic text generation. Three capabilities separate serious tools from generic ones:
Advanced parsing pipelines combine layout models and fine-tuned vision-language models to understand the visual relationship between data elements. Tables in your PDF remain as accurate, well-structured tables in your presentation rather than garbled text blocks.
Agentic orchestration handles documents exceeding 100 pages by deploying multiple processing agents for logic refinement and fact verification in parallel -- producing output that is both fast and internally consistent.
Enterprise-grade security ensures that uploaded files never participate in the training of public language models. Tosea.ai implements strict data isolation for professionals who work with sensitive financial reports, legal filings, and strategic plans.
Before Your Next Presentation: A 5-Step Action Plan
Step 1: Audit your source material (3-5 days before). Gather all documents, mark the 15 to 20 most important data points, and note any internal contradictions or gaps that need resolution.
Step 2: Build your narrative outline (2-3 days before). Write a one-page outline covering your opening hook, three to five key points, and closing ask. Every slide should map to this outline.
Step 3: Draft and design (1-2 days before). Build slides manually or with AI assistance. Check every data point against your source audit. Build appendix slides at this stage.
Step 4: Rehearse with feedback (1 day before). Run through the full presentation with a colleague. Time yourself and ask them to flag confusing slides or weak claims.
Step 5: Technical dry run (morning of). Test your presentation on the actual equipment. Check fonts, embedded media, and your clicker. Arrive early enough to resolve any issues.
Conclusion: Let Technology Support Your Strategic Thinking
Success in the boardroom comes from two things: a presentation that is logically sound and a delivery that is emotionally resonant. By applying these ten tips, you remove the friction of design and reduce the risk of inaccuracy, freeing yourself to focus on what actually matters -- the quality of your ideas and the conviction of your delivery.
The best presenters in 2026 are not those who spend the most time formatting slides. They are those who use the best tools to prepare thoroughly and then let their insights speak for themselves.
FAQ: Frequently Asked Questions
Q: Can AI presentation tools handle highly technical documents with complex charts and tables?
A: Yes. Advanced parsing pipelines are specifically designed to recognize and extract charts, complex tables, and mathematical formulas from both Word and PDF files, converting them into high-fidelity visual elements in PowerPoint. Tosea.ai's models are fine-tuned for financial statements, engineering specifications, and scientific data.
Q: How do I ensure the tone of AI-generated content matches my company's voice?
A: You can provide a specific prompt before generation. For example, "Generate this presentation with a formal, conservative tone suitable for a legal audit" or "Use a dynamic, energetic tone for a sales pitch." Most professional AI tools, including Tosea.ai, allow you to set tone and style preferences that persist across the entire deck.
Q: Is there a limit to the document size that AI tools can process?
A: Tosea.ai comfortably handles documents over 200 pages, using a split-and-merge agentic method to maintain context and logic throughout. For extremely large documents (500+ pages), it is often more effective to break the file into logical sections and process them sequentially.
Q: Can I export the AI-generated presentation to other formats?
A: Tosea.ai's primary focus is high-quality PowerPoint (.pptx) export, as this is the industry standard for professional business presentations. This allows you to perform any final manual adjustments in a familiar environment before presenting.
Q: How long does it take to generate a presentation from a large document?
A: Processing time depends on document length and complexity. A 50-page report typically produces a draft deck in under five minutes. A 200-page document may take ten to fifteen minutes. In either case, this is substantially faster than manual slide creation, which often requires eight or more hours for complex material.
Q: What if I need to update the presentation after the initial generation?
A: You can re-upload an updated source document and regenerate specific sections without rebuilding the entire deck. You can also make manual edits directly in the exported PowerPoint file.