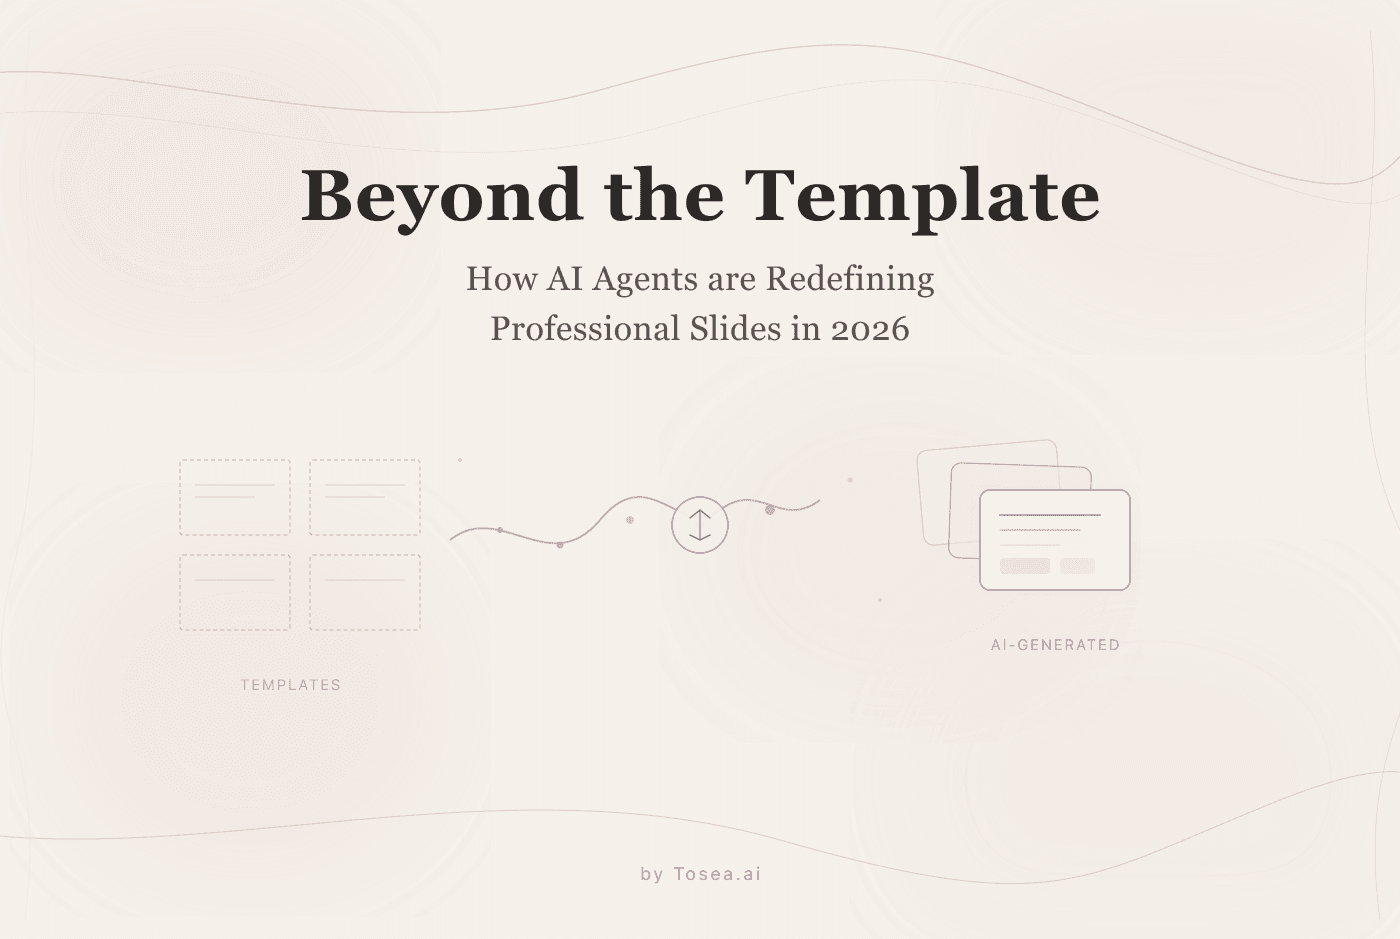
Beyond the Template: How AI Agents are Redefining Professional Slides in 2026
How AI agents are moving beyond template-based tools to deliver data-driven, analytically rigorous presentations for professionals.
Every professional who works with data knows the gap between having insights and communicating them effectively. You might spend hours building a sophisticated analysis in Python, R, or Stata—only to face the tedious process of manually transferring charts, tables, and key findings into a slide deck. In 2026, AI agents are beginning to close that gap. Rather than simply picking templates or suggesting layouts, a new generation of tools can process raw data, run statistical models, and generate presentation-ready slides that hold up under scrutiny.
Tosea.ai is one of the platforms leading this shift, designed specifically for professionals who need slides that are both visually polished and analytically sound. This article explores how agent-based AI presentation tools differ from traditional alternatives, and what that means for researchers, consultants, and corporate teams.
The Hidden Cost of the "PowerPoint Tax" in Corporate Strategy
For decades, the "PowerPoint Tax" has been a silent drain on professional productivity. Mid-to-senior level managers in large companies routinely report spending a significant portion of their work week in presentation software. While these slides are the primary vehicle for decision-making, the act of creating them—the formatting, the data cleaning, and the endless tweaking of text boxes—is a low-value activity for a high-value professional.
Take the experience of a Senior Strategy Manager at a global logistics firm. Before adopting AI tools, her routine involved a two-hour process for every weekly performance review: extracting data from internal databases, running regressions to identify supply chain bottlenecks, and then manually populating a 15-slide deck. She had tried every productivity approach available—keyboard shortcuts, PowerPoint templates, even delegating formatting to junior analysts—but nothing fundamentally solved the problem.
After integrating Tosea.ai into her workflow, that same process compressed into a 30-minute collaborative session with the AI agent. The efficiency gain allowed her to shift time away from slide mechanics and toward strategic analysis, team leadership, and market research.
This pattern extends across industries. The World Economic Forum's 2025 Future of Jobs updates highlight that AI-augmented professional services are becoming a baseline expectation in competitive firms. Consultants preparing client deliverables, marketing teams building monthly reports, and academic researchers assembling conference presentations all face the same fundamental bottleneck: translating analysis into visual communication.
Who Feels This Most
The "PowerPoint Tax" hits certain groups particularly hard:
- Academic researchers preparing conference talks and thesis defenses, who often spend more time on slides than on the research itself
- Management consultants who build 50+ slide decks weekly for client engagements
- Marketing managers creating monthly performance reports across multiple data sources
- Graduate students balancing research output with presentation requirements for seminars, lab meetings, and defenses
For each of these groups, the bottleneck isn't the quality of their analysis—it's the mechanical overhead of converting that analysis into slides.
The Paradigm Shift: From Design Tools to Analytical Agents
Most AI slide tools currently on the market are essentially enhanced template pickers. They might suggest a layout or generate a stock image, but they struggle the moment you ask them to handle actual data or complex logic. Tosea.ai takes a different approach, built on a multi-agent architecture that understands the underlying structure of your data.
The core capability lies in the platform's "One-Sentence Analysis" approach. Unlike traditional workflows where you must be the bridge between your spreadsheet and your slides, Tosea.ai allows you to point the system toward your data source and define your objective in natural language. You might tell the agent: "Analyze our Q3 regional sales data using a Difference-in-Differences (DID) model to assess the impact of the new carbon tax, then visualize the results for the executive board."
The agent then plans the data cleaning, selects the appropriate statistical model, writes the necessary code, and executes the analysis in a secure environment. The resulting slides aren't just aesthetically pleasing—they are analytically sound. This distinction matters when you need to defend your conclusions in a meeting or at a conference.
That said, AI-generated analysis should always be reviewed by someone who understands the methodology. The agent handles the mechanical work; the human provides the judgment about whether the right questions are being asked.
Visibility and Trust: The Observable AI Workflow
One of the primary barriers to AI adoption in high-stakes environments like academia and corporate finance is the "Black Box" problem. If you don't know how the AI arrived at a specific conclusion, you cannot defend that conclusion in a meeting. Tosea.ai addresses this through an observable workflow approach.
Every step the agent takes is visible to the user. On the dashboard, you can monitor the agent's reasoning process in real-time. You see the workflow planning, the code it writes to process your data, the results of that code, and the agent's diagnostic logs when something goes wrong. If the code fails or a variable is missing, the agent diagnoses the error, explains its reasoning for a fix, and tries again—all while you watch.
This transparency serves two purposes:
- Verification: Experienced professionals can confirm the AI is using appropriate methods before presenting the results to stakeholders.
- Learning: Junior team members and students can observe how analysis is structured, what diagnostic tests are applied, and how results are formatted for different audiences.
The platform also supports the practical infrastructure that professional teams need: personalized workspaces that save brand guidelines, quota management for enterprise teams, and backend architecture that prevents interference when multiple users run simultaneous analyses.
Comparative Analysis: Traditional vs. Agentic Slide Generation
To understand how agent-based tools differ from existing options, consider this comparison for a standard performance report workflow:
| Feature | Traditional Manual Workflow | Generic AI Tool | Tosea.ai Agentic Workflow |
|---|---|---|---|
| Data Handling | Manual export, cleaning, and chart creation. | Requires user to upload pre-cleaned data. | Auto-cleaning, model selection, and code execution. |
| Analytical Depth | Limited to basic descriptive stats unless user is an expert. | Surface-level summaries only. | Advanced methods (DID, RDD, IV-2SLS) built-in. |
| Error Handling | Human error in copying/pasting is common. | May hallucinate data if code fails. | Self-correcting code with observable debug logs. |
| Iteration | Re-doing slides from scratch for every change. | Limited to changing colors or fonts. | Multi-turn dialogue to refine variables and models. |
| Total Time | 120 - 180 Minutes | 45 - 60 Minutes | 15 - 30 Minutes |
Master the Art of the "Multi-Turn" Refinement
In a real research or business environment, the first draft is rarely the final draft. The value is often in the iterations. Tosea.ai supports this through multi-turn dialogue: you can refine your slides through conversation rather than starting over.
If you look at a generated chart and realize the control group should be adjusted, or if the executive team asks for a "what-if" scenario, you don't need to go back to your data source or reopen your statistical software. You simply converse with the agent: "Let's change the model to a Fixed Effects approach and see how that impacts our confidence intervals," or "These visuals are too academic; make the color palette more corporate and emphasize the ROI slide."
The agent retains the context of the entire conversation, remembering your data and the specific nuances of your project. This persistent memory means you can iterate rapidly without re-uploading files or re-explaining your goals.
Tips for Getting the Best Results
Based on working with the platform, here are practical tips for getting the most out of multi-turn refinement:
- Be specific about your data: Instead of "make a presentation about sales," say "analyze Q3 revenue by region, exclude the pilot market in Singapore, and compare year-over-year growth rates."
- Specify chart preferences early: If you prefer bar charts over pie charts, or if your organization has a specific color palette, mention this in your initial prompt.
- Review intermediate outputs: Don't wait until the final slide deck to check the agent's work. Monitor the observable workflow as it processes your data—catching issues early saves revision cycles.
- Iterate in stages: First get the analysis right, then refine the visual design. Trying to do both simultaneously can lead to confusion about which changes you're requesting.
The Authority of Rigor: Why Academic Precision Matters
The methodology behind Tosea.ai is grounded in established statistical principles. While general-purpose LLMs often struggle with the details of statistical analysis—wrong standard errors, missing diagnostic tests, inappropriate model specifications—Tosea.ai integrates a library of validated econometric and statistical methods.
This approach aligns with findings from the Stanford Digital Economy Lab, which suggests that the future of AI utility lies in domain-specific agents that prioritize factual and mathematical accuracy over linguistic fluency alone. It also reflects the IEEE's 2025 Standards for AI Transparency, which argue that for AI to be integrated into professional workflows, the underlying logic must be auditable.
No tool is perfect, and Tosea.ai is no exception. Complex analyses with unusual data structures may still require manual review and adjustment. But for standard research and business reporting workflows, the combination of embedded domain expertise and transparent execution represents a meaningful improvement over both manual processes and generic AI tools.
Practical Steps to Launch Your First Agentic Slide Deck
Getting started is straightforward. Here's the three-step process that most users follow:
1. Define the Data and the Intent: Upload your raw dataset (CSV, XLSX, or connect via link) and state your goal in natural language. Mention the specific analytical methods you'd like to use, such as "Propensity Score Matching" or "Standard OLS Regression." The more context you provide upfront—target audience, key metrics, preferred chart types—the better the initial output. For PDF-based workflows, you can upload academic papers or reports directly and have the agent extract data, figures, and key findings into a structured slide deck.
2. Monitor the Agent's Reasoning: Keep the observability interface open as the agent works. You'll see data cleaning, code execution, and model specification in real-time. This is the ideal time to intervene if you notice the agent heading in an unexpected direction. Pay particular attention to how the agent handles edge cases in your data—missing values, outliers, or unexpected data types. These are the areas where early intervention saves the most revision time downstream.
3. Iterate via Dialogue: Once the initial deck is ready, refine through conversation. Ask for stylistic changes, additional slides, or deeper analytical dives. Common refinement requests include changing the level of technical detail for different audiences (e.g., simplifying econometric results for a non-technical board versus keeping full specification details for an academic seminar), adjusting the visual hierarchy to emphasize specific findings, or adding executive summary slides that distill 15 slides of analysis into 3 key takeaways. When satisfied, export your deck in a fully editable PowerPoint (.pptx) format for any final adjustments.
Each step builds on the previous one, and the conversational interface means you're never locked into a rigid workflow. If Step 2 reveals a data issue, you can address it immediately without restarting the entire process.
Conclusion: What Changes When the Mechanical Work Disappears
The divide between the most productive professionals and the rest is increasingly defined by how they handle the gap between analysis and communication. Agent-based tools like Tosea.ai offer one answer: let the AI handle the mechanical, the mathematical, and the repetitive, so that humans can focus on the story the data tells and the decisions that follow.
This doesn't mean AI replaces professional judgment. It means that the hours previously spent on formatting, chart alignment, and manual data transfer can be redirected toward thinking about what the numbers actually mean—and what to do about them. The researcher who finishes her slides in 30 minutes instead of 3 hours doesn't just have more free time. She has the mental space to think more carefully about what her results mean and how to frame them for her audience.
The "PowerPoint Tax" isn't going away entirely—there will always be a human element in effective communication. But the mechanical portion of that tax, the part that involves no creativity or judgment, is exactly the kind of work that AI agents handle well. For professionals ready to reclaim those hours, tools like Tosea.ai are worth a serious look.