Best BCG Strategy Consulting PowerPoint Templates: 5 Frameworks and AI Prompts
Five BCG-style strategy frameworks — Growth-Share Matrix, Experience Curve, Three Cs, Four Ds, and SWOT — with original slide examples, reusable AI prompts, and a green page system.
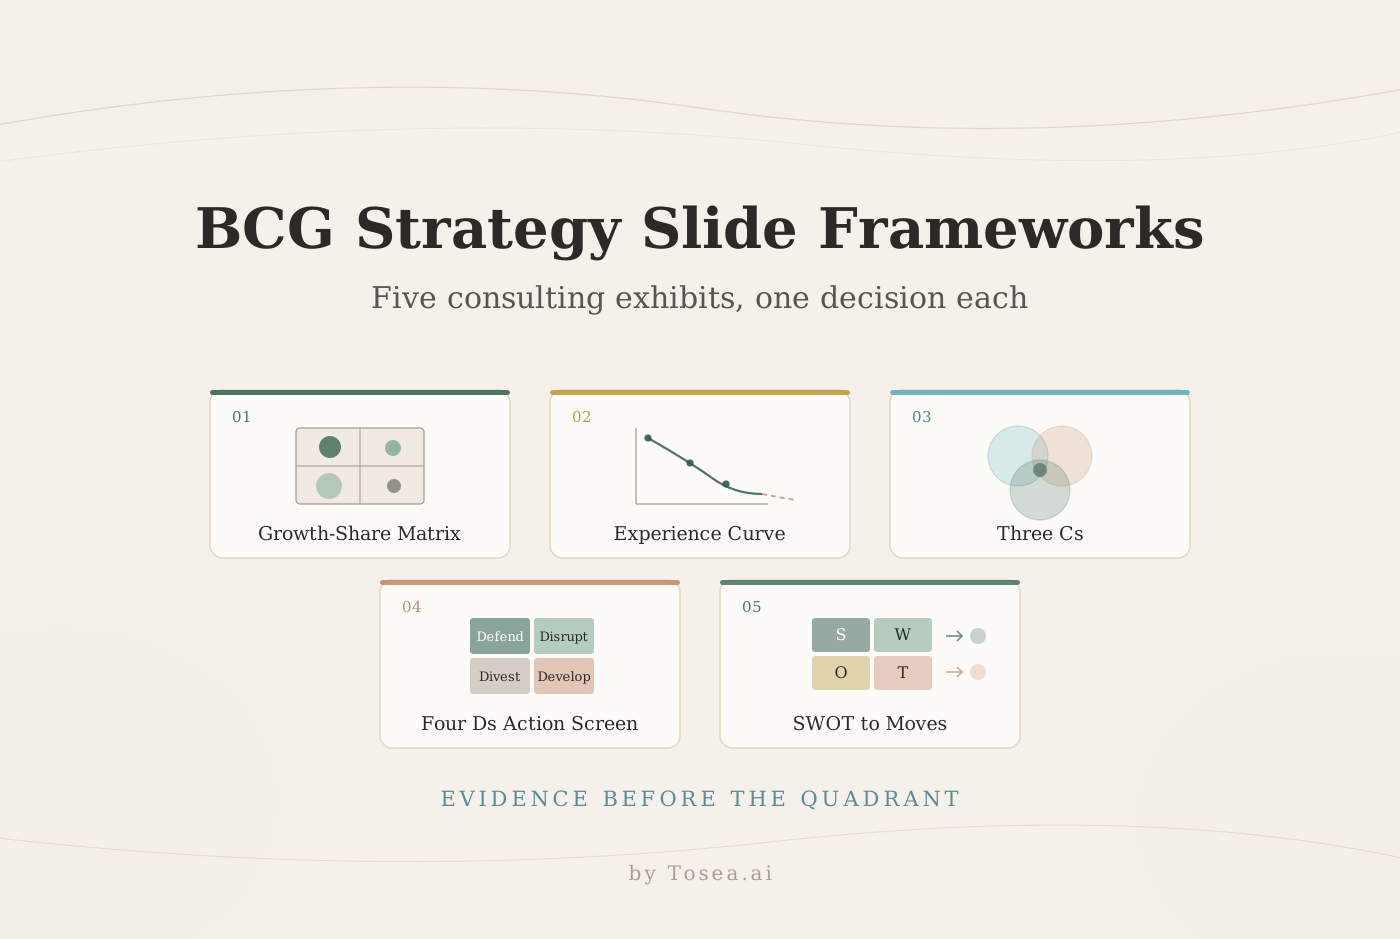
The best BCG strategy consulting PowerPoint templates turn analysis into a management choice. A green palette and a neat grid help, but each page still needs a conclusion-led title and traceable evidence. This guide covers the Growth-Share Matrix, the Experience Curve, the Three Cs, a practical Four Ds action model, and SWOT. Each section includes an original slide example, the evidence the page has to carry, the failure mode that gets it sent back, and a reusable AI prompt.
The slides below are original consulting examples. They do not reproduce BCG templates, logos, or proprietary brand assets, and the illustrative figures are placeholders rather than business evidence.
Quick answer
Start with the decision, choose the framework that matches it, and put the conclusion in the slide title. Use dark green for the main message, pale green for structure, and charcoal for supporting text. Give each page one argument, label assumptions, cite material claims, and end with an action.
Contents
- How we selected these five frameworks
- The green page system behind a BCG-style slide
- Growth-Share Matrix for portfolio allocation
- Experience Curve for cost advantage
- Three Cs for competitive positioning
- Four Ds for strategic action
- SWOT for evidence-to-action synthesis
- Choosing the right framework for the decision
- Tosea AI layout and diagram workflow
- Pre-export quality checklist
- Frequently asked questions
How we selected these five frameworks
There are several hundred named strategy frameworks in circulation, and most decks would be better with fewer of them. We picked these five against four criteria.
The framework has to answer a resource question. Every model here ends in a decision about where money, people, or attention goes — not in a description of the market. A framework that only organizes observations belongs in an appendix.
It has to survive scrutiny with public or internal data. A Growth-Share Matrix needs market growth and relative share, both of which a competent analyst can assemble. Frameworks requiring proprietary benchmark databases were excluded, because the slide cannot be reproduced by the reader.
It has to have a defensible visual form. Each of these five maps to a single exhibit — a bubble matrix, a log-scale curve, a three-circle overlap, a two-by-two action screen, a four-quadrant synthesis. Frameworks that only exist as bullet lists were excluded, since they add nothing a well-written paragraph does not.
It has to be widely enough understood that the page needs no tutorial. Executive time is the scarce input. A framework the audience has to learn during the meeting consumes the attention that belongs to the recommendation.
Not every model here originated at BCG. The Three Cs and SWOT are broader strategy tools, and Four Ds is presented as a practical action synthesis, not an official BCG framework. That is flagged again in the relevant sections, because attribution accuracy is part of what makes a consulting page trustworthy.
What makes a BCG-style strategy slide work?
Boston Consulting Group dates the Growth-Share Matrix to 1968, and Bruce Henderson popularized its portfolio logic in 1970. BCG describes it as a way to prioritize businesses by market growth and relative market share. The firm also developed the Experience Curve from cost work in the 1960s.
These frameworks support resource choices. A useful slide answers four questions in order:
- What did the analysis find?
- What evidence supports the finding?
- What does the finding change?
- What should management decide?
If a page cannot answer the fourth question, it is a research artifact rather than a decision document. That is the single most common reason a framework slide fails review.
The green page system
The visual grammar is narrow on purpose. Four elements carry almost all of the work.
Color with one job each. Dark forest green carries the main message and the recommended path. A pale, desaturated green builds structure — quadrant fills, panel backgrounds, table banding. Charcoal handles body text. A single neutral gray marks the option you are not recommending. When every element is colored, nothing is emphasized.
Typography that sorts itself. One family, three sizes: an action title around 28-32pt, exhibit labels around 14-16pt, and footnotes around 9-10pt. Bold is reserved for the conclusion, never used for entire sentences.
A grid the eye can follow. Consulting decks read left to right: the exhibit occupies roughly two-thirds of the page, the implications panel the remaining third. Keeping that split constant across the deck means the reader learns where to look once.
Restraint in the exhibit itself. Axis labels state units and periods. Bubble size encodes one variable and the legend says which. Illustrative values are labeled illustrative. Every material claim carries a source note in the footer.
The frameworks at a glance
| Framework | The decision it answers | Minimum evidence required | Where it usually fails |
|---|---|---|---|
| Growth-Share Matrix | Where should capital go across the portfolio? | Market growth, company share, largest competitor share, revenue, sources | Relative share computed inconsistently across units |
| Experience Curve | Does accumulated volume give us a real cost advantage? | Cumulative volume, real unit cost, inflation adjustment, period | Nominal costs plotted without inflation adjustment |
| Three Cs | Where do we compete, and why can we win? | Customer needs and willingness to pay, company capabilities, competitor economics | Adjectives in the circles instead of evidence |
| Four Ds | Which strategic move fits each option? | Attractiveness inputs, capability inputs, disclosed scoring scale | Undisclosed weighting that hides the real judgment |
| SWOT | What do our findings mean, taken together? | Classified internal and external facts with sources | An unranked wall of generic bullets |
1. Growth-Share Matrix: allocate capital across a portfolio
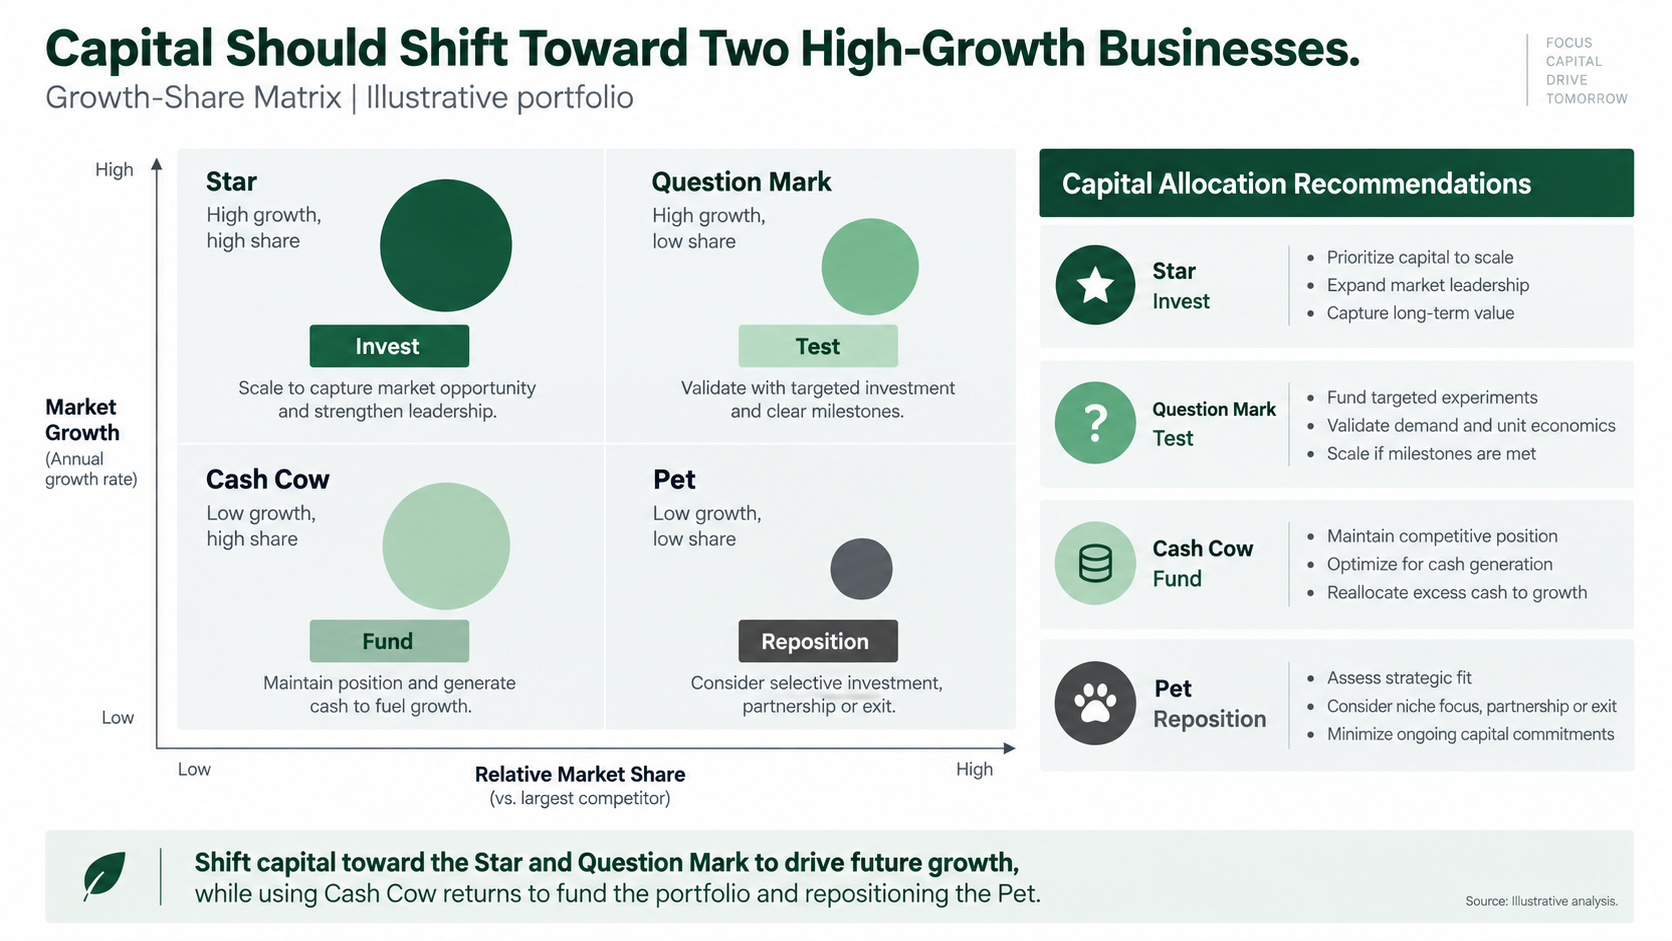
The Growth-Share Matrix helps a company allocate capital across business units, products, or markets. It maps market growth against relative market share and classifies businesses as Stars, Cash Cows, Question Marks, or Pets — historically also called Dogs.
Stars may need capital to hold leadership. Cash Cows can fund other bets. Question Marks need time-bound tests, while low-share businesses in slow markets may require repositioning or exit. Treat these as hypotheses, not automatic answers.
What the slide must show
- Relative market share defined the same way for every business — normally the unit's share divided by the largest competitor's share, with the competitor named.
- A stated market-growth period. "High growth" means nothing without "annual, 2023-2026."
- Bubble size tied to one disclosed metric, usually revenue or invested capital.
- One proposed action per business, not per quadrant. Two Question Marks can deserve different answers.
Where this slide gets sent back
The most common failure is a quadrant that drives the recommendation instead of the evidence. A business sitting just below the growth cutoff is not meaningfully different from one just above it, and a reviewer who notices the cutoff was chosen after the businesses were plotted will discount the whole page. State the thresholds before the analysis, and show a business near a boundary as near a boundary.
The second failure is treating the matrix as complete. It says nothing about competitive response, capability fit, or the cost of exit. Those belong in the implications panel.
Reusable AI prompt
Create one 16:9 executive portfolio strategy slide using a Growth-Share Matrix.
Audience: [executive committee]
Decision: [capital allocation decision]
Business units: [list]
Verified inputs: [market growth, company share, largest competitor share, revenue, sources]
Calculate relative market share consistently and size each bubble by [metric].
Label Stars, Cash Cows, Question Marks, and Pets.
Add one proposed action per business: invest, fund, test, reposition, or exit.
Write a conclusion-led title and include assumptions and source notes.
Use forest green, mint, charcoal, white, and pale gray.
Do not invent data or use BCG logos.
2. Experience Curve: test whether accumulated volume creates a cost advantage
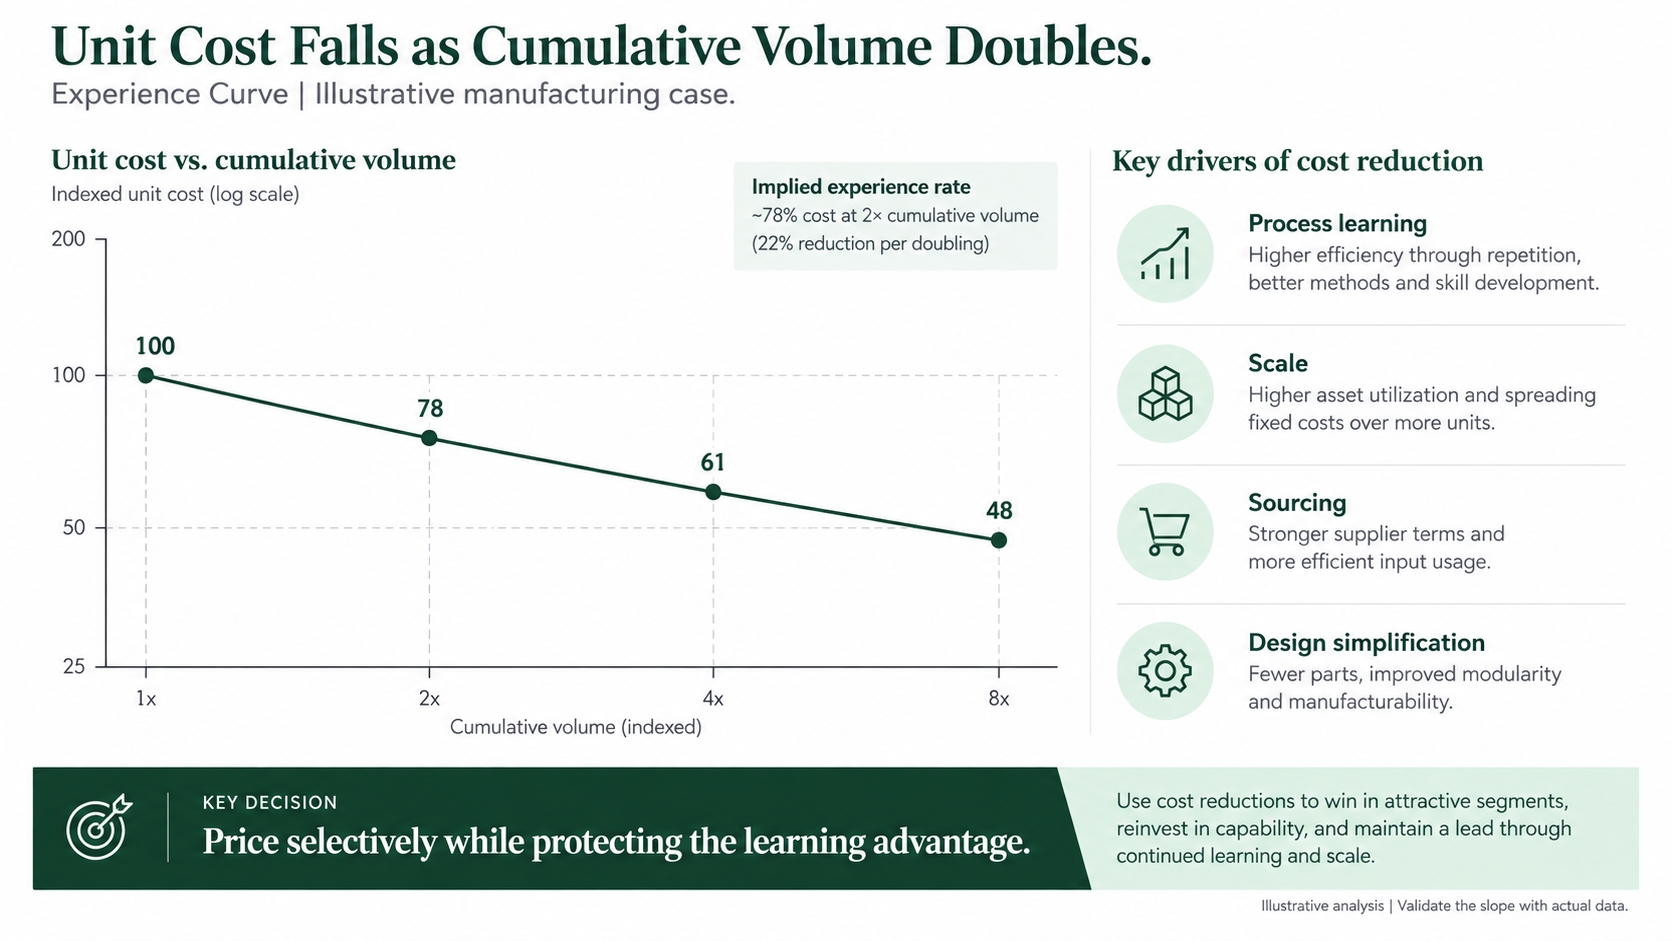
The Experience Curve tracks total unit cost as cumulative production grows. BCG states that its original research often found a 20 to 30 percent real cost decline for each doubling of accumulated volume. Unlike a labor learning curve, it can include process improvement, scale, sourcing, and design changes.
Use it for pricing, capacity, manufacturing transformation, or cost benchmarking. Be cautious when products change quickly, input prices dominate, or competitors can copy improvements cheaply.
What the slide must show
- Real unit cost, inflation-adjusted, with the deflator and base year named in the footnote.
- Log-log axes when you are claiming a constant percentage decline per doubling — a linear axis hides whether the relationship holds.
- Actual observations visually separated from forecast, normally solid versus dashed.
- The decomposition, where the data supports it: how much of the decline came from process learning, scale, sourcing, and design.
Where this slide gets sent back
Plotting nominal costs during an inflationary period produces a curve that is mostly an artifact of currency. A second failure is extrapolating the curve into a capacity decision without asking whether the mechanism still operates: if the last three years of cost decline came from a one-time sourcing renegotiation, the next doubling will not repeat it. Name the mechanism, then forecast.
Reusable AI prompt
Create one 16:9 Experience Curve slide for [product or operation].
Decision: [pricing, capacity, sourcing, or investment decision]
Use only these verified data: [date, cumulative volume, unit cost, inflation adjustment, sources].
Plot real unit cost against cumulative volume and estimate the cost change per doubling.
Separate actual observations from forecasts.
Show the contribution of process learning, scale, sourcing, and design changes where supported.
State the commercial implication and one risk to the curve.
Use a restrained green consulting layout with an action title and source footer.
Do not fabricate missing observations.
3. Three Cs: find a position that customers value and competitors cannot easily copy
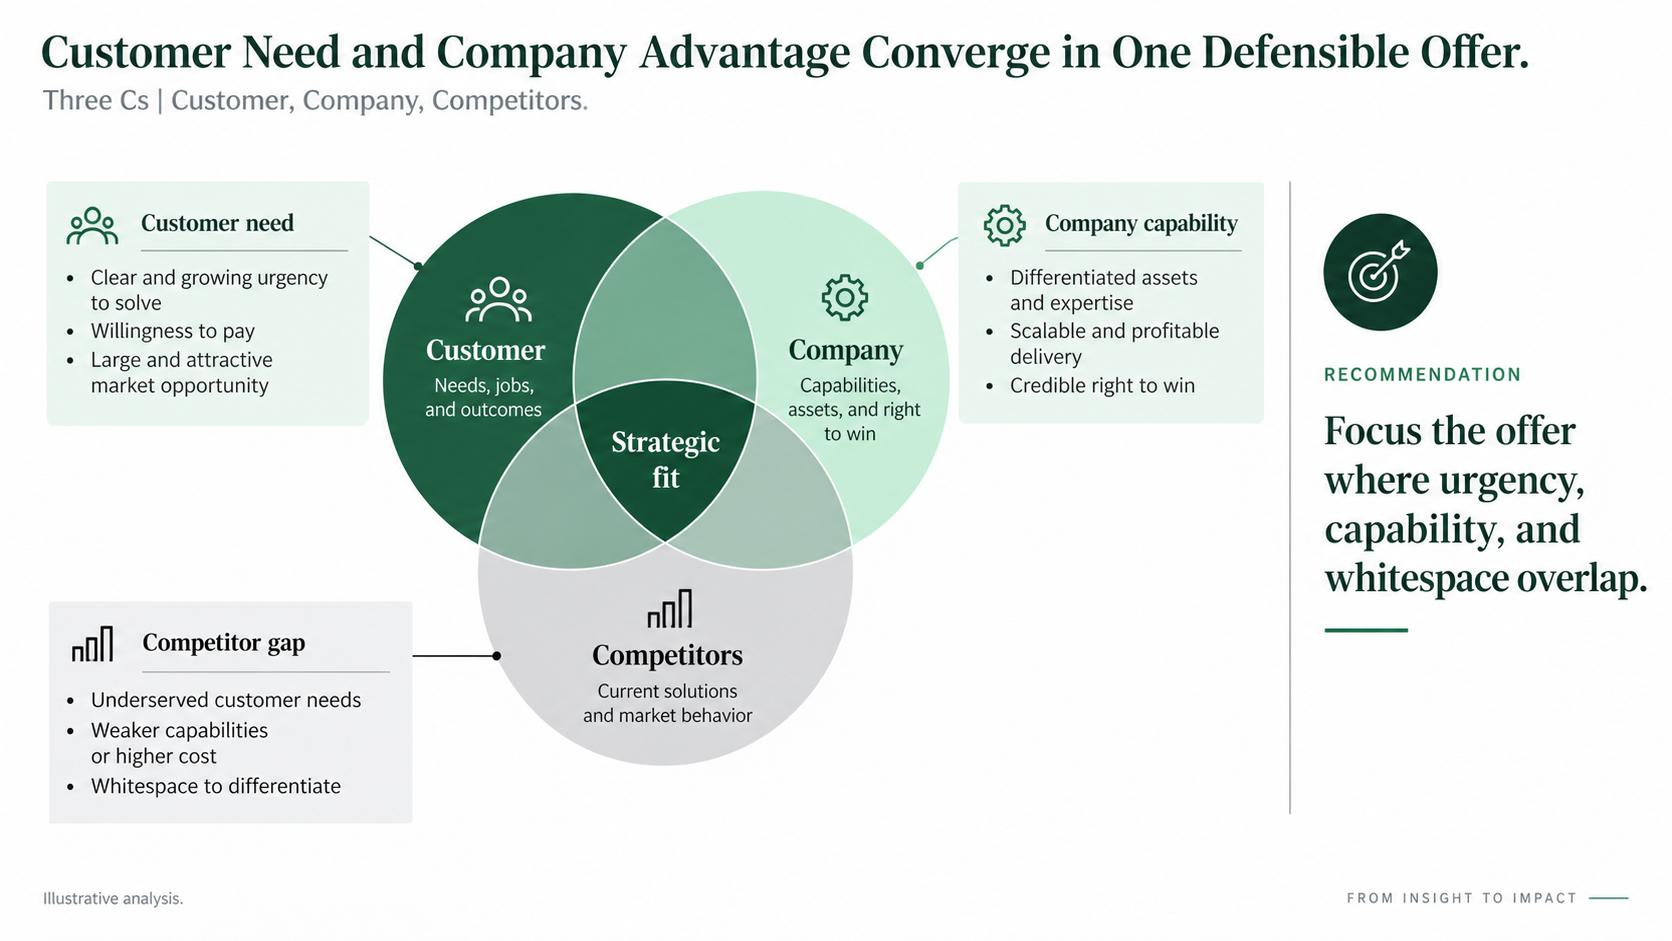
Three Cs organizes strategy around Customer, Company, and Competitors. Use it to define a value proposition, assess market entry, reposition an offer, or test the right to win.
Each circle needs evidence rather than adjectives. Customer analysis covers needs and willingness to pay. Company analysis identifies assets and constraints. Competitor analysis compares alternatives, cost positions, channels, and likely responses. The overlap is valid only when all three evidence sets support it.
What the slide must show
- A named customer segment, not "the market." Willingness to pay is segment-specific.
- Company capabilities expressed as things the company has done, with evidence, rather than things it aspires to.
- Competitor economics, not just competitor features — cost position and channel access determine whether a competitor can follow you.
- The overlap written as a sentence a salesperson could say out loud.
Where this slide gets sent back
Three Cs invites wishful thinking because the overlap is drawn before it is proven. If the customer circle says "wants faster onboarding," the company circle says "strong engineering," and the competitor circle says "slow to ship," the overlap appears self-evident — and none of the three statements carries a source. A reviewer will ask which customer said that, in what research, and how many. Put the sample size in the circle.
For a deeper treatment of the same three-lens logic in a McKinsey house style, see the McKinsey-style 3C strategy deck guide.
Reusable AI prompt
Create one 16:9 Three Cs strategy slide.
Audience: [decision makers]
Decision: [where to compete and how to win]
Customer evidence: [needs, behavior, willingness to pay, segment economics, sources]
Company evidence: [capabilities, assets, economics, constraints, sources]
Competitor evidence: [offers, prices, channels, strengths, likely response, sources]
Identify the evidence-backed overlap and write it as a specific strategic position.
Show one unresolved question if the evidence is incomplete.
Use an original forest-green consulting design, concise labels, and source notes.
4. Four Ds: match the strategic move to attractiveness and right to win
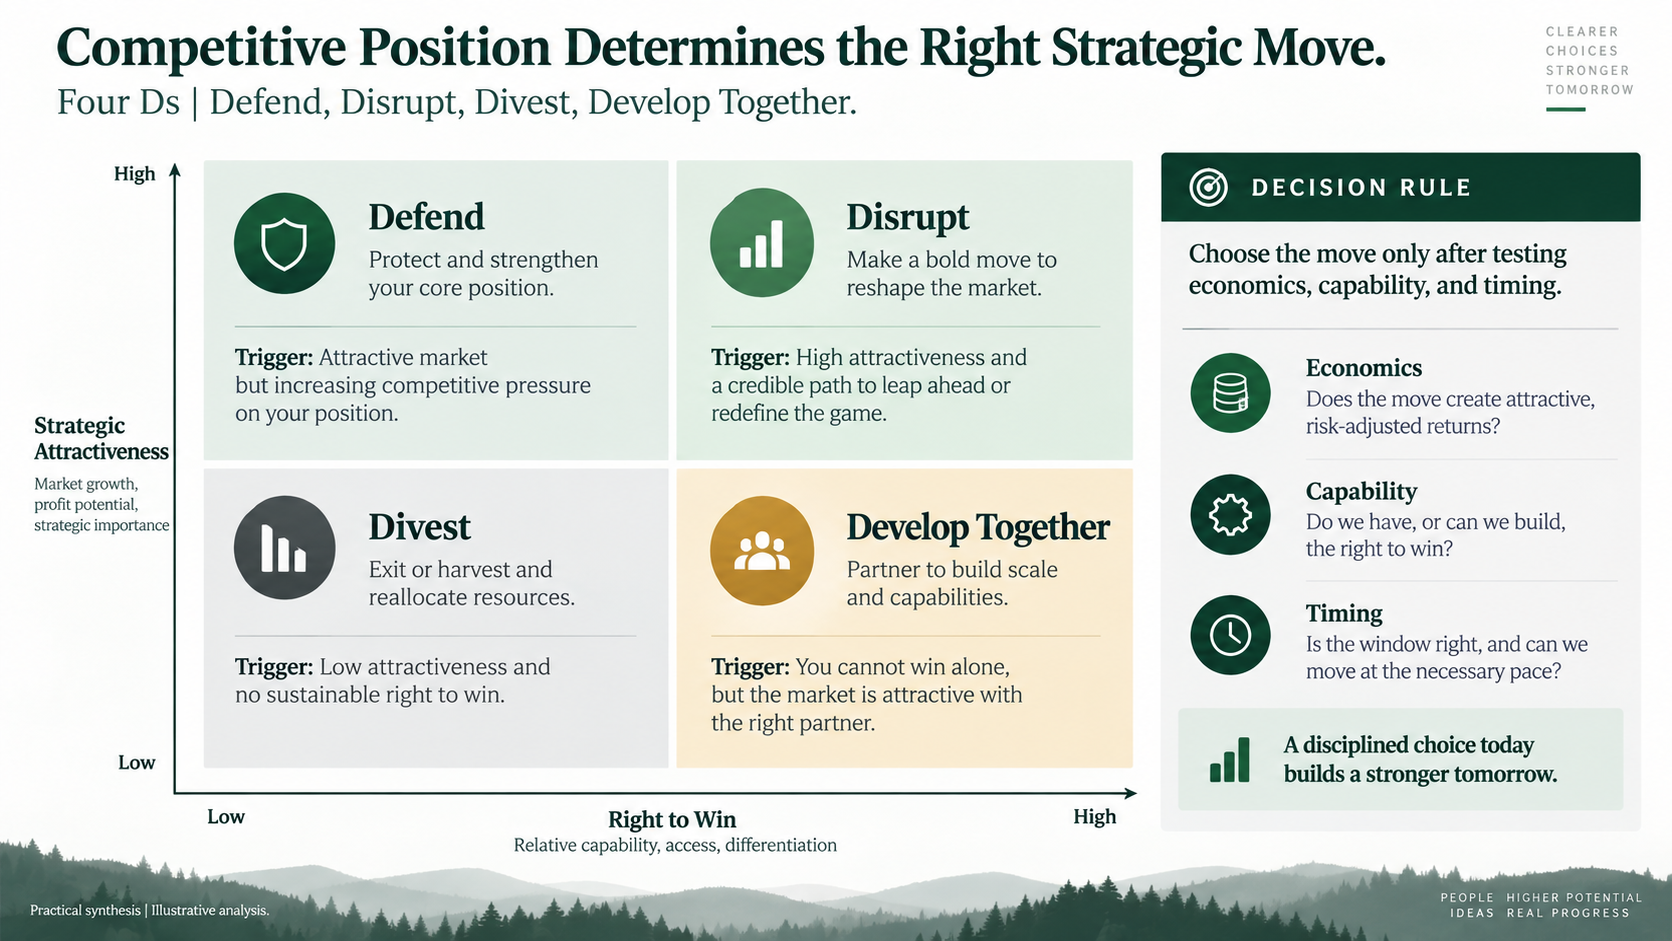
Four Ds is an action screen used after market and capability analysis. Since no single standardized version is universally recognized as a BCG classic, this guide uses Defend, Disrupt, Divest, and Develop Together.
Defend protects an attractive position under pressure. Disrupt changes the basis of competition. Divest releases resources from a weak position. Develop Together uses a partner to supply missing capability, access, or scale.
What the slide must show
- The scoring scale, disclosed on the page — a five-point scale with anchors beats an undisclosed ten-point scale.
- The weighting, also disclosed. If market attractiveness is weighted twice as heavily as right to win, the reader is entitled to know before agreeing with the conclusion.
- A trigger, an owner, and a next test for each recommended action. "Divest" without a trigger is a wish.
- Sensitivity, at least in a footnote: which option changes quadrant if one input moves.
Where this slide gets sent back
Scoring screens fail when the scores are assembled to justify a decision that was already made. The tell is a set of options that all score within a narrow band except the preferred one. Two defenses work: score the inputs before anyone sees the plotted result, and show the one input change that would flip the recommendation. A page that names its own fragility is more persuasive than one that pretends to have none.
Reusable AI prompt
Create one 16:9 Four Ds action matrix using Defend, Disrupt, Divest, and Develop Together.
This is a practical synthesis, not an official BCG model.
Options: [list]
Verified evidence: [market attractiveness, profit potential, capabilities, access, differentiation, sources]
Score each option with a disclosed scale and weighting.
Place the options on attractiveness versus right to win.
Recommend one action per option and state the trigger, owner, and next test.
Use an action title, forest green palette, pale green panels, and a compact methodology note.
Do not invent scores.
5. SWOT: convert observations into strategic moves
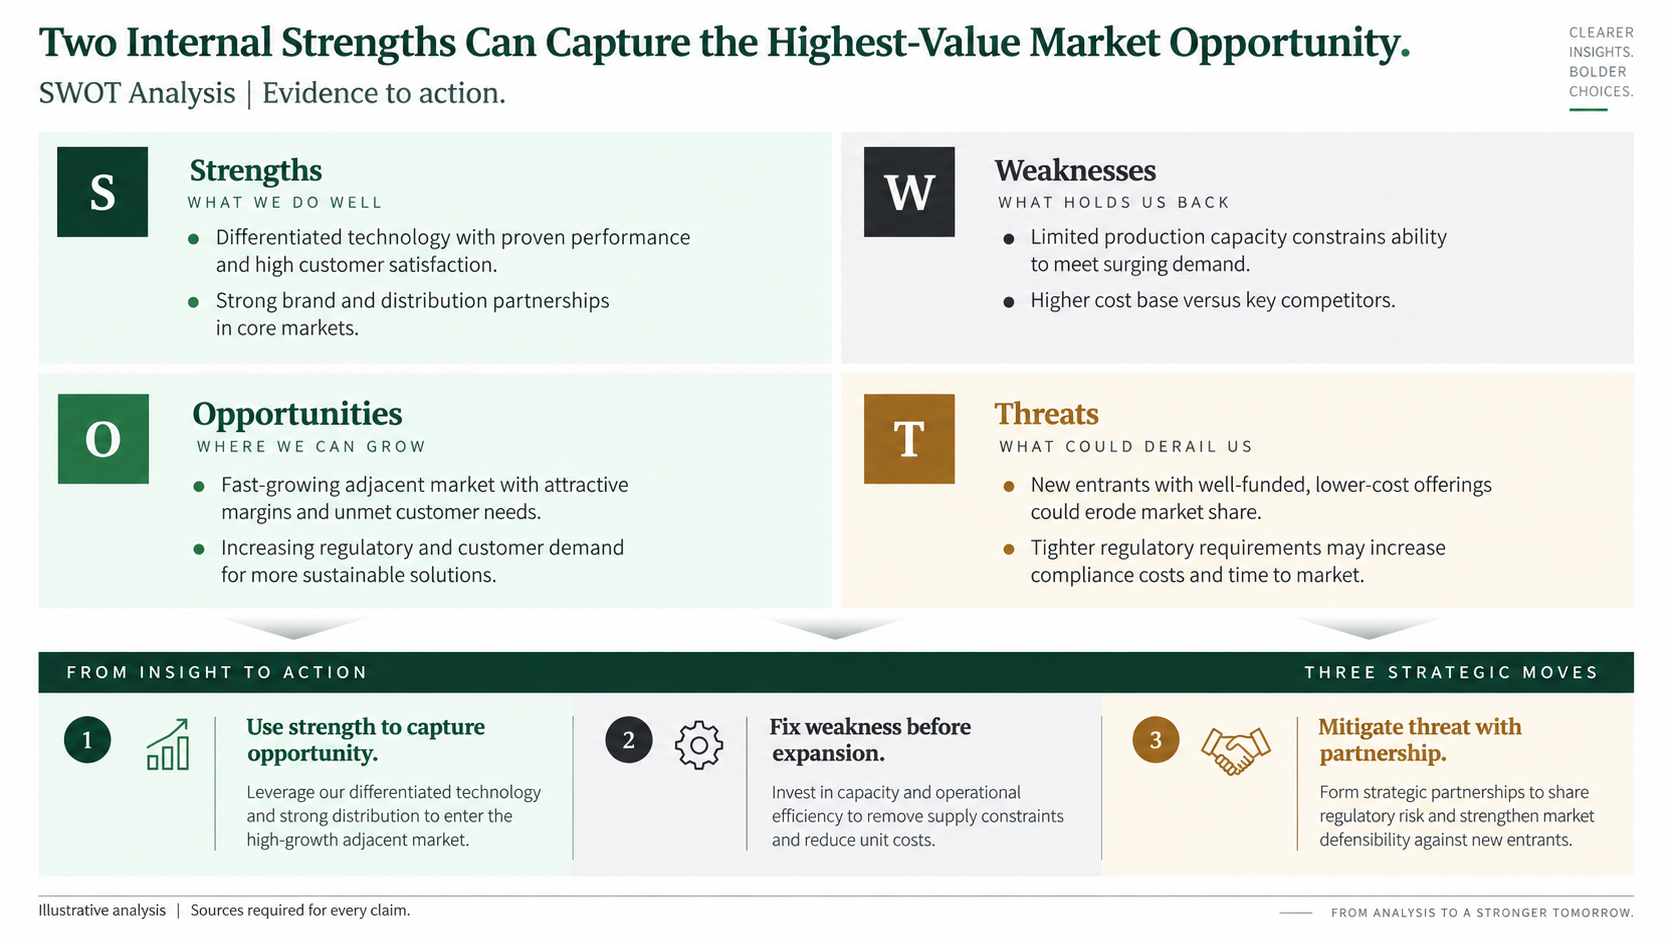
SWOT separates internal Strengths and Weaknesses from external Opportunities and Threats. Use it early in planning or as a synthesis after customer, competitor, and capability research. Without prioritization, it often becomes a wall of generic bullets.
Connect the quadrants. Match a strength to an opportunity, identify the weakness that blocks growth, and pair a material threat with mitigation. Rank every point by evidence and decision relevance.
What the slide must show
- Two points per quadrant, maximum. A SWOT with twenty-four bullets communicates that nothing was prioritized.
- Each point classified correctly: internal facts are Strengths or Weaknesses, external facts are Opportunities or Threats. A competitor's new product is a Threat, not a Weakness.
- Three derived moves — use a strength, fix a weakness, mitigate a threat — which is the part most SWOT slides omit entirely.
- An explicit evidence gap where the research is thin, rather than a confident-sounding bullet covering for it.
Where this slide gets sent back
The classic failure is that SWOT is where a deck goes to avoid a conclusion. Four boxes of adjectives feel comprehensive and commit to nothing. The fix is structural: write the three moves first, then populate the quadrants with only the findings that support or complicate them. Anything that does not touch a move goes in the appendix.
Reusable AI prompt
Create one 16:9 evidence-led SWOT slide for [company and decision].
Use only the attached sources and these verified facts: [paste evidence].
Classify internal facts as Strengths or Weaknesses and external facts as Opportunities or Threats.
Limit each quadrant to the two most decision-relevant points.
Convert the findings into three strategic moves: use a strength, fix a weakness, and mitigate a threat.
Write a conclusion-led title that states the preferred move.
Add a source note for every material claim and flag evidence gaps.
Use a restrained green consulting layout without company logos.
Choosing the right framework for the decision
Most deck problems are selection problems rather than design problems. Three pairs get confused often enough to be worth separating.
Growth-Share Matrix versus Four Ds. The matrix describes a portfolio's current shape; the action screen decides what to do about it. Running both is reasonable — the matrix on one page, the screen on the next — but running the matrix alone and treating quadrant labels as instructions is not. "It is a Cash Cow" is a classification, not a plan.
Experience Curve versus a cost benchmark. The curve claims a mechanism: cost falls because volume accumulates. A benchmark simply states that a competitor is cheaper. If you do not know why your competitor is cheaper, a benchmark chart is the honest exhibit and the curve is an overclaim.
Three Cs versus SWOT. Three Cs is forward-looking and positional; SWOT is a synthesis of what you already found. Using SWOT to select a position produces generic strategy, because the quadrants were never designed to weigh trade-offs against each other.
When two frameworks both seem to fit, pick the one whose exhibit an executive could read without the speaker in the room. That is usually the right one.
How to use Tosea AI for one-click layout and diagram changes
Tosea AI separates content planning from rendering. Upload source files, define the audience and decision, and generate an editable outline. At this stage, select a matrix, curve, Venn diagram, comparison table, timeline, or action plan for each page.
Use the outline to review order, action titles, claims, and evidence before visual polish. A Growth-Share Matrix and an Experience Curve answer different questions and need different page structures, and it is far cheaper to discover that at the outline stage than after rendering twenty slides.
A workflow that holds up in practice:
- Upload the source material — market research, the finance pack, or an existing deck exported as PDF.
- State the audience, the decision, and the evidence boundary: what the deck is allowed to assert.
- Review the outline and assign a layout or diagram to each message before any rendering happens.
- Generate the slides, then fix the action titles first. Titles are where a weak argument is most visible.
- Change the layout or diagram on any page that is too dense. Use Layout Only when the wording is approved and only the visual structure needs work — turning a list into a matrix, or a dense table into a chart, without intentionally rewriting content.
- Export an editable PPTX and inspect it in the exact PowerPoint environment used for delivery.
For a broader view of moving from raw source documents to an executive-ready deck, see the guide to turning complex files into executive presentations.
A practical quality check before export
| Check | What good looks like |
|---|---|
| Title | States a finding and a recommended direction, not a topic |
| Units and periods | Every axis and column names its unit and time range |
| Sources | Every material claim carries a footnote a reader could follow |
| Illustrative data | Labeled illustrative, in the exhibit and not only in the footer |
| Recommendation | Has an owner, a trigger, and a next test |
| Attribution | Frameworks credited accurately; no third-party logos or template assets |
| Export | Slide elements remain editable, and fonts render in the delivery environment |
Frequently asked questions
Are these official BCG templates?
No. Every slide in this guide is an original consulting-style example built for illustration. They do not reproduce BCG templates, logos, brand fonts, or proprietary assets, and the figures are placeholders. Use the structures, then replace all content with your own verified evidence.
Which framework should I use if I only have time for one slide?
Use the one that matches the decision on the table. For a capital allocation question, the Growth-Share Matrix. For a pricing or capacity question, the Experience Curve. For a positioning question, the Three Cs. For selecting among defined options, Four Ds. SWOT is a synthesis and rarely works as a standalone decision page.
Do I need real market-share data for a Growth-Share Matrix?
You need a defensible estimate and a disclosed method. Third-party market reports, competitor filings, and channel data can all support a relative-share estimate as long as the source and the definition appear on the page. What does not work is an unsourced share figure, because relative share drives the entire horizontal axis.
Can Tosea AI redesign my existing PowerPoint without changing the content?
Yes. Export the PowerPoint as a PDF, upload it to Tosea AI, and request a redesign that preserves the original wording. Use Layout Only when you want to change visual structure without intentionally rewriting content. Compare labels, citations, footnotes, and slide elements with the source before approval.
How do I upload a PowerPoint and ask Tosea AI to redesign each slide?
Export the PowerPoint as a PDF and upload that PDF to Tosea AI. Explain that each slide should be redesigned while its content and sequence remain intact. Choose a template or describe the visual direction, generate the deck, inspect every slide, and export the revised presentation.
Can I upload my own PowerPoint template to Tosea AI?
Tosea AI supports custom templates on eligible paid plans. Configure the template through the available product workflow, then confirm that the required layouts, fonts, colors, logo placement, and master-slide rules appear correctly before sharing the deck.
Can Tosea AI use custom brand colors, fonts, and a logo?
Yes. Specify the required colors and fonts in the presentation instructions, then upload the logo or use a supported custom template. Custom logo and template features are available on eligible plans. Verify font availability, color values, logo spacing, and contrast after export.
Can Tosea AI match the style of my old company presentations?
Tosea AI can use a representative company deck as design guidance. This does not imply permanent model training. For consistent output, use an approved custom template with the correct layouts, colors, fonts, and logo, then compare the generated slides with the company brand guidelines.
Does Tosea AI preserve PowerPoint formatting after export?
Tosea AI editable PPTX export is designed to stay close to the generated preview while keeping slide elements available for editing. Fonts, complex graphics, and different presentation applications can affect the result. Test the file in the exact PowerPoint setup used for delivery.
Can I tell AI to edit the layout only and keep the exact wording?
Yes. Layout Only changes the visual layout without intentionally rewriting slide content. It is useful when stakeholders have approved the wording. Compare the revised slide with the source to confirm that labels, citations, footnotes, and line breaks remain correct.
Build the framework around the decision
The best BCG strategy consulting PowerPoint templates are useful because they discipline the argument. Choose the Growth-Share Matrix for portfolio allocation, the Experience Curve for cost advantage, Three Cs for positioning, Four Ds for action selection, and SWOT for synthesis. Then replace every illustrative element with verified evidence, and let the exhibit do only the job the decision requires.
Use Tosea AI to review the storyline at the outline stage, assign layouts and diagrams, revise individual pages after rendering, and export an editable PPTX. For more consulting presentation guidance, read the practical PwC-style PowerPoint guide, the Ansoff Matrix growth deck guide, and the McKinsey-style 3C strategy deck guide.
Sources
- BCG history and the Growth-Share Matrix — Boston Consulting Group
- BCG explanation of the Growth-Share Matrix — Boston Consulting Group
- BCG Classics Revisited: The Experience Curve — Boston Consulting Group, 2013
- The Experience Curve by Bruce Henderson — Boston Consulting Group, 1968