How to Make a PwC-Style PowerPoint with AI: 5 Advanced Strategy Frameworks
Build a PwC-style PowerPoint with AI using five advanced frameworks: transfer pricing, Forget Borrow Learn, Corporate Social Performance, ECIRM, and PARTS, with slide structures and a prompt.
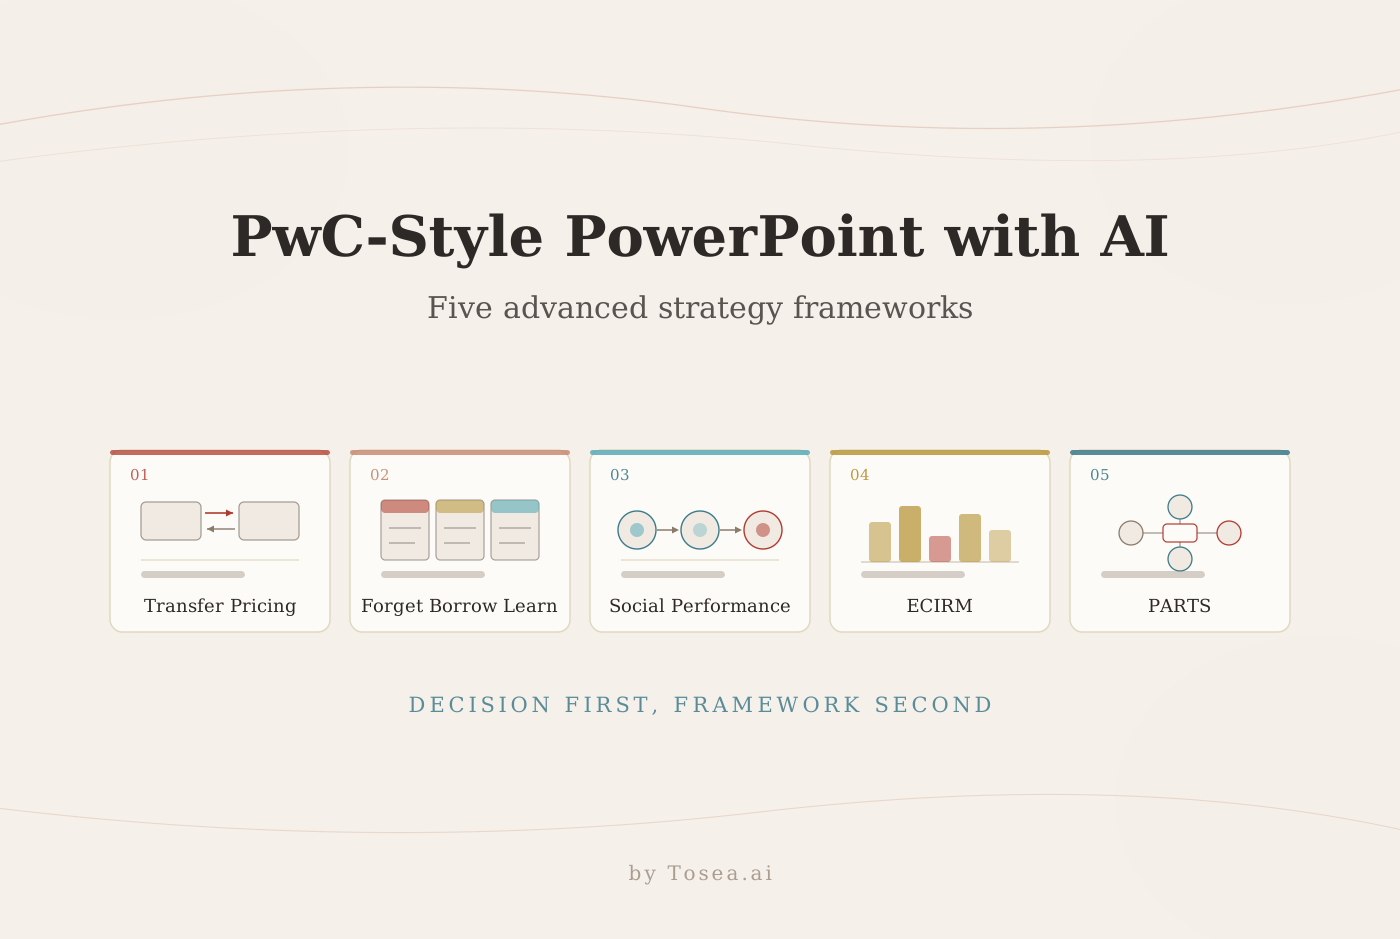
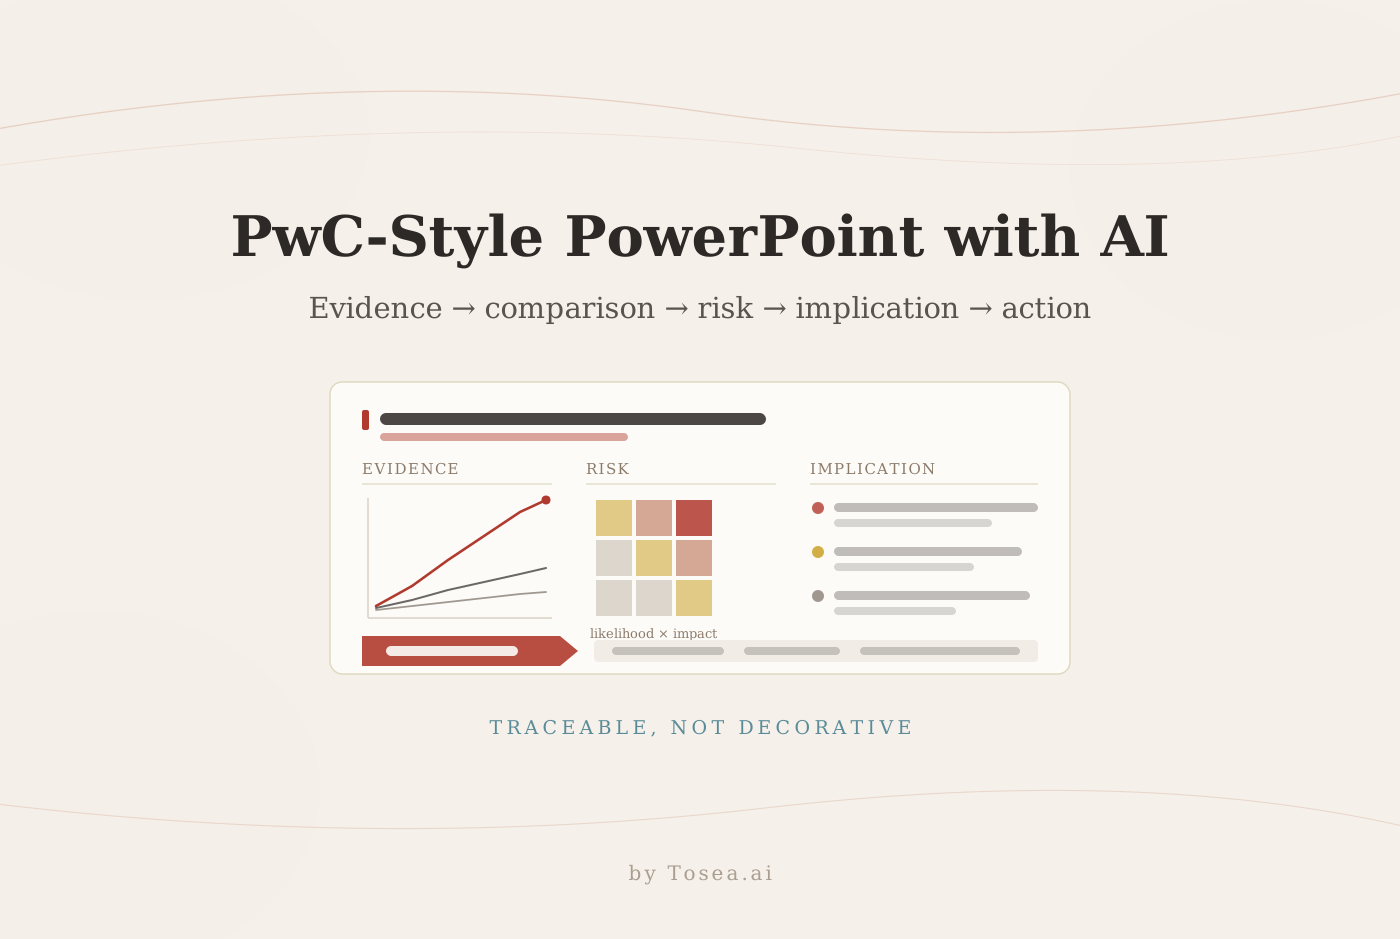
Learning how to make a PwC-style PowerPoint with AI is less about copying a red palette than about building a defensible argument. Consulting slides that survive review connect a decision to evidence, expose the relevant risk, and make the next action obvious. This guide picks up where our PwC-style consulting deck guide left off and applies five advanced strategy and management frameworks inside an editable Tosea AI workflow.
The seven frameworks in the first guide cover most commercial questions — pricing, portfolio, market selection, competitive attack and defense. The five below are the ones analysts reach for when the question is harder: a cross-border tax structure, a new venture inside a mature company, a sustainability commitment that has to produce measurable outcomes, a founder-led business in China, or an ecosystem where the rules themselves are negotiable.
Quick Answer
A PwC-style PowerPoint uses decision-led titles, disciplined evidence, standardized page structures, and restrained visual emphasis. With AI, the order matters: select the right business framework first, ground every claim in source material, review the outline before rendering, and only then generate slides. Tosea AI supports this sequence by letting you choose layouts and diagrams both before and after slide generation, then export an editable PPTX.
The Design System Behind the Frameworks
The visual grammar is covered in depth in part one, so treat this as a recap. Four elements do the work on every strong consulting page:
- A conclusion in the title. The headline states the finding instead of naming the topic.
- A visible evidence chain. Charts, tables, source notes, and assumptions support that conclusion on the same page.
- A controlled hierarchy. Red — or whichever accent you use — marks only the most important signal. Charcoal and gray carry the supporting structure.
- A decision implication. The slide says what the evidence changes, what risk remains, and what management should do next.
What changes from framework to framework is not the palette. It is the shape of the argument: which comparison the page has to make legible, and which objection it has to survive. That is why choosing the framework is a slide-design decision, not just an analytical one.
1. Transfer Pricing: Present Compliance, Economics, and Risk Together
Transfer pricing determines how related entities price cross-border transactions. It should never be presented as a shortcut for shifting profit. The OECD Transfer Pricing Guidelines frame the analysis around the arm's-length principle: a controlled transaction should be priced as independent parties would have priced it, with economic substance behind the legal form.
Use this framework when: management must review intercompany transactions, a change in the operating model, tax exposure, documentation readiness, or a new intra-group service or licensing policy.
Slide structure that holds up
A transfer pricing page usually needs four registers, and cramming them onto one slide is the most common mistake. Split them:
- Entity and transaction map. Legal entities, jurisdictions, and the flows between them — goods, services, royalties, financing. Arrows carry the direction and the value.
- Functional analysis. Functions performed, assets used, and risks assumed by each entity (the FAR analysis). This is what justifies who earns the residual profit.
- Method and benchmark range. State which of the five OECD-recognized methods applies — comparable uncontrolled price, resale price, cost plus, transactional net margin, or profit split — and show the benchmarked interquartile range with the tested party's actual result plotted against it.
- Documentation and exposure panel. Map readiness against the three-tier BEPS Action 13 structure: master file, local file, and Country-by-Country Report. Flag which files are incomplete and what that exposes.
An effective action title states the conclusion and the residual risk together: "The intra-group service fee sits inside the benchmark range, but incomplete local-file evidence in two jurisdictions leaves audit exposure unquantified."
The failure mode to avoid
Decks that present the tax outcome without the functional analysis read as advocacy, not analysis. Reviewers — internal or external — will ask the FAR question first. Answer it on the page. And keep the standing caveat visible: transfer pricing is a regulated domain, and slide content should be reviewed by qualified tax specialists before it leaves the room.
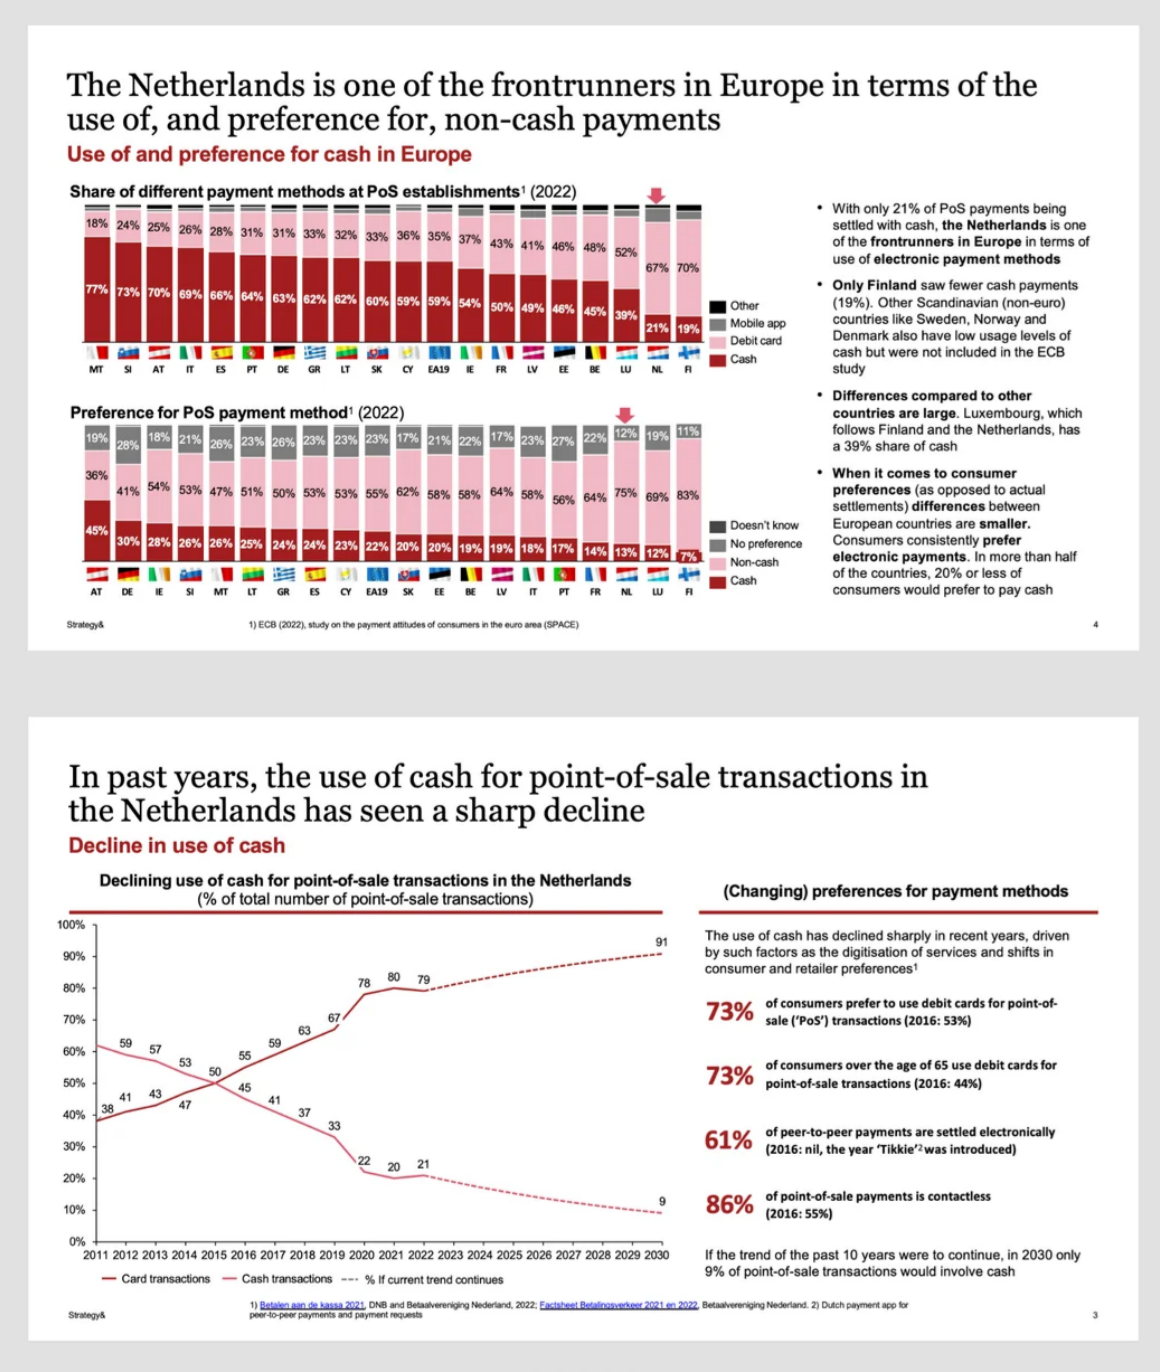
Design lesson: preserve comparison logic across categories, then explain in the margin why the difference matters.
2. Forget Borrow Learn: Structure a New-Venture Operating Model
The Forget Borrow Learn framework comes from Vijay Govindarajan and Chris Trimble, developed in Building Breakthrough Businesses Within Established Organizations (Harvard Business Review, 2005) and expanded in Ten Rules for Strategic Innovators. It addresses a specific corporate problem: a new venture inside a mature company inherits assumptions that quietly kill it, while failing to use the corporate advantages that would have saved it.
- Forget: Which legacy assumptions, incentives, processes, or success formulas would constrain the new business?
- Borrow: Which brand assets, distribution channels, customer relationships, data, or capabilities remain genuinely useful?
- Learn: Which new economics, capabilities, and operating routines must be tested against evidence rather than assumed?
Use this framework when: launching a digital business, entering an adjacent market, integrating an acquisition, or separating a growth venture from a mature core.
Slide structure that holds up
Build a three-column decision table with one row per operating dimension — customer definition, channel, talent model, technology stack, governance, and unit economics — and force three things into every row that most decks omit:
| Dimension | Forget | Borrow | Learn | Owner | Milestone |
|---|---|---|---|---|
| Unit economics | Payback measured on the core's 18-month cycle | Group procurement rates | Whether contribution margin turns positive below 40% utilization | CFO | Q2 gate |
| Channel | Exclusive dealer coverage requirement | Existing enterprise account relationships | Whether self-serve conversion clears 3% without a sales touch | CRO | Q1 pilot |
The owner and the validation milestone are what turn the framework from a workshop artifact into a management document. A "Learn" cell without a test date is a hope, not a hypothesis.
The failure mode to avoid
Two failures recur. The Borrow column becomes a wish list of corporate assets with no transfer cost attached — borrowing a sales channel that has no incentive to sell the new product is not borrowing. And the Learn column lists what the team hopes to confirm rather than what would disconfirm the plan. Write each Learn item so that a specific result would kill the venture.
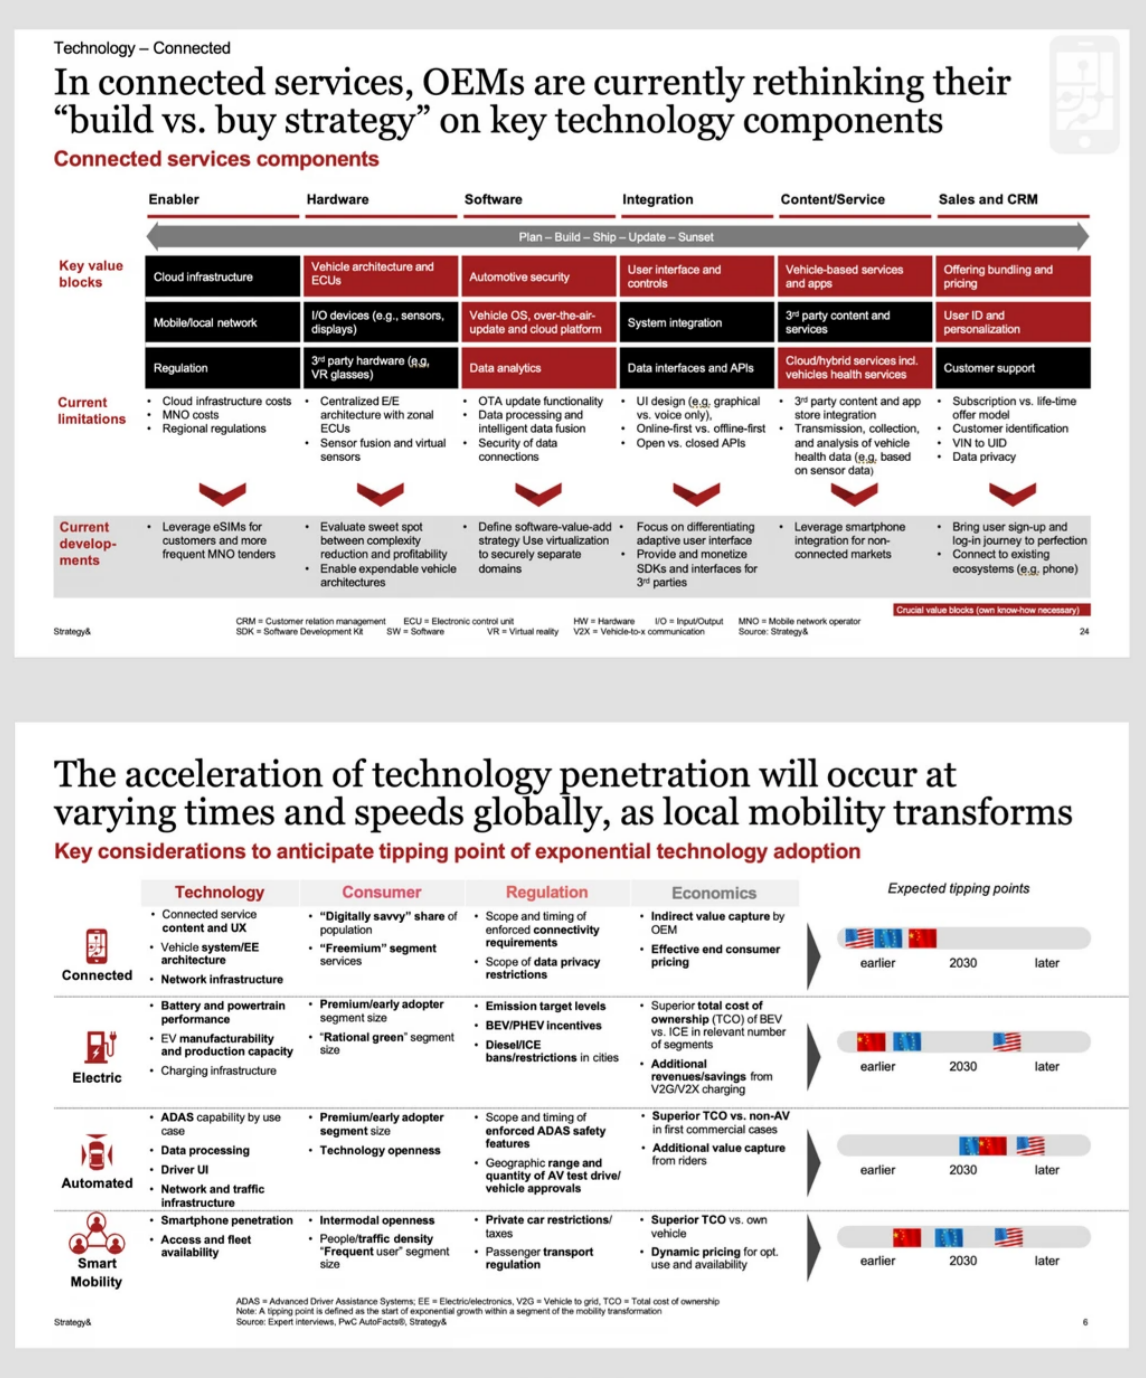
Design lesson: combine capability choices with timing and market readiness so the reader sees both what to build and when it stops paying to wait.
3. Corporate Social Performance: Connect Responsibility to Measurable Outcomes
Corporate Social Performance, or CSP, connects responsibility principles, organizational responses, and outcomes. Archie B. Carroll introduced the influential three-dimensional model in the Academy of Management Review in 1979, and revisited it in 2025 against four decades of ESG practice — a rare case where the original author has published an update you can cite alongside the classic.
The model's three axes are what make it useful on a slide:
- Categories of responsibility — economic, legal, ethical, and discretionary (philanthropic).
- The social issue involved — a specific, material topic rather than "sustainability" in general.
- The philosophy of response — reaction, defense, accommodation, or proaction.
Use this framework when: evaluating sustainability commitments, social risk, stakeholder impact, responsible product design, workforce policy, or community outcomes.
Slide structure that holds up
A CSP page should trace one chain per material issue: material issue → responsibility category → current response posture → leading indicator → lagging outcome. Putting the response posture on the page is the part most decks skip, and it is the part that makes the analysis honest. Labeling a program "defensive" when it is defensive is more credible than describing every initiative as proactive leadership.
Pair each row with the driver behind it — a regulatory deadline, a customer requirement, a supply-chain exposure — so the reader can see whether the company is choosing the commitment or absorbing it.
The failure mode to avoid
Do not present CSP as a list of charitable activities. A page that shows volunteer hours and donation totals answers a question nobody in the room asked. Connect each issue to exposure, stakeholder expectation, management action, and a measurable outcome, and separate the leading indicators you control from the lagging outcomes you can only influence.
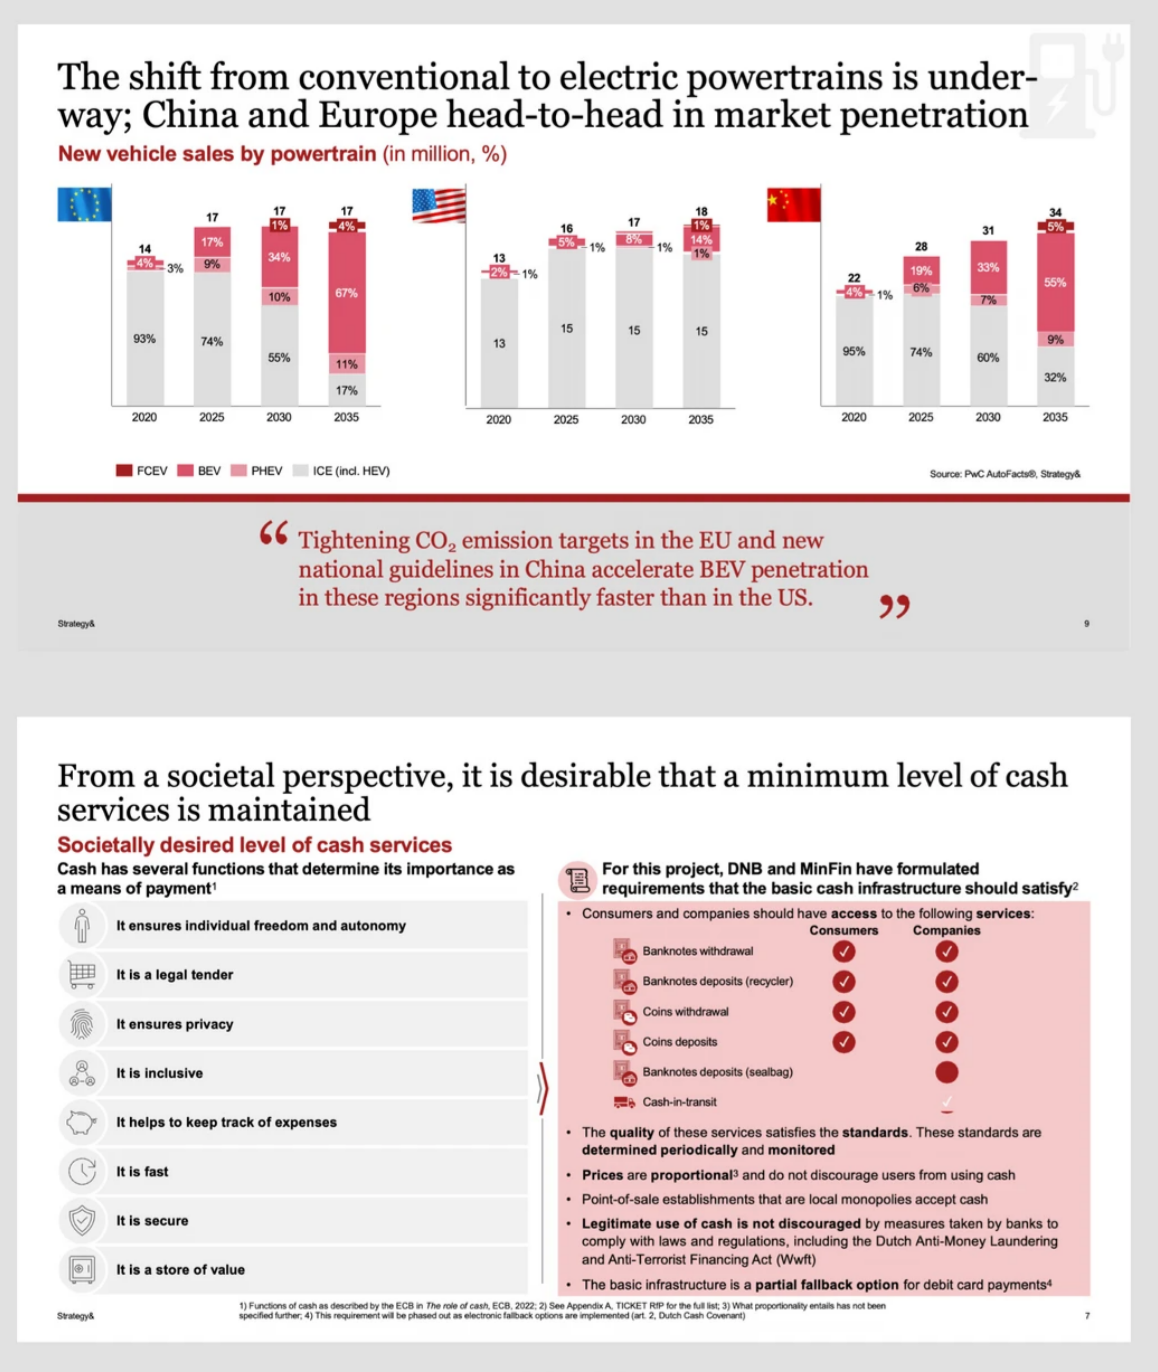
Design lesson: pair the quantitative change with its societal or regulatory driver on the same page.
4. ECIRM: Use a China-Specific Enterprise Diagnostic Carefully
ECIRM stands for Entrepreneur, Capital, Industry, Resource, and Management. Hejun Consulting developed it from observations of companies operating in the Chinese business environment, and its practical value is that it refuses to treat strategy as a purely market-side question — the founder, the financing structure, and the management system are first-class variables.
The original formulation carries more structure than the acronym suggests. It sorts companies into four archetypes by which element drives them — industry-driven, capital-driven, resource-driven, and management-driven — and describes development paths that move between those positions in either direction, with the diagonal moves flagged as the risky ones. A company trying to jump from resource-driven to management-driven without building the intermediate capability is the classic failure case.
Use this framework when: assessing a founder-led company, examining a Chinese growth business, or testing whether the stated strategy is aligned with financing capacity, industry position, resource access, and management capability.
Slide structure that holds up
Build a five-column scorecard — one column per element — with three rows beneath each: the evidence, the strategic gap, and the next intervention. Use a qualitative maturity scale only when the criteria are defined on the page and the evidence supporting each score is visible. An unlabeled five-point rating is the fastest way to lose a technical audience.
State the limitation on the slide
ECIRM is a useful diagnostic checklist, but it is a practitioner framework rather than a globally standardized or peer-reviewed academic model. When presenting it to an international audience, say so in a footnote. Naming the provenance of a framework costs one line and buys considerable credibility — and it is exactly the kind of judgment call that separates a reviewed deck from a generated one. The same principle applies to the frameworks we cover in the McKinsey-style 3C strategy deck guide.
5. PARTS: Redesign the Business Game, Not Just the Competitive Position
PARTS comes from the co-opetition approach developed by Adam Brandenburger and Barry Nalebuff in Co-opetition (1996). Its foundation is the value net: customers and suppliers on the vertical axis, competitors and complementors on the horizontal one. The complementor — a player whose presence makes your product more valuable to customers — is the position most competitive frameworks leave out entirely.
- Players: Which participants influence value creation and value capture?
- Added value: What becomes possible because each player participates? Formally, the value of the game with that player minus the value of the game without them.
- Rules: Which contracts, standards, incentives, or policies shape behavior?
- Tactics: How do information and perception influence decisions?
- Scope: Which markets or linked games change the outcome?
Use this framework when: evaluating ecosystems, platform strategy, channel conflict, partnerships, procurement leverage, standards bodies, or market entry.
Slide structure that holds up
Combine a value-net map with an action table showing which PARTS lever should change, why it matters, and what must be tested. The added-value calculation deserves its own row, because it is the one number that distinguishes a partner you need from a partner who needs you — and it is what determines who captures the margin when the deal is renegotiated.
The failure mode to avoid
Avoid the decorative stakeholder wheel. A ring of logos around a central brand looks structured but cannot distinguish value creation from bargaining power, which is the entire point of the framework. If the diagram cannot show that a supplier has high added value and low bargaining power, redraw it.
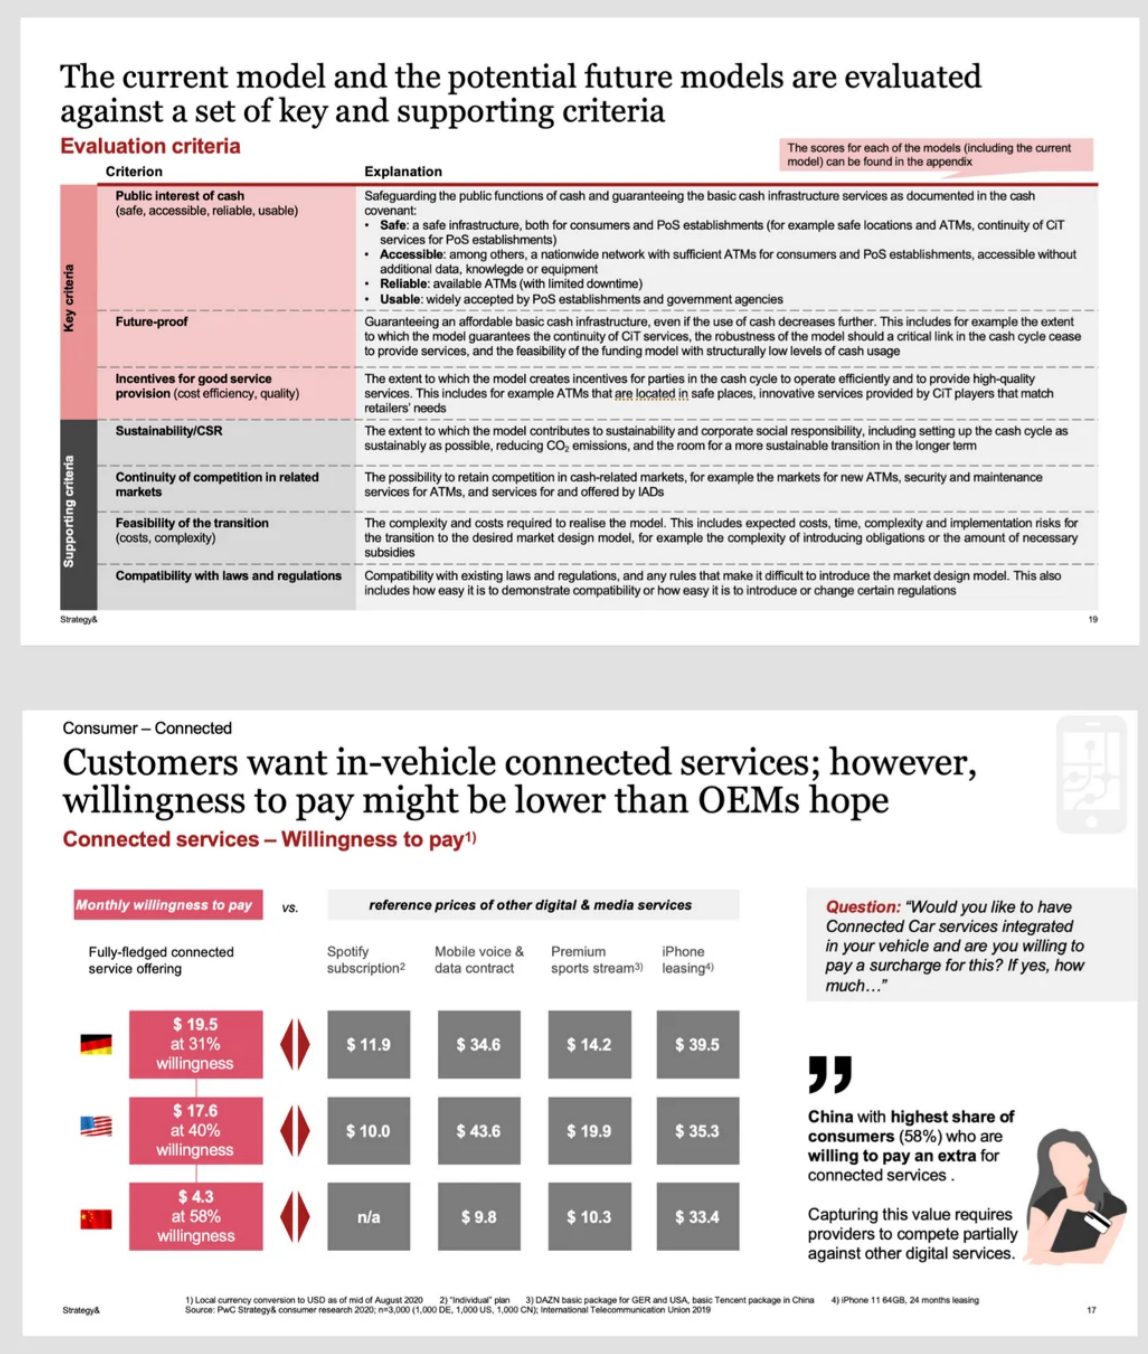
Design lesson: define the criteria first, then connect customer value to commercial impact so the scoring is auditable.
How to Choose the Right Framework
| Business question | Best starting framework | Recommended slide form | Evidence you must have |
|---|---|---|---|
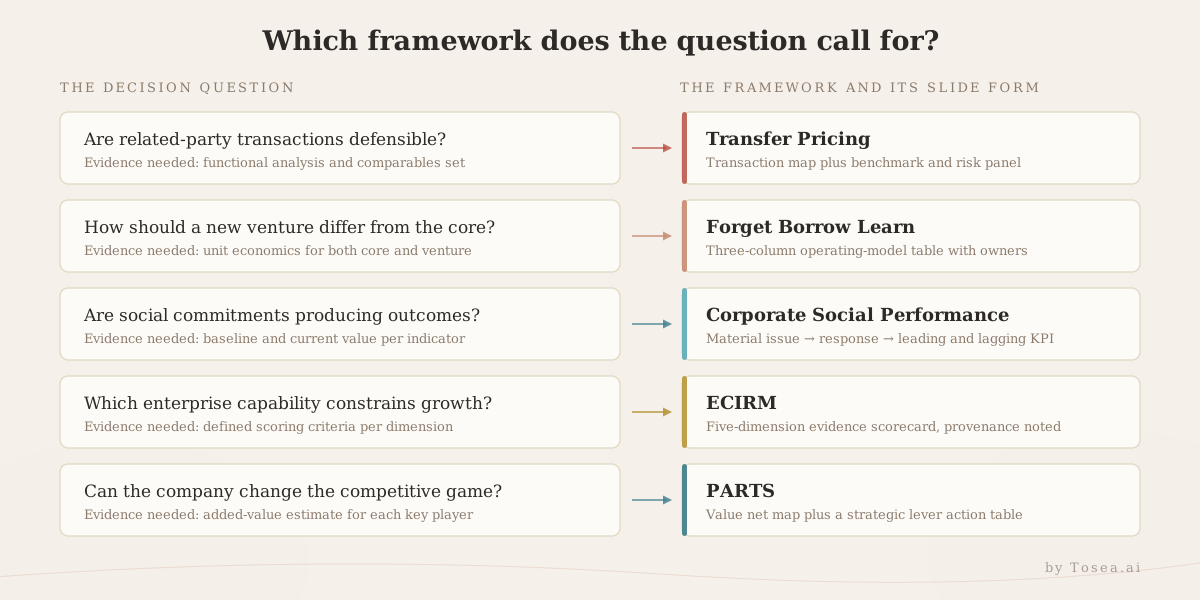
| Are related-party transactions defensible? | Transfer pricing | Transaction map plus benchmark and risk panel | Functional analysis and comparables set |
| How should a new venture differ from the core? | Forget Borrow Learn | Three-column operating-model table | Unit economics for both the core and the venture |
| Are social commitments producing outcomes? | CSP | Material issue to process to KPI chain | Baseline and current values for each indicator |
| Which enterprise capability is constraining growth? | ECIRM | Five-dimension evidence scorecard | Defined scoring criteria and supporting evidence |
| Can the company change the competitive game? | PARTS | Value net plus strategic lever table | Added-value estimate for each key player |
Choose the framework from the decision, not from visual novelty. If a deck combines models, state how they relate on the page where the second one appears. ECIRM may diagnose an internal constraint while PARTS explains how external relationships change the opportunity — that is a coherent pairing, and saying so out loud prevents the audience from reading the second framework as a restatement of the first.
One practical constraint: a single deck rarely carries more than two frameworks well. A third usually means the storyline has not been decided yet. Our guide to presenting research findings the McKinsey way works through the same discipline from the narrative side.
Reusable AI Prompt for a PwC-Style Strategy Presentation
Create a professional consulting presentation from the attached source material.

Audience: senior executives and functional leaders
Purpose: support a decision, not provide a general summary
Style: restrained PwC-inspired consulting aesthetic without copying proprietary templates, logos, or brand assets
Format: 16:9 editable PowerPoint

First identify the central decision, the supporting evidence, the material risks, and the recommended action. Build an outline before rendering slides.

Use conclusion-led slide titles. Keep a white background, charcoal text, one restrained red accent, and light gray support areas. Use tables, matrices, timelines, process diagrams, and evidence panels only when they clarify a relationship.

Select the most appropriate framework from transfer pricing, Forget Borrow Learn, Corporate Social Performance, ECIRM, and PARTS. Explain why the framework fits the business question, and note the framework's provenance and limitations where relevant. Preserve source figures, units, labels, assumptions, and citations. Do not invent facts or numerical values.

For every slide, provide the title, key message, body content, recommended layout or diagram, source note, and speaker note. End with actions, owners, timing, risks, and open decisions.
The instruction that does the most work here is "build an outline before rendering slides." Frameworks fail on the page when the model picks a layout before it has decided what the argument is, and a rendered slide is far more expensive to restructure than an outline row.
Where Tosea AI Fits
Tosea AI is a source-grounded AI presentation tool that turns PDFs, research reports, financial documents, and market studies into editable PowerPoint decks. It is built for consultants, analysts, researchers, and business teams who need to review the argument and its source context before presenting the result — the same reason our guide to turning complex files into executive-grade presentations starts with the source, not the template.
Choose layouts and diagrams at the outline stage
Review the outline before spending credits on rendering. Rewrite action titles, remove unsupported claims, reorder the storyline, and choose a layout or diagram for each slide. For a framework-heavy deck this is where most of the value is created: a transfer pricing page and a CSP page need genuinely different structures, and picking those structures at the outline stage costs nothing.
Change layouts and diagrams after rendering
After rendering, layouts and diagrams remain adjustable. A dense page can become a matrix, a sequence can become a timeline, and a recommendation can become a roadmap. Export the final deck as an editable PPTX and finish it in PowerPoint if the last mile needs manual control. If you are weighing tools for this kind of work, our comparison of AI presentation tools for consulting and strategy decks covers the trade-offs.
Final Quality-Control Checklist
- Does every slide title state a conclusion or a decision implication?
- Can every number be traced to a source, a calculation, or a documented assumption?
- Are the criteria defined before options are scored?
- Is the provenance of each framework stated where the audience may not share your context?
- Are regulated claims — tax, legal, financial, environmental — reviewed by qualified specialists?
- Does each framework match both the decision and the geographic context?
- Are risks linked to a consequence, a mitigation, and an owner?
- Do charts retain units, legends, scales, dates, and source notes?
- Has the exported PPTX been tested in the delivery environment, with the presenting machine's fonts?
Frequently Asked Questions
Which of these five frameworks should a first-time consulting deck use?
None of them, usually. The five here answer specialized questions. If the deck is a general commercial review, start with the seven frameworks in part one — pricing, portfolio, and market selection carry most business questions. Reach for these when the question is genuinely a tax structure, a corporate venture, a sustainability commitment, a founder-led diagnostic, or an ecosystem.
Can I combine two frameworks in the same deck?
Yes, and it is often the right call — but state the relationship explicitly on the slide where the second framework appears. A pairing works when one framework diagnoses and the other prescribes. It fails when both answer the same question from different angles, which reads as indecision.
Is ECIRM credible for an international audience?
It is credible as a structured diagnostic, provided you attribute it and note that it is a practitioner framework from the Chinese consulting market rather than a peer-reviewed academic model. Presenting it without that footnote invites a challenge you can defuse in one line.
How do I show a benchmark range without over-claiming?
Plot the interquartile range and the tested result together, label the comparables set and its date, and state the method. A single point estimate with no range is the claim most likely to be challenged, and the one hardest to defend once it is.
Can Tosea AI redesign my existing PowerPoint without changing the content?
Yes. Export the PowerPoint as a PDF, upload it, and request a redesign that preserves the wording. Use Layout Only to refresh the structure, then confirm that labels, footnotes, and citations survived the pass.
Can I upload my own PowerPoint template to Tosea AI?
Tosea AI supports custom templates on eligible paid plans. Confirm the required layouts, fonts, colors, logo placement, and master-slide rules before generation rather than after.
Does Tosea AI preserve PowerPoint formatting after export?
The editable PPTX export is designed to stay close to the preview. Results can vary with fonts, complex graphics, and the version of PowerPoint used, so test the deck in the final delivery environment before the meeting.
Final Takeaway
A PwC-style PowerPoint built with AI works when four things line up: a real decision question, a framework that fits it, traceable evidence, and disciplined design. These five models answer genuinely different management questions and should not become interchangeable decoration — the transfer pricing page and the PARTS page look different because the arguments are different.
Use Tosea AI when the source material is complex, the outline needs human review before rendering, layouts and diagrams must stay adjustable, and the deliverable has to be an editable PowerPoint. To continue the series, read the first PwC-style PowerPoint guide, the McKinsey-style 3C strategy deck guide, and the eight rules for consulting-grade AI slides.
Sources
- OECD Transfer Pricing Guidelines for Multinational Enterprises and Tax Administrations 2022 — OECD, January 2022
- A Three-Dimensional Conceptual Model of Corporate Performance — Archie B. Carroll, Academy of Management Review, October 1979
- The Three-Dimensional Corporate Social Performance Model Revisited and Refreshed — Archie B. Carroll, Journal of Sustainable Business, 2025
- Building Breakthrough Businesses Within Established Organizations — Vijay Govindarajan and Chris Trimble, Harvard Business Review, May 2005
- Co-opetition — Adam M. Brandenburger and Barry J. Nalebuff, Currency/Doubleday, 1996
- ECIRM Model: How to Think About the Strategic Problems of Chinese Enterprises — Hejun Consulting
Slide images in this article are screenshots of publicly published Strategy& and PwC report pages, used as design reference. Tosea AI does not reproduce third-party templates, logos, or brand assets.