How to Build a Bain-Style SPACE Matrix PowerPoint with AI: Complete Guide
Calculate a SPACE Matrix that reconciles, read the vector, and build four Bain-style strategy slides with AI: aggressive, conservative, competitive, and defensive postures.
A Bain-style SPACE Matrix PowerPoint should turn four score sets into a management decision, not stop at a polished diagram. This guide shows analysts how to calculate the Strategic Position and Action Evaluation Matrix so the numbers reconcile, how to read the vector, and how to build four practical slide types with Tosea AI. It includes a worked example, reusable prompts, a quality checklist, editable data, and PPTX export.
The slide examples below are original editorial references built for fictional companies. They are not Bain & Company templates, and Tosea AI is not affiliated with or endorsed by Bain & Company.
Quick answer: Score financial strength, competitive advantage, environmental stability, and industry strength on one documented scale. Calculate X as CA plus IS and Y as FS plus ES. Plot the vector, explain which variables drove it, test the result against a one-point change in the least certain inputs, and convert the quadrant into a small set of actions with owners and gates.
Contents
- What the SPACE Matrix measures
- How to calculate it, step by step
- A worked example that reconciles to (2.4, 1.8)
- How SPACE compares with SWOT, BCG, GE-McKinsey, and Ansoff
- How to design the slide and the storyline around it
- Four SPACE Matrix PowerPoint scenarios with AI prompts
- Where the model breaks
- Building the deck in Tosea AI
- Quality checklist and frequently asked questions
What Is the SPACE Matrix?
The Strategic Position and Action Evaluation Matrix is a strategy formulation tool that combines two internal dimensions and two external dimensions:
| Dimension | What it tests | Typical inputs |
|---|---|---|
| Financial strength, FS (internal) | Capacity to fund and absorb strategic moves | Cash flow, liquidity, leverage, return on investment, working capital |
| Competitive advantage, CA (internal) | Relative position against competitors | Market share, customer loyalty, product quality, cost position, technical know-how |
| Environmental stability, ES (external) | Volatility and external pressure | Inflation, technology change, demand variability, price competition, regulation |
| Industry strength, IS (external) | Structural attractiveness of the industry | Growth potential, profit potential, entry barriers, capacity utilization |
The method classifies a business into one of four postures: aggressive, conservative, competitive, or defensive. The framework is usually credited to the strategic management work of Alan Rowe and colleagues in the early 1980s and is widely taught through Fred R. David's strategic management textbook. A peer-reviewed discussion by Laetitia Radder and Lynette Louw in Long Range Planning explains the framework and its relationship to SWOT and industry analysis: The SPACE Matrix: A Tool for Calibrating Competition.
The matrix is a synthesis tool, not proof by itself. Record the source, date, scoring rule, and owner for every input. Show material scoring disagreements rather than hiding them inside an average.
How to Calculate a SPACE Matrix Correctly
Use the same scoring convention throughout the analysis:
- Select four to six variables for each of FS, CA, ES, and IS.
- Score FS and IS from +1 for weak to +6 for strong.
- Score CA and ES from -1 for favorable to -6 for unfavorable.
- Average the variables within each dimension.
- Calculate X = average CA + average IS.
- Calculate Y = average FS + average ES.
- Draw a vector from the origin to the point (X, Y).
- Test whether the resulting posture still holds under reasonable changes to the inputs.
The sign convention is where most decks go wrong. On the horizontal axis, CA sits on the left and runs from -1 (strong advantage, close to the origin) to -6 (weak advantage, far left). On the vertical axis, ES sits below the origin and runs from -1 (stable) to -6 (volatile). A company with a strong advantage in an attractive industry therefore plots well to the right, because a small negative CA barely offsets a large positive IS.
Some textbook editions use a +1 to +7 scale and rename the dimensions financial position, stability position, industry position, and competitive position. Either version works. Mixing them in one deck, or comparing a 1-to-6 plot from last year with a 1-to-7 plot this year, does not.
Four scoring errors that change the answer
- Mixed signs. Scoring environmental stability positively and then adding it to FS pushes the point upward for the wrong reason.
- Unbalanced variable counts. Eight financial variables and two competitive ones create false precision on one axis and noise on the other.
- Double counting. Return on assets, return on equity, and return on investment in the same FS list measure one idea three times.
- Internal and external confusion. IS describes the industry, not the company's capabilities. A line such as "strong technology and scale" belongs in CA, not IS.
A Worked Example That Reconciles to (2.4, 1.8)
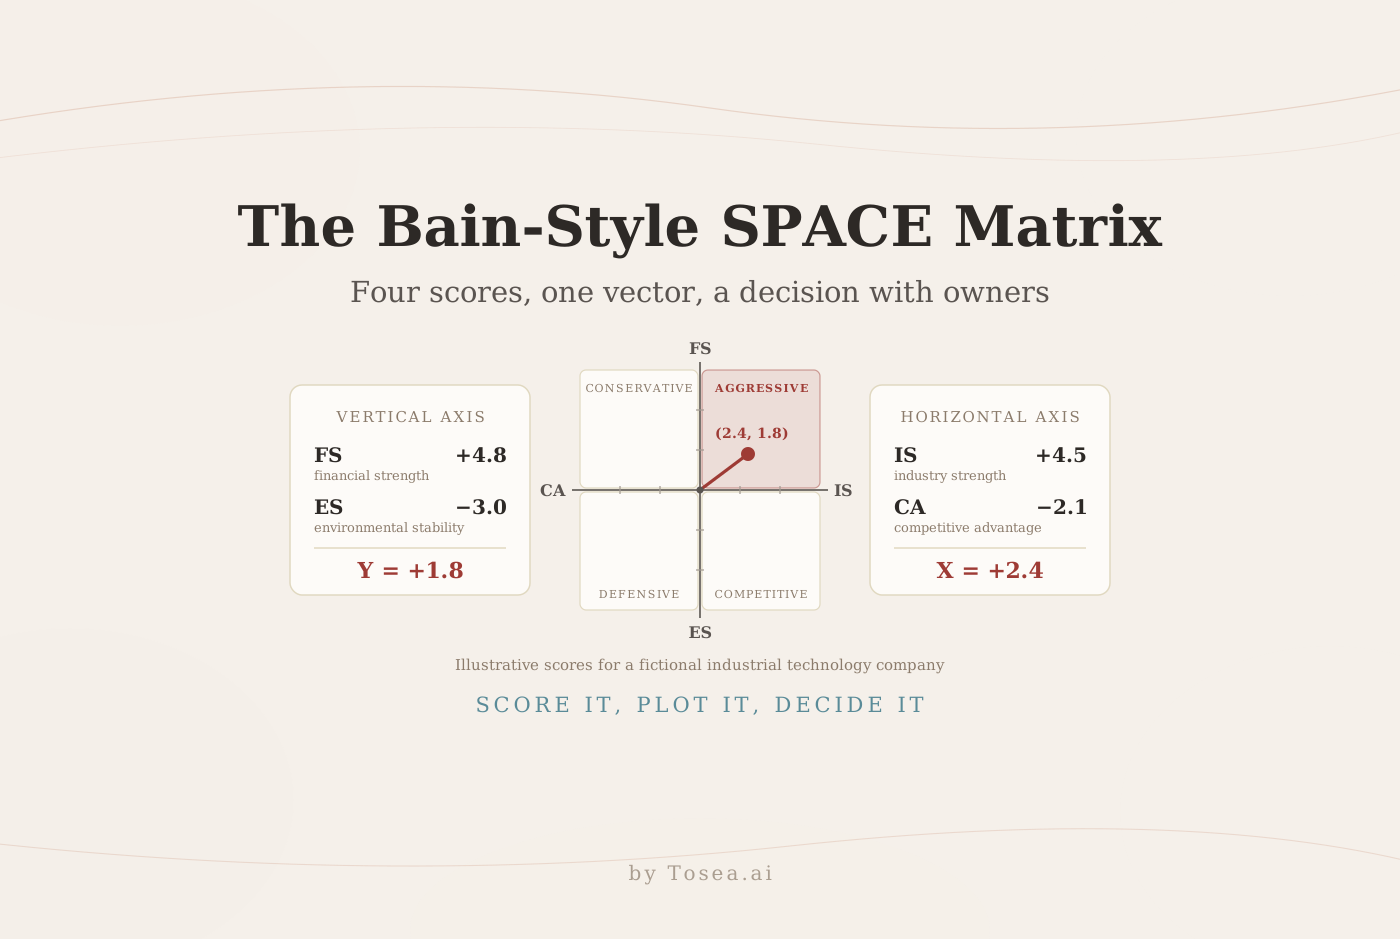
The aggressive-posture slide later in this guide plots a fictional industrial technology company at (2.4, 1.8). Here is the variable-level scorecard behind that point. All figures are illustrative.
| Dimension | Variable | Score |
|---|---|---|
| FS | Operating cash flow | +5 |
| FS | Liquidity, current ratio | +5 |
| FS | Net debt to EBITDA | +4 |
| FS | Return on invested capital | +5 |
| FS | Access to capital | +5 |
| FS average | +4.8 | |
| CA | Market share | -2 |
| CA | Product quality (reviewers split -1 and -2) | -1.5 |
| CA | Cost position | -3 |
| CA | Technological know-how | -2 |
| CA | Customer loyalty | -2 |
| CA average | -2.1 | |
| ES | Rate of technology change | -3 |
| ES | Input-cost inflation | -2 |
| ES | Demand variability | -4 |
| ES | Price competition | -3 |
| ES average | -3.0 | |
| IS | Growth potential | +5 |
| IS | Profit potential | +4 |
| IS | Barriers to entry | +5 |
| IS | Industry capacity utilization | +4 |
| IS average | +4.5 |
X = -2.1 + 4.5 = 2.4. Y = 4.8 + (-3.0) = 1.8. The point sits in the aggressive quadrant.
Three things are worth saying on the slide, and all three come from the table rather than the headline.
The vector is long and well inside the quadrant. It runs about 37 degrees above the horizontal with a length of 3.0. Neither coordinate is close to an axis, so the posture is not a borderline call.
Two variables deserve the discussion time. Cost position (-3) is the weakest competitive score, and demand variability (-4) is the most unfavorable environmental score. If management asks what could undermine an expansion plan, these are the two answers.
The split score is visible, not averaged away. Two reviewers disagreed on product quality. The midpoint went into the model, and the disagreement goes into the footnote.
Sensitivity: does the posture survive?
Move the two least certain variables one notch against the company. Demand variability goes from -4 to -5, which lowers the ES average to -3.25. Product quality goes from -1.5 to -2.5, which lowers the CA average to -2.3. The new point is (2.2, 1.55). The company is still aggressive.
A stronger test is to ask what it would take to cross a boundary. Y reaches zero only if the ES average falls to -4.8, meaning roughly every stability variable worsens by two notches, or if FS drops from 4.8 to 3.0. X reaches zero only if IS falls to 2.1 or CA to -4.5. That gives the executive committee a clear sentence for the page: the aggressive call holds unless the operating environment deteriorates sharply across the board.
As a working rule, when the point lands within about one unit of an axis, present both adjacent postures and state the evidence that would decide between them. A conditional recommendation is more useful than a confident one built on a coin toss.
How the SPACE Matrix Compares with Other Strategy Frameworks
Analysts are often asked why SPACE and not a more familiar model. A short comparison settles the question early.
| Framework | Question it answers | Unit of analysis | Output |
|---|---|---|---|
| SPACE Matrix | How aggressive should this business be? | One business unit | Posture and directional vector |
| SWOT and TOWS | Which strategies follow from internal and external factors? | Business or initiative | Paired strategy options |
| BCG Growth-Share Matrix | Where should capital go across a portfolio? | Portfolio of units | Four portfolio roles |
| GE-McKinsey nine-box | Which units to invest in, hold, or harvest? | Portfolio of units | Three-by-three priority grid |
| Ansoff Matrix | Which growth direction should we take? | One business | Four growth paths |
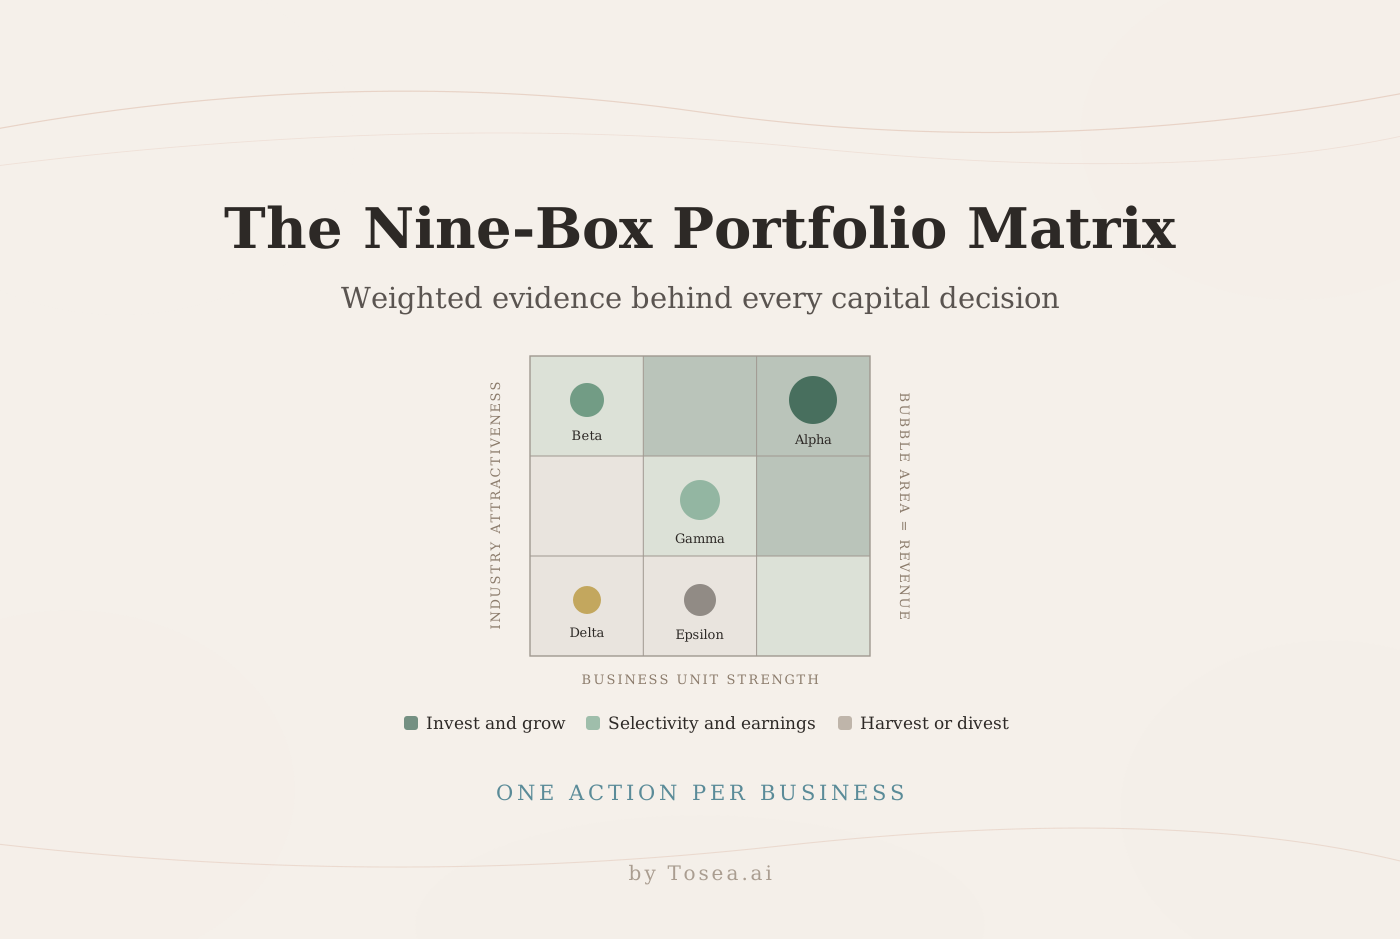
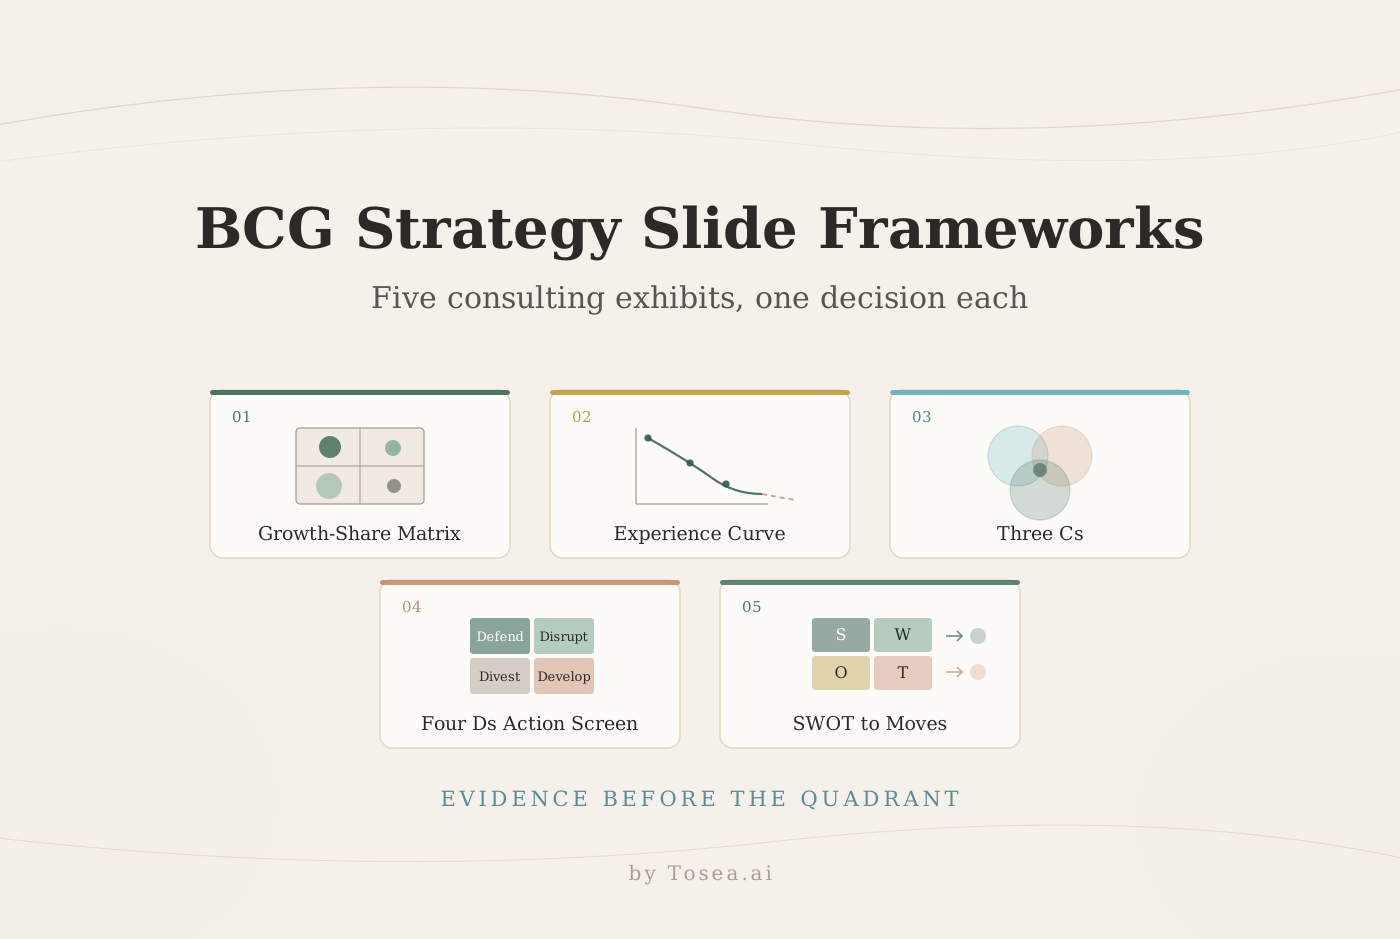
The frameworks work best in sequence. SWOT, formalized as the TOWS matrix by Heinz Weihrich, generates options. SPACE sets the posture for one unit. If the posture is aggressive or competitive, the Ansoff Matrix chooses the direction of growth. For multi-business portfolios, the BCG Growth-Share Matrix and the GE-McKinsey nine-box allocate capital across units. Our guides to BCG strategy consulting templates and the GE-McKinsey matrix PowerPoint cover those portfolio views in detail.
How to Design a Bain-Style SPACE Matrix PowerPoint
A strong consulting slide answers four questions on one page:
- What strategic posture does the evidence indicate?
- Which variables moved the result?
- What action follows from the posture?
- What would make management change course?
Give the matrix about half the page and use the rest for implications, actions, and decision gates. One deep red accent can carry the recommendation, while charcoal and pale gray handle supporting information. Microsoft advises designers to reduce decoration and avoid using color as the only carrier of meaning in its data visualization guidelines. Label the quadrants in text as well as color so the slide still reads in grayscale print.
Place the matrix inside a storyline
A single matrix slide rarely survives a steering committee alone. A SPACE section usually needs six pages:
- Answer page. Posture, recommendation, and the one sentence that explains why.
- Method page. Scale, variables per dimension, raters, and data dates.
- Scorecard page. The variable-level table, often moved to the appendix.
- Drivers page. The two or three variables that moved the result.
- Sensitivity page. Base and stress points on the same axes.
- Action page. Moves, owners, funding limits, and review gates.
The answer goes first because the audience needs a reason to care about the method. For more of chapter structure, see our guide to building a BCG-style storyline.
Four SPACE Matrix PowerPoint Scenarios
1. Aggressive posture: expansion with a sequence
An aggressive result appears in the upper-right quadrant. The company has enough financial strength to act, the industry is attractive, and the combined position supports expansion. Textbook moves include market penetration, market development, product development, integration, and selected diversification.
The slide should identify the advantage that makes expansion credible and sequence the moves. An attractive industry is not a right to win.
The evidence this page must carry: the four averages, the coordinate, and the advantage that justifies the first move. The failure mode: listing every strategy the quadrant permits instead of choosing two or three.
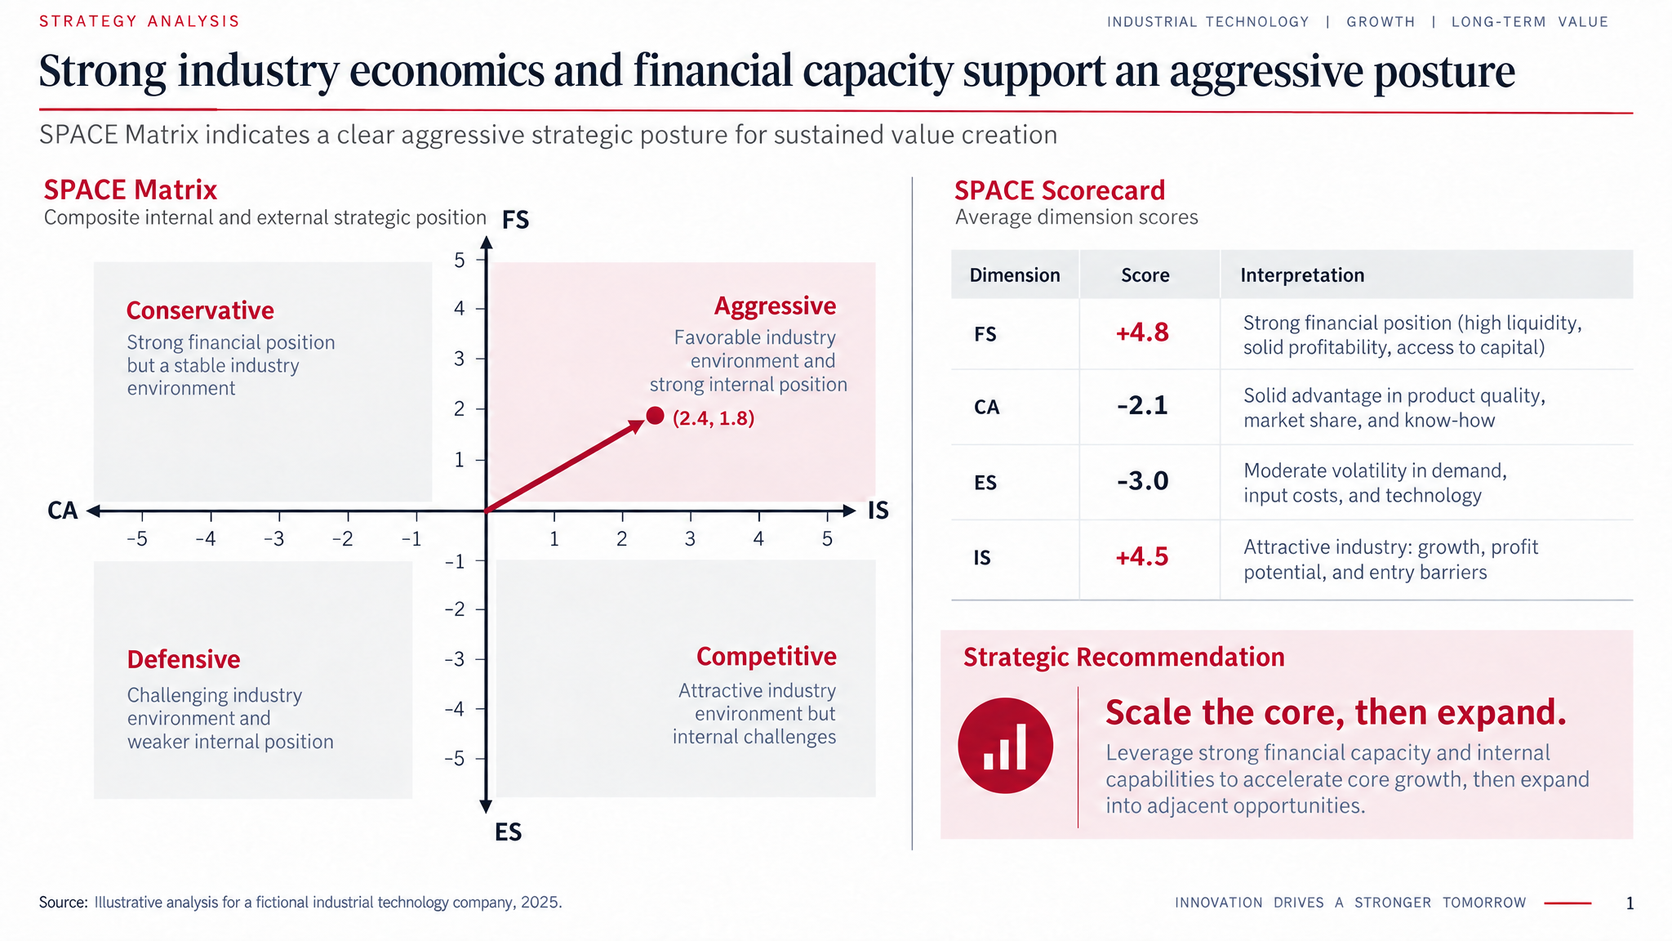
Illustrative slide: a fictional industrial technology company plots in the aggressive quadrant. Values are examples, not benchmarks.
Create one 16:9 executive strategy slide using a SPACE Matrix. Audience: executive committee. Company: [company]. Decision: [decision]. Use only the verified data below: [FS, CA, ES, IS variables, scores, dates, and sources]. Calculate the four dimension averages, X coordinate, and Y coordinate. Plot a vector from the origin. Place the matrix on the left and a scorecard plus recommendation on the right. Write a conclusion-led title. Recommend no more than three sequenced growth moves. Add assumptions, decision gates, and source notes. Use a restrained red, charcoal, gray, and white consulting layout. Do not invent data.
2. Conservative posture: protect the core, grow selectively
A conservative result sits in the upper-left quadrant. Financial strength is relatively sound, but competitive advantage or industry conditions limit the case for broad expansion. The practical response is often to protect the core, improve productivity, and invest only in close adjacencies.
Show what remains defensible. Separate margin protection from experiments, and put a funding ceiling and proof point beside each test.
The evidence this page must carry: which variable holds the business back from the aggressive quadrant. The failure mode: presenting "conservative" as "do nothing," when the quadrant still supports disciplined growth.
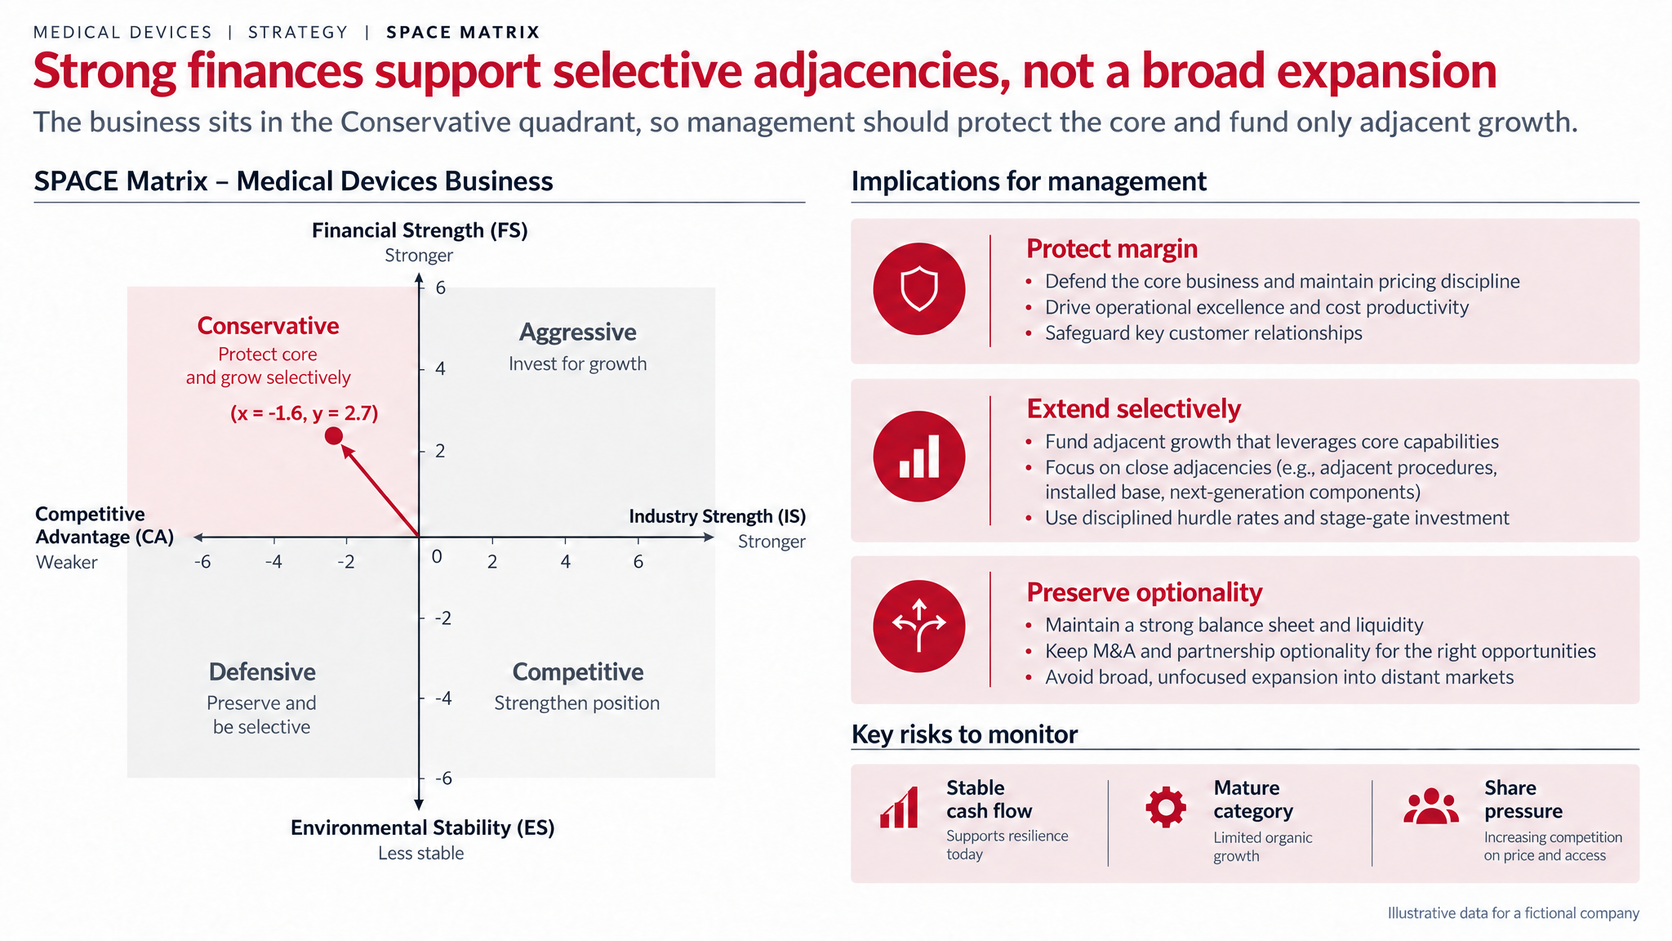
Illustrative slide: a fictional medical devices business protects the core while testing adjacent growth.
Build one 16:9 SPACE Matrix slide for a conservative strategic posture. Use these verified inputs: [paste data and sources]. Show the vector and explain the two variables that most influenced the result. Divide the right side into Protect margin, Extend selectively, and Preserve optionality. For each action, state the owner, investment limit, evidence gate, and review date. Use a conclusion-led title and restrained consulting typography. Label all forecast values and assumptions. Do not fabricate evidence.
3. Competitive posture: a focused build
A competitive posture sits in the lower-right quadrant. Industry conditions are attractive, yet the environment is volatile and financial strength is not enough for a broad offensive. The deck should define a narrow battlefield where the company can improve its position without overextending.
Choose a segment, capability, or channel where evidence supports a realistic advantage. Link investment to measurable gates so management scales after proof rather than before it.
The evidence this page must carry: the funding constraint and the gate that releases the next tranche. The failure mode: a land-grab plan that ignores the financial weakness the matrix just identified.
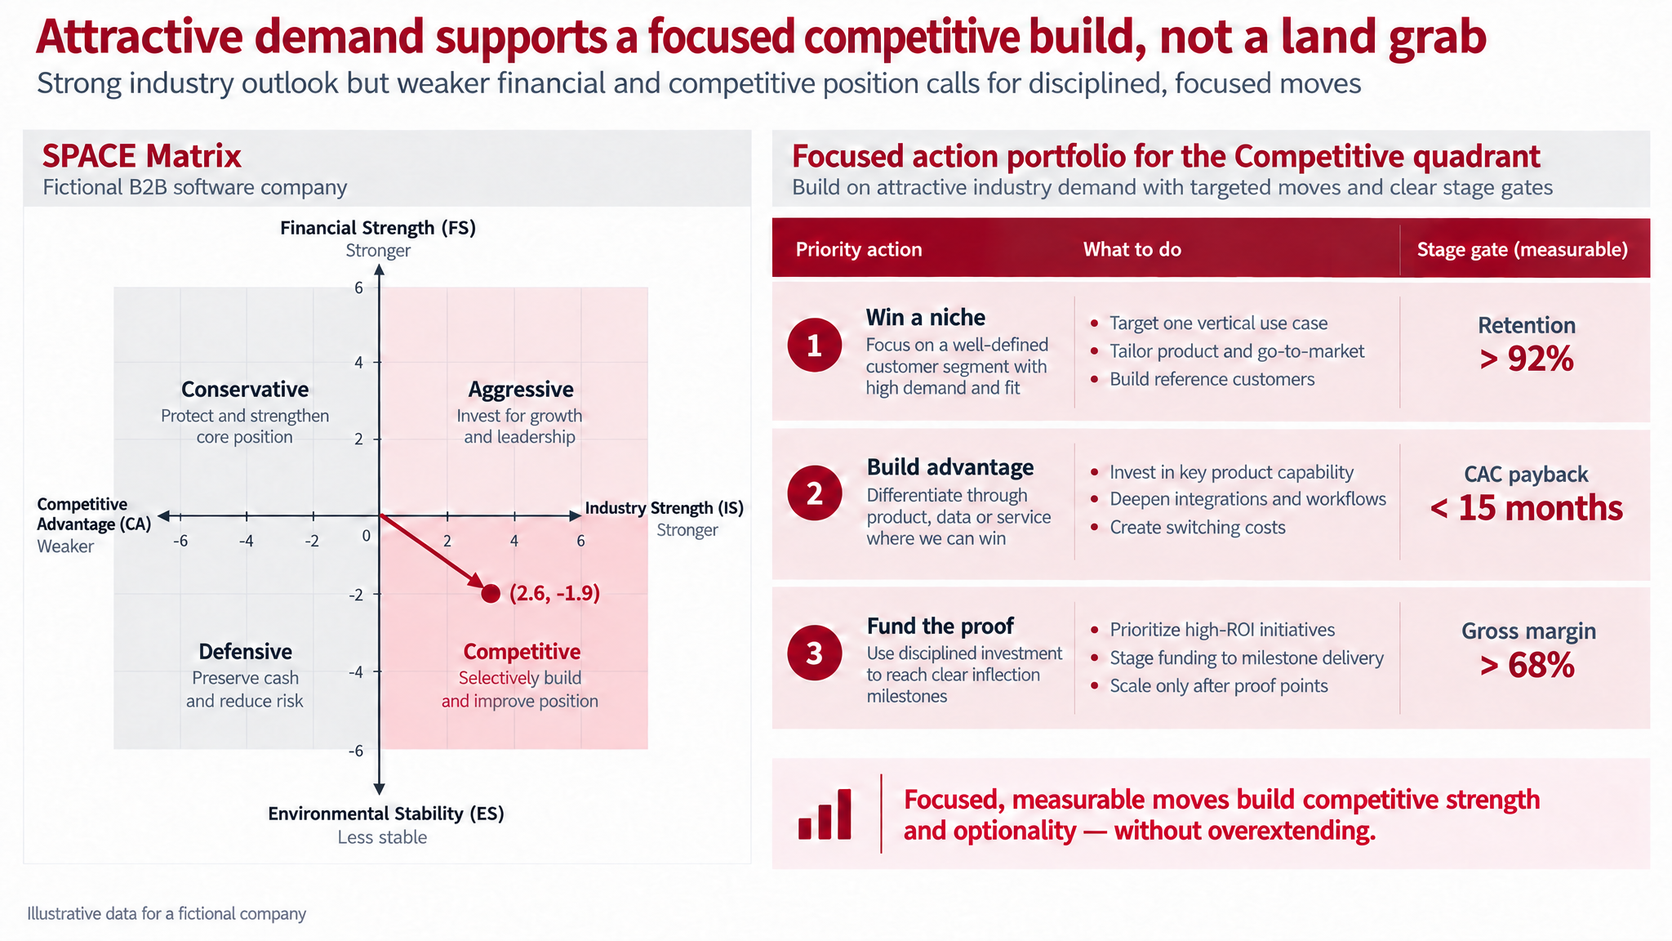
Illustrative slide: a fictional B2B software company links focused investments to measurable stage gates.
Create one 16:9 competitive-posture SPACE Matrix slide for [company]. Verified inputs: [data and sources]. Plot the calculated vector. Identify one customer segment or use case where the company can build advantage. Add three priority actions with quantified stage gates. Include a stop condition for each action. Write a title that states why focused investment is preferable to broad expansion. Use red only for the chosen path and key numbers. Keep the source note visible. Do not invent metrics.
4. Defensive posture: protect cash first
A defensive result appears in the lower-left quadrant. The company faces internal weakness and an unfavorable external environment. Typical responses include retrenchment, cost reduction, selective divestment, portfolio simplification, or exit.
Show liquidity, cash runway, commitments, and stop conditions. A defensive strategy needs a 30, 60, or 90-day plan that protects cash while management decides what to retain, repair, sell, or close.
The evidence this page must carry: a cash bridge that separates actuals from forecasts. The failure mode: softening the downside so the page reads as a growth plan in disguise.
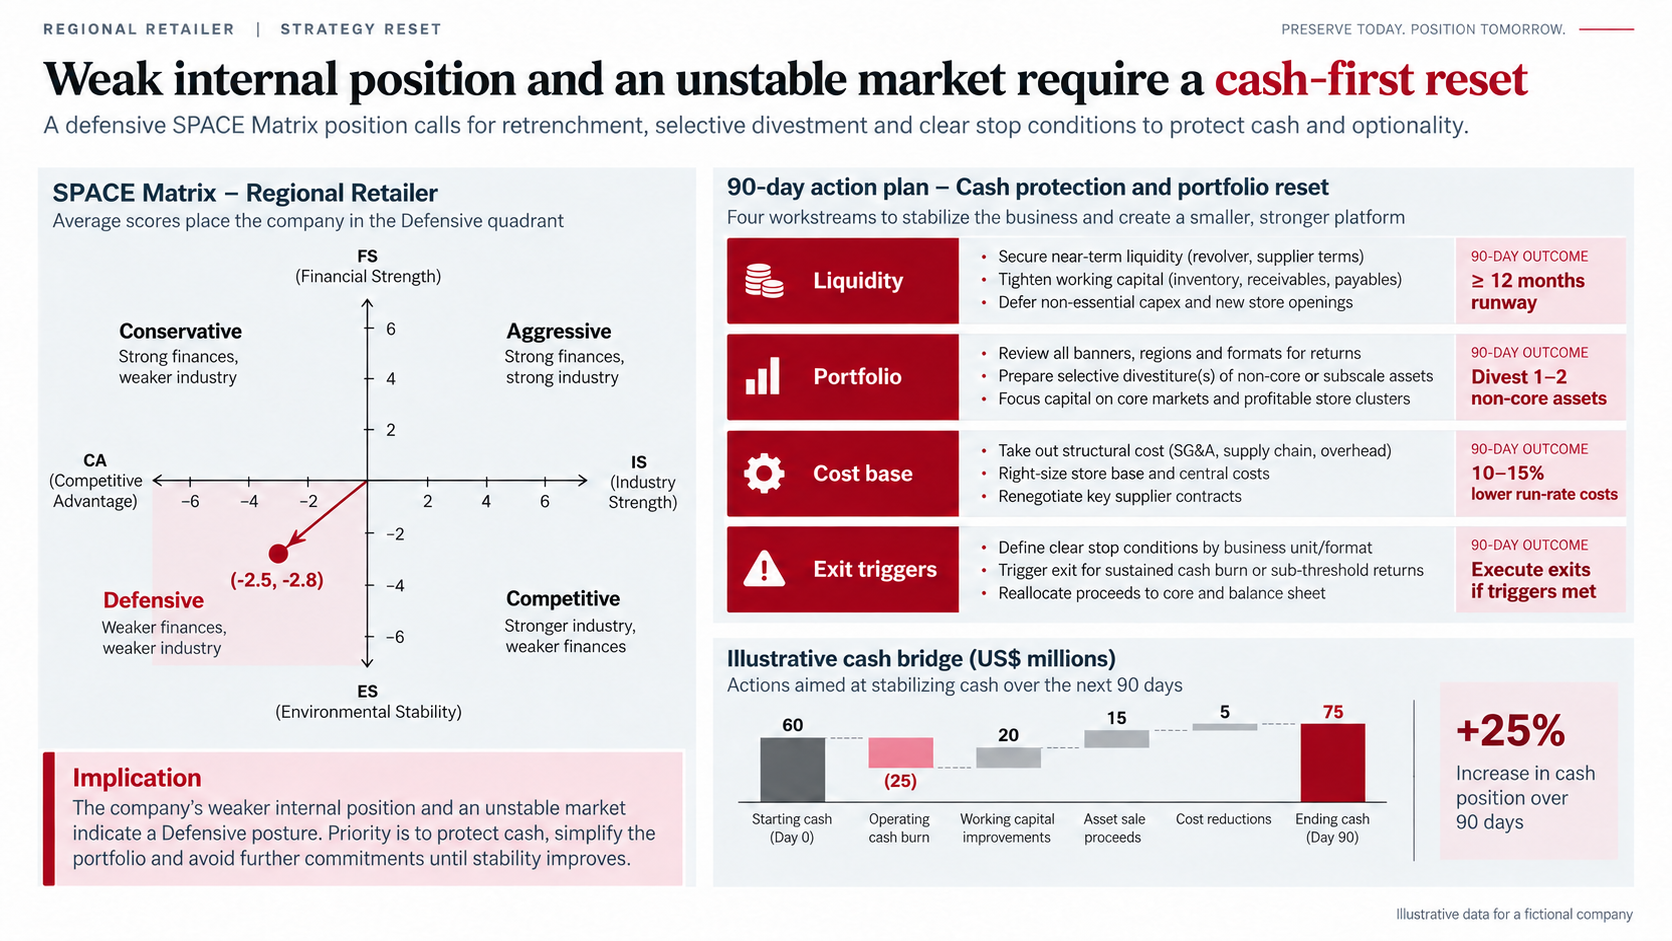
Illustrative slide: a fictional regional retailer connects the defensive quadrant to liquidity and portfolio actions.
Create one 16:9 defensive SPACE Matrix slide. Company: [company]. Use only these verified inputs: [scores, cash, debt, working capital, portfolio performance, market evidence, sources]. Plot the vector and state why the business falls in the defensive quadrant. Build a 90-day plan covering liquidity, portfolio, cost base, and exit triggers. Add a cash bridge and identify which figures are actuals, forecasts, or assumptions. Use a restrained executive layout. Do not invent values or soften downside risks.
Turn every action into an owned decision
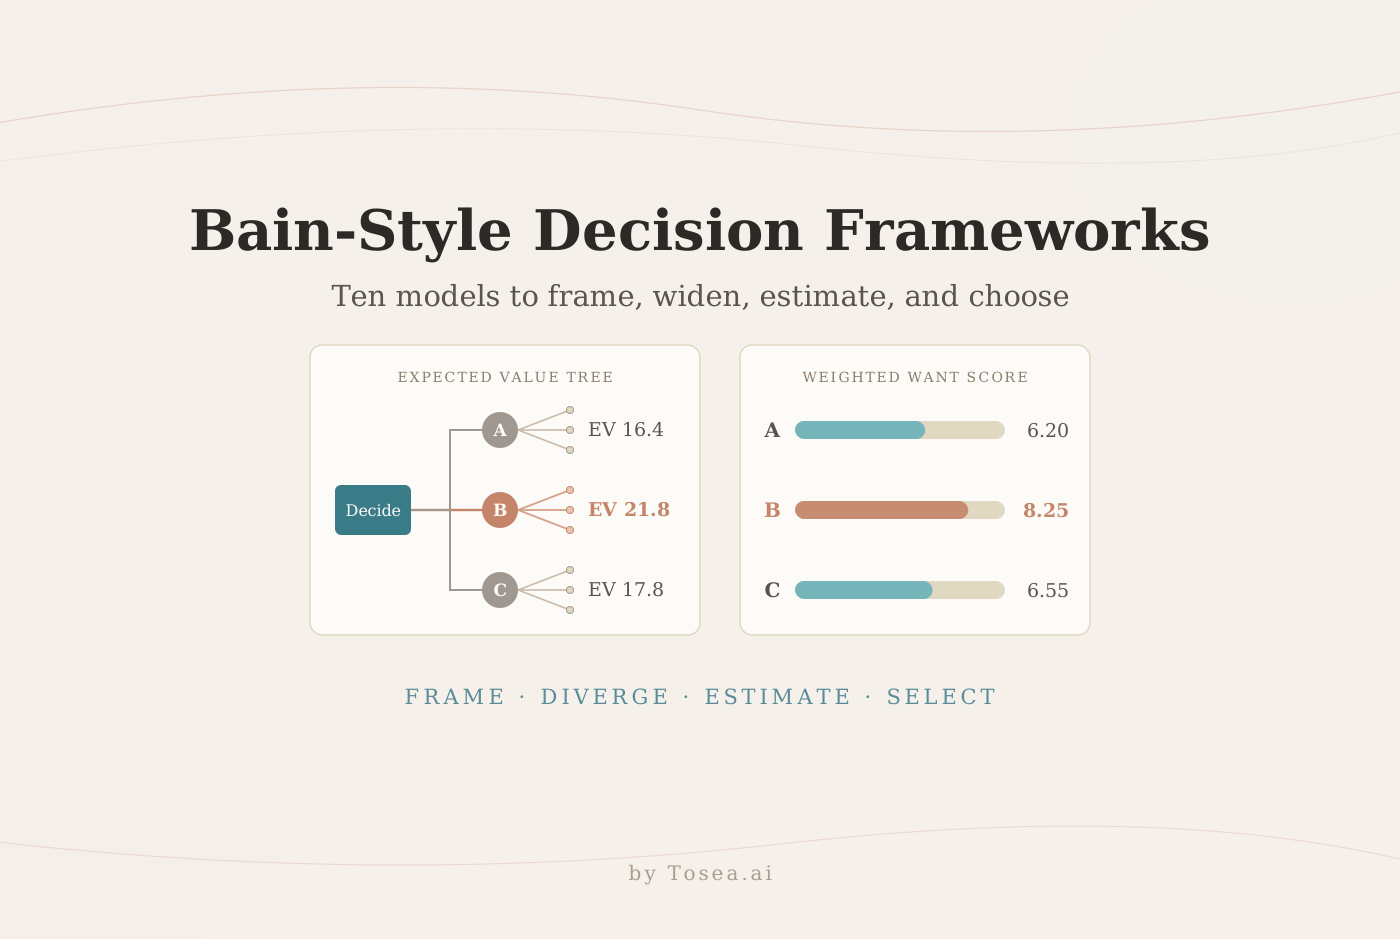
Whatever the quadrant, the action column should name who recommends, who decides, and who executes. Bain's RAPID framework separates those roles, and it fits naturally on the action page. For more decision models that pair with a SPACE result, including Kepner-Tregoe and decision trees, see our guide to Bain-style decision-making frameworks.
Where the SPACE Matrix Breaks
Five conditions turn a SPACE plot from a useful synthesis into a misleading one. Agree on how to handle each before scoring begins.
Multi-business companies. Averaging several units produces a point that describes none of them. Plot each business unit separately and use a portfolio framework to allocate capital across them.
Pre-revenue or recently funded businesses. FS then reflects the timing of the last funding round. Score it on runway and burn, and say so.
One-off external shocks. A tariff change or a supply disruption can swing ES by several points in a quarter. Plot the base case and the shock case on the same axes instead of replacing one with the other.
Single-rater scoring. One analyst scoring all twenty variables tends to anchor on a preferred answer. Two independent raters, with disagreements shown, reduce that risk at little cost.
Generic quadrant strategies. The quadrant narrows the choice; it does not make it. "Aggressive" permits integration, diversification, and market development, but the evidence usually supports only one or two of them.
How to Build the SPACE Matrix Deck in Tosea AI
Use Data Studio for the scorecard
SPACE analysis usually starts in a spreadsheet. Tosea AI Data Studio can import Excel or CSV data, or recognize chart and table values from uploaded source material, then turn the values into editable tables and charts. That matters because the matrix, scorecard, and sensitivity analysis should remain revisable when assumptions change. Our AI think-cell alternative guide walks through the chart editor in more detail.
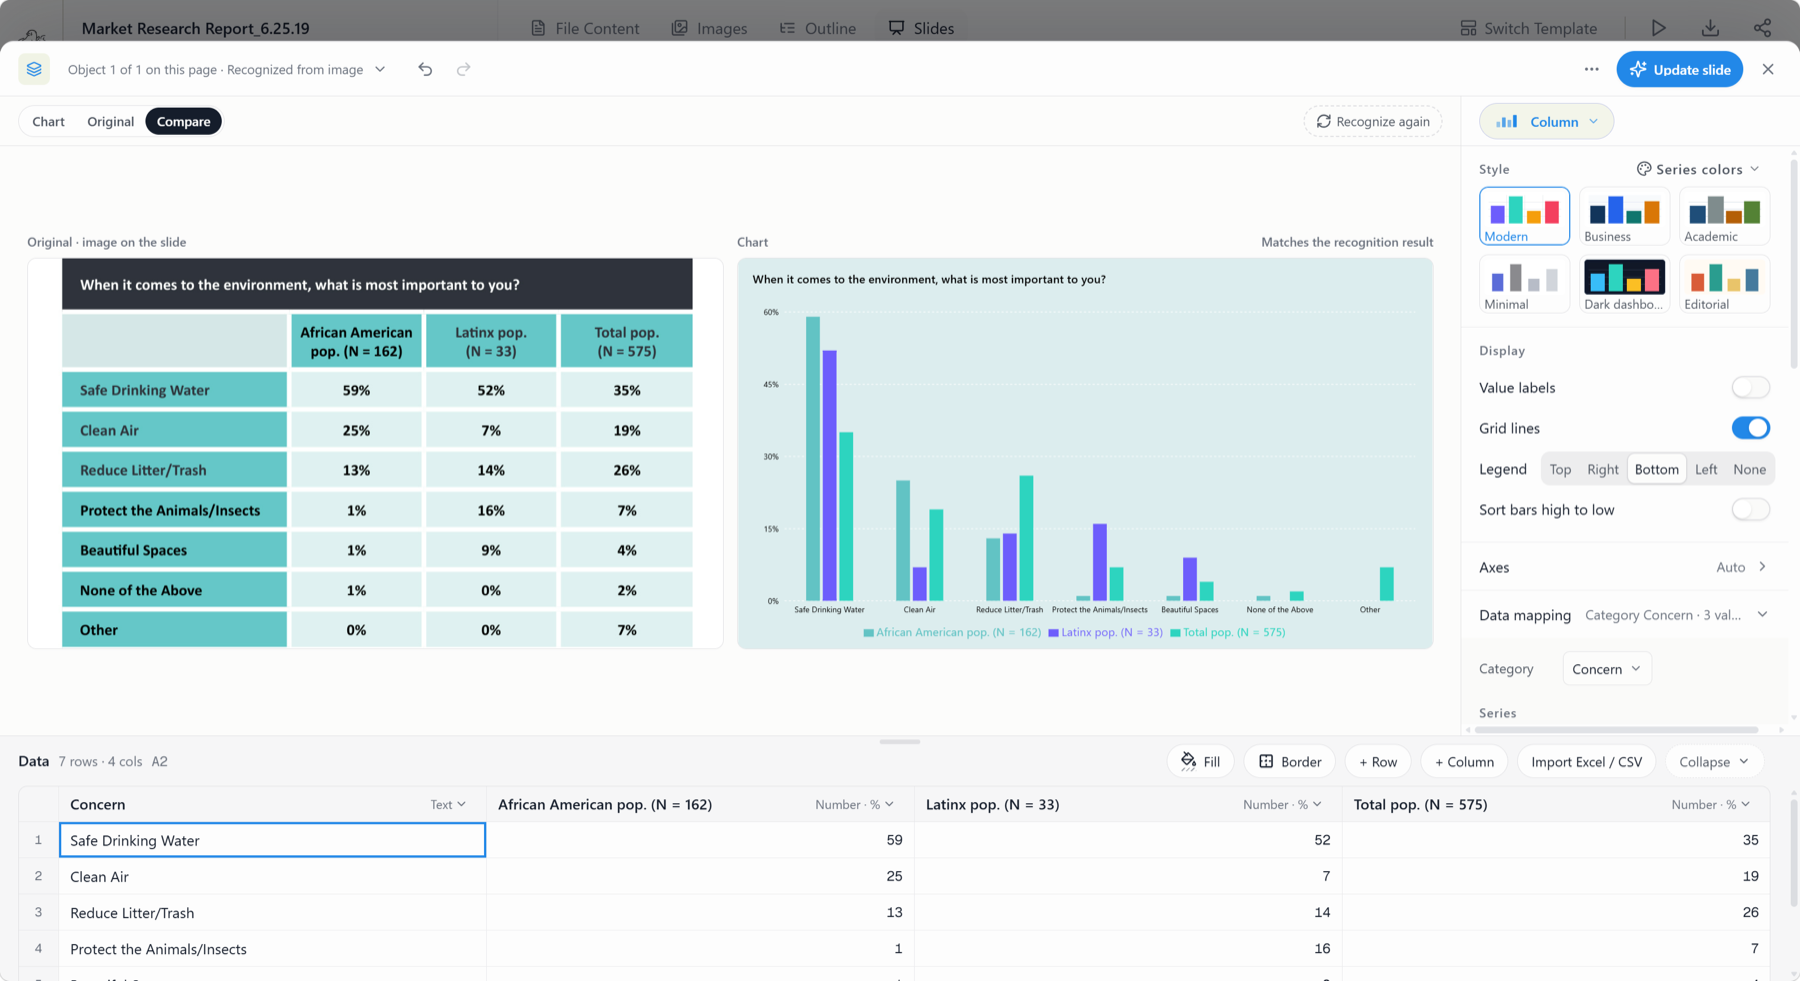
A practical scorecard table includes the dimension, variable, raw value, rationale, score, source, date, and owner. Review recognized values before charting. The analyst remains responsible for calculation integrity, as with any composite score such as the Wall method.
Choose layouts and diagrams before or after rendering
At the outline stage, Tosea AI lets you assign a matrix, scorecard, waterfall, action plan, or table to each message. After rendering, you can still change the layout or diagram. If the wording has already been approved, use Layout Only to revise the visual structure without intentionally rewriting the content, which helps when the matrix is too small, the implication is buried, or a list would work better as a roadmap.
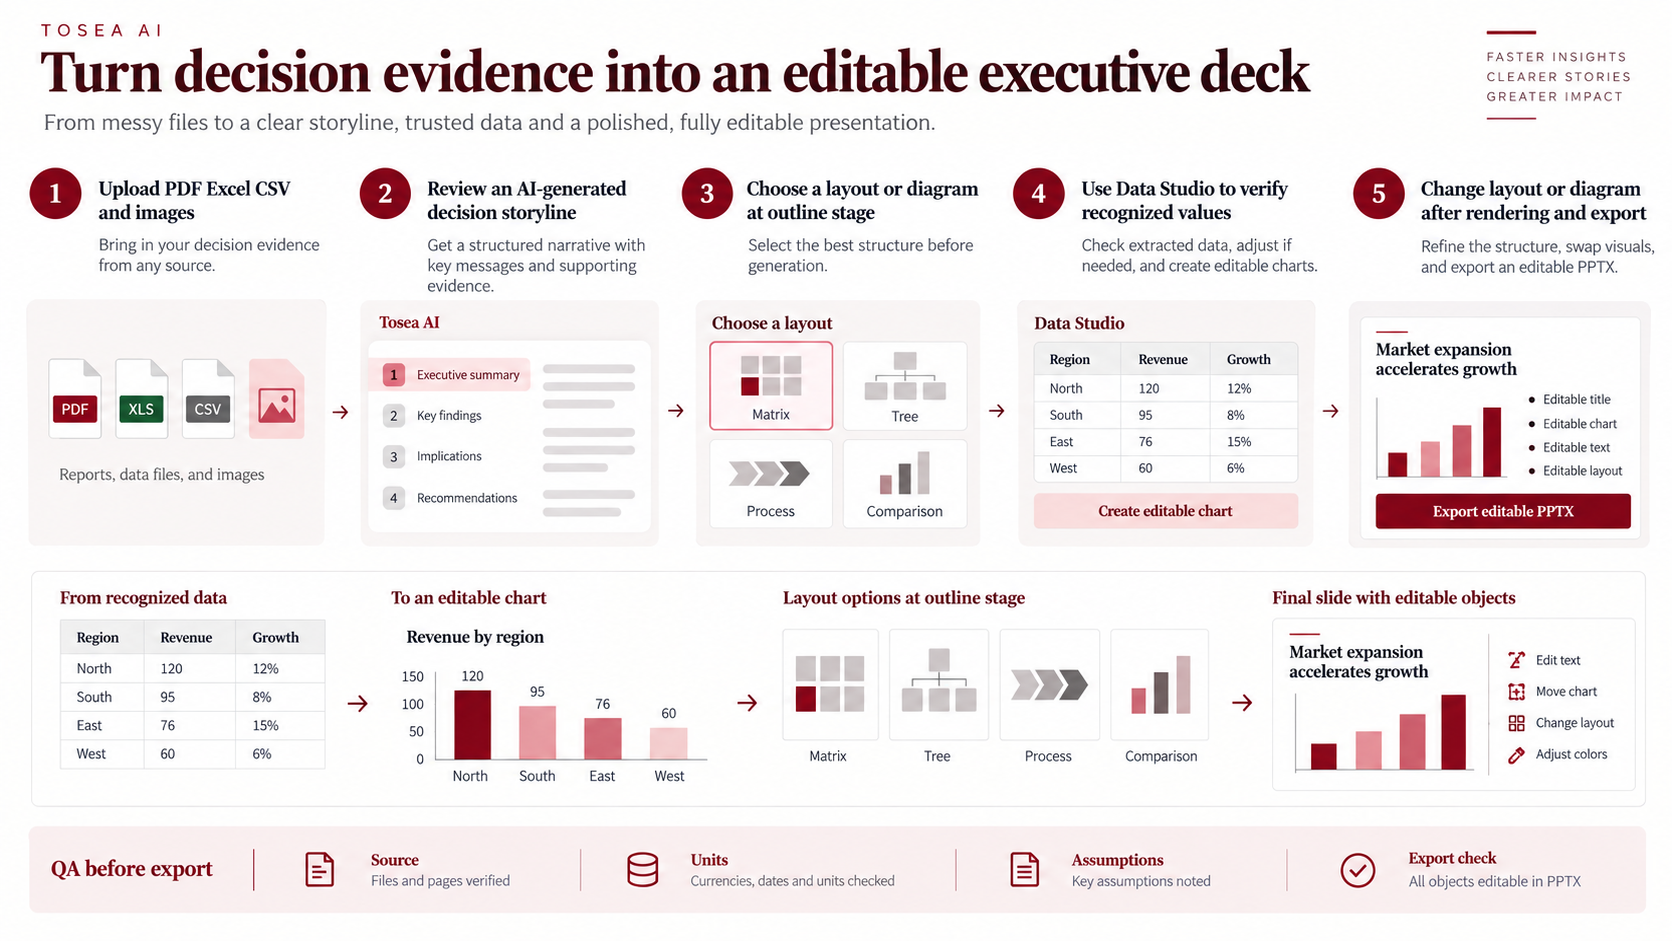
After editable PPTX export, check fonts, line breaks, chart labels, footnotes, and object positions in the delivery environment. Bain's public Decision Insights series provides useful context for connecting analysis to action.
Pre-Export Quality Checklist
- The title states a finding, not only the framework name.
- FS, CA, ES, and IS use one documented scale and sign convention.
- Each dimension has four to six variables with no double counting.
- X and Y calculations can be reproduced from the source table.
- The vector points from the origin to the calculated coordinate.
- Axis ends are labeled correctly: the far left of CA and the bottom of ES are the weak ends.
- Rater disagreements are shown in a footnote.
- A sensitivity test shows whether the posture is robust.
- Actions match the quadrant but reflect company-specific evidence.
- Each action has an owner, a funding limit, and a review gate.
- Forecasts and illustrative values are labeled.
- Sources, dates, and assumptions are visible.
- The exported PPTX has been checked in the delivery environment.
Frequently Asked Questions
What does SPACE stand for?
SPACE stands for Strategic Position and Action Evaluation. The matrix combines two internal dimensions, financial strength and competitive advantage, with two external dimensions, environmental stability and industry strength, to recommend an aggressive, conservative, competitive, or defensive posture.
Should I use a 1-to-6 or a 1-to-7 scale?
Either, as long as the whole analysis uses one. The 1-to-6 scale is common in older teaching materials; some later textbook editions use 1 to 7. Write the scale on the method page and keep it fixed across periods so year-on-year plots are comparable.
How is the SPACE Matrix different from SWOT?
SWOT lists factors and, through the TOWS extension, pairs them into strategy options. SPACE scores those kinds of factors and turns them into a single posture. Many teams run SWOT first to surface the variables, then use SPACE to decide how aggressive the resulting strategy should be.
How many variables should each dimension include?
Four to six per dimension is typical. Fewer, and one variable dominates the average; more, and weak signals dilute the important ones. Keep the counts similar across the four dimensions.
Can Tosea AI redesign my existing PowerPoint without changing the content?
Yes. Export the PowerPoint as a PDF, upload it to Tosea AI, and request a redesign that keeps the wording. Use Layout Only to refresh the visual structure. Review every label, footnote, chart value, and slide element before delivery.
Can I upload my own PowerPoint template to Tosea AI?
Tosea AI supports custom templates on eligible paid plans. Configure the template, then verify layouts, fonts, colors, logo placement, and master-slide rules before sharing the deck.
Can I tell AI to edit the layout only and keep the exact wording?
Yes. Layout Only changes the visual arrangement without intentionally rewriting the slide content. It is useful when the wording has already been approved. Compare the revised slide with the source to confirm that labels, citations, footnotes, numbers, and line breaks remain correct.
Turn a SPACE Score into a Decision-Ready Deck
A professional SPACE Matrix PowerPoint links the score to a decision, then defines the evidence that would confirm or overturn that decision. The four averages, the vector, the sensitivity test, and the owned actions belong on the page together; any one of them alone invites the wrong debate.
Tosea AI turns source files into a reviewable outline, assigns layouts and diagrams, builds editable charts in Data Studio, and exports an editable PPTX. Let the tool handle parsing, layout, and chart rebuilding, while the analyst focuses on the judgment the matrix cannot automate.
Sources
- The SPACE matrix: A tool for calibrating competition — Laetitia Radder and Lynette Louw, Long Range Planning, Vol. 31, No. 4, 1998
- The TOWS matrix: A tool for situational analysis — Heinz Weihrich, Long Range Planning, Vol. 15, No. 2, 1982
- RAPID: Bain's tool to clarify decision accountability — Bain & Company
- Decision Insights: How organizations make great decisions — Bain & Company
- The Growth-Share Matrix — Boston Consulting Group
- Enduring Ideas: The GE–McKinsey nine-box matrix — McKinsey & Company
- Data visualization style guidelines for Office Add-ins — Microsoft Learn