How to Build a BCG-Style GE McKinsey Matrix PowerPoint with AI
Build a defensible GE McKinsey nine-box matrix deck: weighted scoring, bubble plotting, five original slide examples with reusable AI prompts, and an analyst checklist before export.
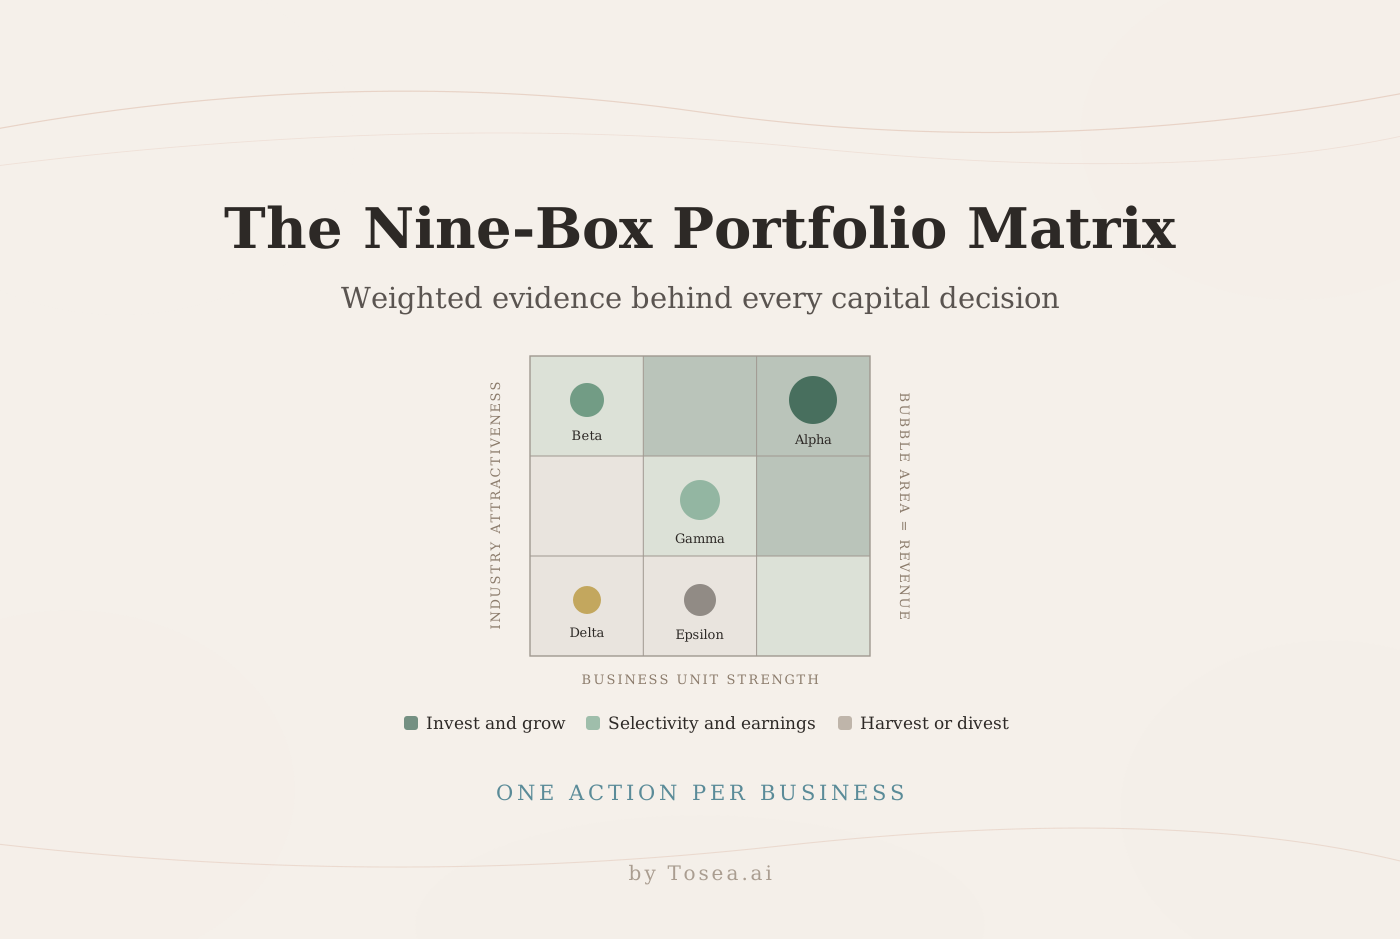
A strong GE McKinsey Matrix PowerPoint turns portfolio data into an investment decision that executives can understand in seconds. For analysts, the hard part is not drawing nine boxes. It is choosing defensible criteria, weighting them consistently, showing uncertainty, and translating every business unit position into a clear action. This guide explains that process and provides reusable AI prompts for building a polished, green consulting-style deck.
Quick answer: Score industry attractiveness and business unit strength, plot each business as a sized bubble in a three-by-three matrix, group the nine cells into invest, selective, and harvest zones, then attach evidence and actions to every position.
The GE McKinsey matrix and the BCG growth-share matrix are different frameworks. The former was developed by GE and McKinsey and uses multiple weighted factors. A BCG-style treatment here refers only to the clean, analytical visual language of the example slides. It does not imply affiliation with either firm.
Contents
- What the GE McKinsey matrix measures
- How it differs from the BCG growth-share matrix
- Five steps to build the matrix in PowerPoint
- A worked scoring example for one business unit
- Five slide use cases with reusable AI prompts
- Where nine-box decks get sent back
- Building and revising the deck in Tosea AI
- Analyst quality checklist
- Frequently asked questions
What the GE McKinsey Matrix Measures
The GE McKinsey nine-box matrix is a portfolio strategy tool for deciding where a company should invest, protect earnings, harvest cash, or exit. According to McKinsey, it emerged in the early 1970s, when General Electric asked the firm for a more systematic way to prioritize investment across a conglomerate that had grown to dozens of business units. A single profitability ranking could not answer the question, because a high-margin business in a shrinking market and a thin-margin business in an expanding one need opposite decisions.
The vertical axis measures industry attractiveness. Market attractiveness is also common working language. Relevant factors include market size, growth, pricing power, entry barriers, substitutes, competitive intensity, supplier power, regulation, technology shifts, interest rates, currency exposure, and social trends.
The horizontal axis measures business unit competitive strength. Typical factors include market share, profitability, cash flow, differentiation, relative price position, cost structure, logistics, marketing reach, service quality, customer perception, and technology. Separate current performance from the durability of the advantage — a share position built on an expiring contract is not the same asset as one built on switching costs.
The nine cells are usually summarized into three decision zones:
- Invest and grow: Allocate capital, build leadership, and pursue target growth.
- Selectivity and earnings: Invest only where returns and strategic fit are convincing. Protect cash generation elsewhere.
- Harvest or divest: Restructure, reduce exposure, harvest cash, sell, or exit.
These zones guide discussion rather than replace judgment. Strategic context may justify a different decision from the plotted position. A low-scoring unit that supplies a critical component to a high-scoring one is a supply chain decision before it is a portfolio decision, and the deck should say so on the page rather than in the appendix.
How the Nine-Box Differs from the BCG Growth-Share Matrix
Analysts are often asked why a company should use one rather than the other, and the answer belongs on a slide early in the deck. The two frameworks ask related questions with different levels of resolution.
| GE McKinsey nine-box | BCG growth-share matrix | |
|---|---|---|
| Axes | Industry attractiveness, business unit strength | Market growth rate, relative market share |
| Inputs per axis | Five to eight weighted criteria | One measure each |
| Cells | Nine, grouped into three zones | Four quadrants |
| Strength | Captures regulation, risk, and capability | Fast to build, hard to dispute the inputs |
| Weakness | Weighting is subjective and can be reverse-engineered | Two variables miss most of what makes a market attractive |
| Best used for | Capital allocation across dissimilar units | Cash-flow balance across a product portfolio |
In practice the nine-box wins when the portfolio is heterogeneous — a services unit, a hardware unit, and a regulated unit cannot be compared on market share alone. The growth-share matrix wins when the audience will challenge the inputs, because it only has two of them. Our BCG strategy templates guide covers the growth-share version in detail, including where its assumptions break.
The weakness of the nine-box is real and worth acknowledging in the deck: weights and scores can be chosen to produce a preferred answer. Everything in the rest of this guide — documented anchors, named sources, sensitivity analysis — exists to close that gap.
How to Build a GE McKinsey Matrix in PowerPoint
1. Define the portfolio decision
Start with one decision question, such as which units should receive the next three-year capital allocation. Define the units, horizon, currency, and decision owner. Do not mix products, countries, and legal entities without a common basis. If the company reports in two currencies, fix one for the analysis and note the rate and date on the slide.
The decision question also sets the bar for what counts as evidence. "Where do we invest for the next three years" requires forward-looking market data. "Which units should we exit this year" requires balance-sheet and separation-cost data. A matrix built for the first question rarely answers the second.
2. Choose evidence-based criteria
Use five to eight criteria per axis. Fewer than five and the matrix collapses into a growth-share matrix with extra steps. More than eight and the weights become too small to matter, which dilutes the criteria that actually drive value.
Choose measures that explain future value rather than describe the present. Record a definition, source, period, and owner for each criterion. World Bank DataBank can support market context, while audited company data should support internal performance. Where a criterion is a judgment call — regulatory risk, for example — write the anchor definitions before scoring, not after.
3. Weight and score consistently
Assign weights that total 100 percent on each axis. Score each factor on a defined scale, often 1 to 5, then calculate:
Weighted score = sum of (criterion weight × criterion score)
Scales and thresholds are company-defined. Document the scoring anchors so that a 4 means the same thing for every unit and every analyst. Anchors are usually more valuable than the weights themselves: two analysts who agree that "4 = growth above 8 percent with confirmed pricing power" will produce comparable results even if their weights differ by a few points.
4. Plot bubbles, not labels alone
Place each business at the intersection of its scores. Use bubble area for revenue, profit pool, or capital employed, and color for risk or cash generation. State the sizing measure in the legend, and size by area rather than by radius — sizing by radius exaggerates large units by the square of the difference and is one of the most common ways a portfolio chart misleads without anyone intending it to.
5. Add action and evidence
A matrix without a recommendation is only a chart. Add an action, capital implication, evidence, and risk for each business. Keep detailed assumptions on a separate slide, and keep the position and the action side by side on the summary page, so that nobody has to hold two slides in memory to follow the argument.
A Worked Scoring Example
The example slides in this guide use a five-business illustrative portfolio — Alpha, Beta, Gamma, Delta, and Epsilon. The table below shows how one of them, Beta, arrives at its position. Every figure is illustrative and exists to demonstrate the arithmetic, not to describe a real company.
Industry attractiveness for Beta's market
| Criterion | Weight | Score (1-5) | Weighted | Source |
|---|---|---|---|---|
| Market growth (3-year CAGR) | 25% | 5 | 1.25 | Third-party market study, 2026 |
| Market size and profit pool | 20% | 4 | 0.80 | Company estimate, audited revenue base |
| Pricing power | 15% | 4 | 0.60 | Win/loss analysis, 24 months |
| Entry barriers | 15% | 3 | 0.45 | Analyst assessment, anchored |
| Regulatory stability | 15% | 4 | 0.60 | Public regulatory filings |
| Substitution risk | 10% | 2 | 0.20 | Analyst assessment, anchored |
| Total | 100% | 3.90 |
Business unit strength for Beta
| Criterion | Weight | Score (1-5) | Weighted | Source |
|---|---|---|---|---|
| Relative market share | 25% | 2 | 0.50 | Market study, share by revenue |
| Contribution margin | 20% | 3 | 0.60 | Management accounts, FY2025 |
| Differentiation | 20% | 2 | 0.40 | Customer survey, n=140 |
| Cost position | 15% | 2 | 0.30 | Internal cost model |
| Service and delivery | 10% | 3 | 0.30 | SLA performance data |
| Talent and capability | 10% | 2 | 0.20 | Capability assessment |
| Total | 100% | 2.30 |
Beta lands at high attractiveness and low-to-moderate strength — the "target growth" cell in the top-left of the matrix. That position carries a specific implication: the market deserves capital, but the unit has not yet earned the right to win, so the recommendation is a capability investment with a defined checkpoint rather than an unconditional growth budget.
This is also where sensitivity analysis earns its place. Beta's strength score moves to 2.75 if differentiation improves from 2 to 5, which would not change the zone. It moves to 3.05 if relative share improves by one point and cost position by one point together, which would. Stating that on the slide tells the committee exactly which two operational programs are worth funding first.
Use Case 1: Executive Portfolio Overview
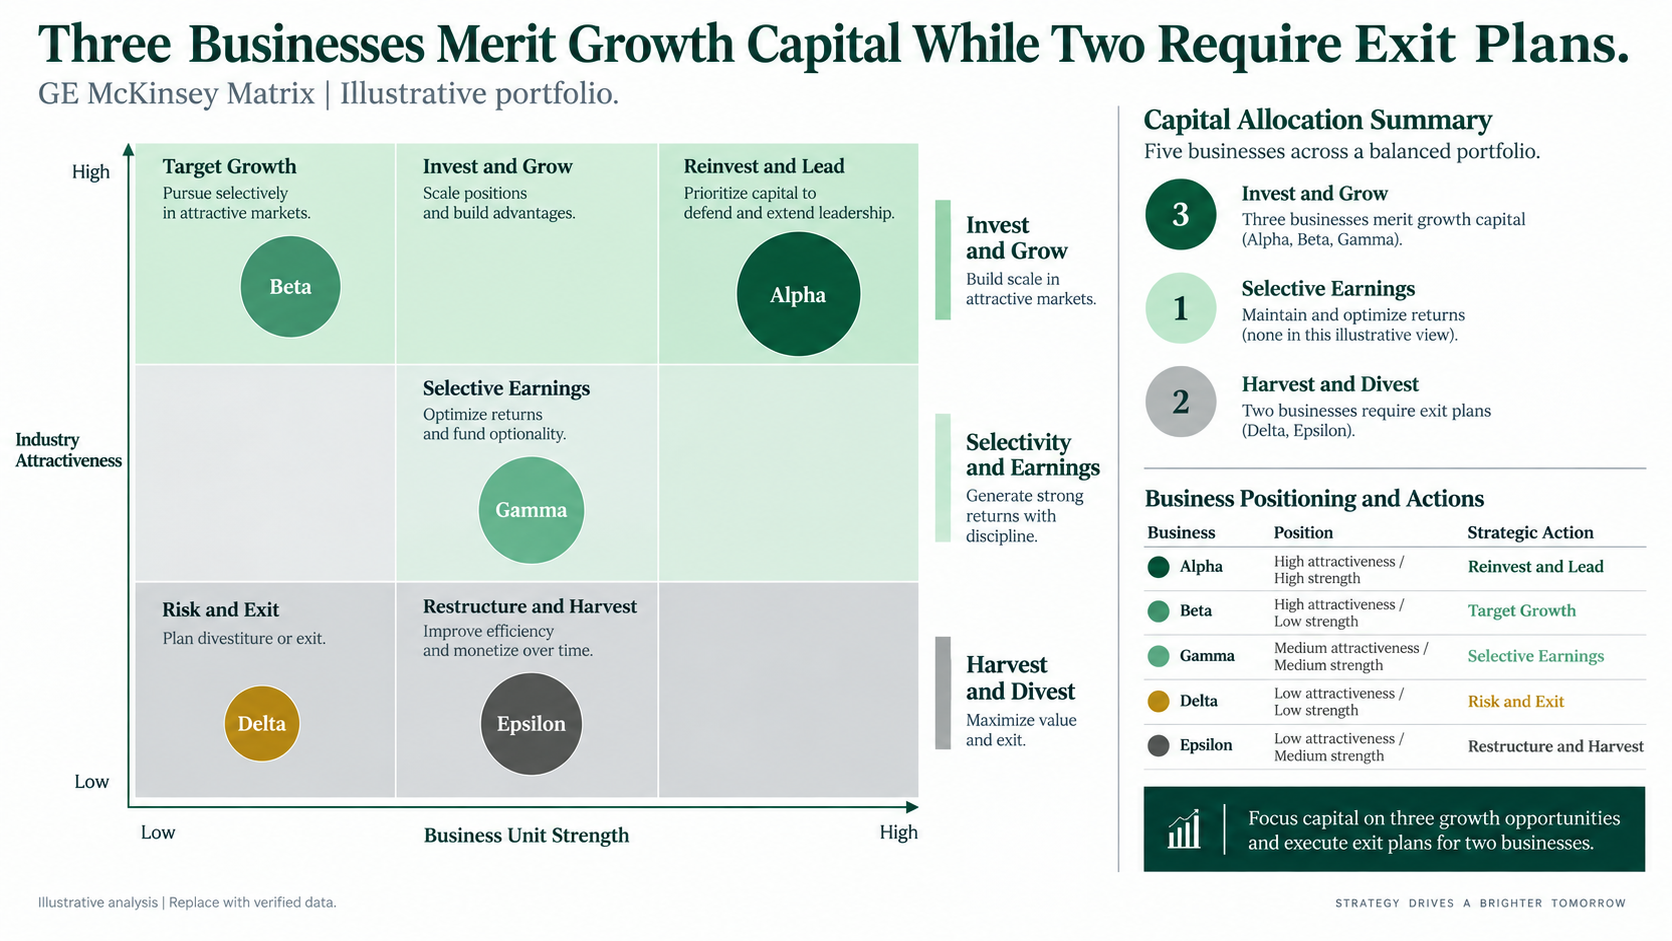
Use this slide for investment committees, board reviews, or annual strategy. It should answer where to invest and why, and it should be readable without narration, because it is the page that circulates after the meeting.
The evidence this page must carry: every bubble's position, the sizing measure, and one action per business. The failure mode that gets it sent back: five bubbles and no recommendation, which turns a decision page into a status update.
Reusable AI prompt
Create a 16:9 executive strategy slide titled Portfolio choices favor Digital Services and Specialty Solutions. Build a GE McKinsey nine-box matrix with industry attractiveness on the vertical axis and business unit strength on the horizontal axis. Plot five labeled bubbles sized by annual revenue. Use dark green for invest and grow, pale green for selective investment, and light gray for harvest or divest. Add a right-side panel with three portfolio recommendations, capital implications, and one key risk. Use a clean white background, precise alignment, restrained icons, small source notes, and editable chart elements. Do not add company logos.
Use Case 2: Weighted Scoring Methodology
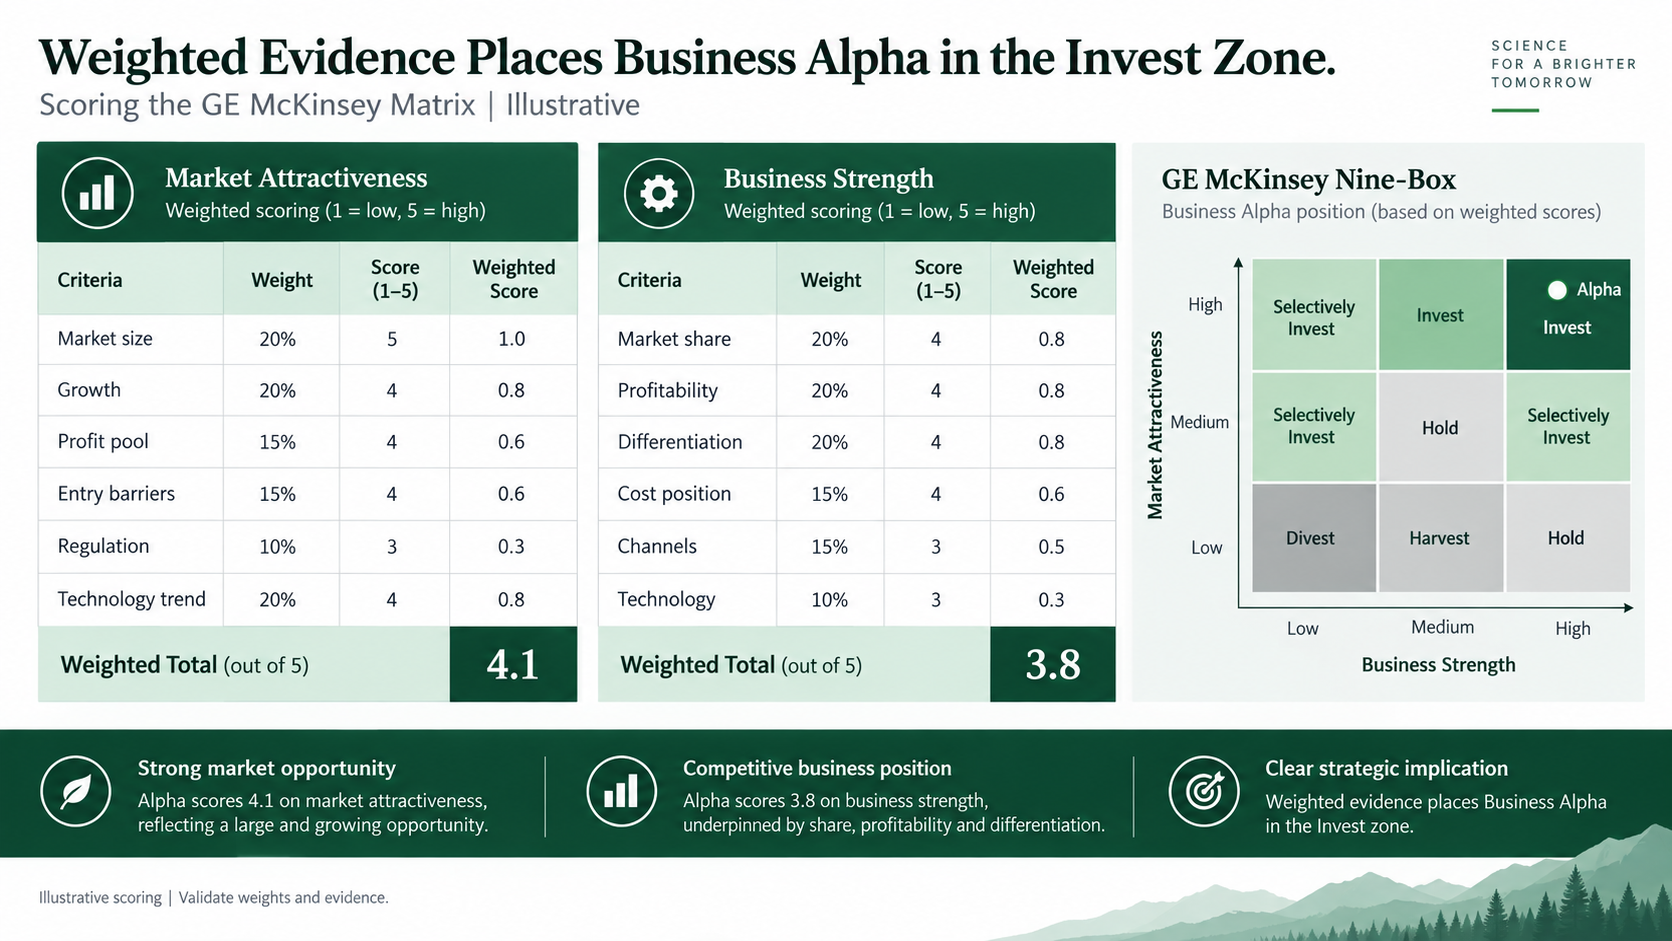
Use a scoring slide to make inputs auditable and to reveal whether one assumption is driving the result. This page is what separates a portfolio review from an opinion, and it is usually the first slide a skeptical CFO turns to.
The evidence this page must carry: criterion definitions, weights totaling 100 percent, sources, and a sensitivity view. The failure mode: weights presented without anchors, so that a reviewer cannot tell whether a 4 was earned or assigned.
Reusable AI prompt
Design a 16:9 methodology slide titled Weighted evidence places Business A in the invest zone. Show two compact scoring tables: industry attractiveness and business unit strength. Include criterion, weight, score from 1 to 5, weighted result, source, and confidence. Weights must total 100 percent for each axis. Add the weighted score formula, a small sensitivity chart for the top three assumptions, and a conclusion box. Use a dark green, mint, charcoal, and white consulting palette with editable tables and no decorative photography.
Use Case 3: Invest and Grow
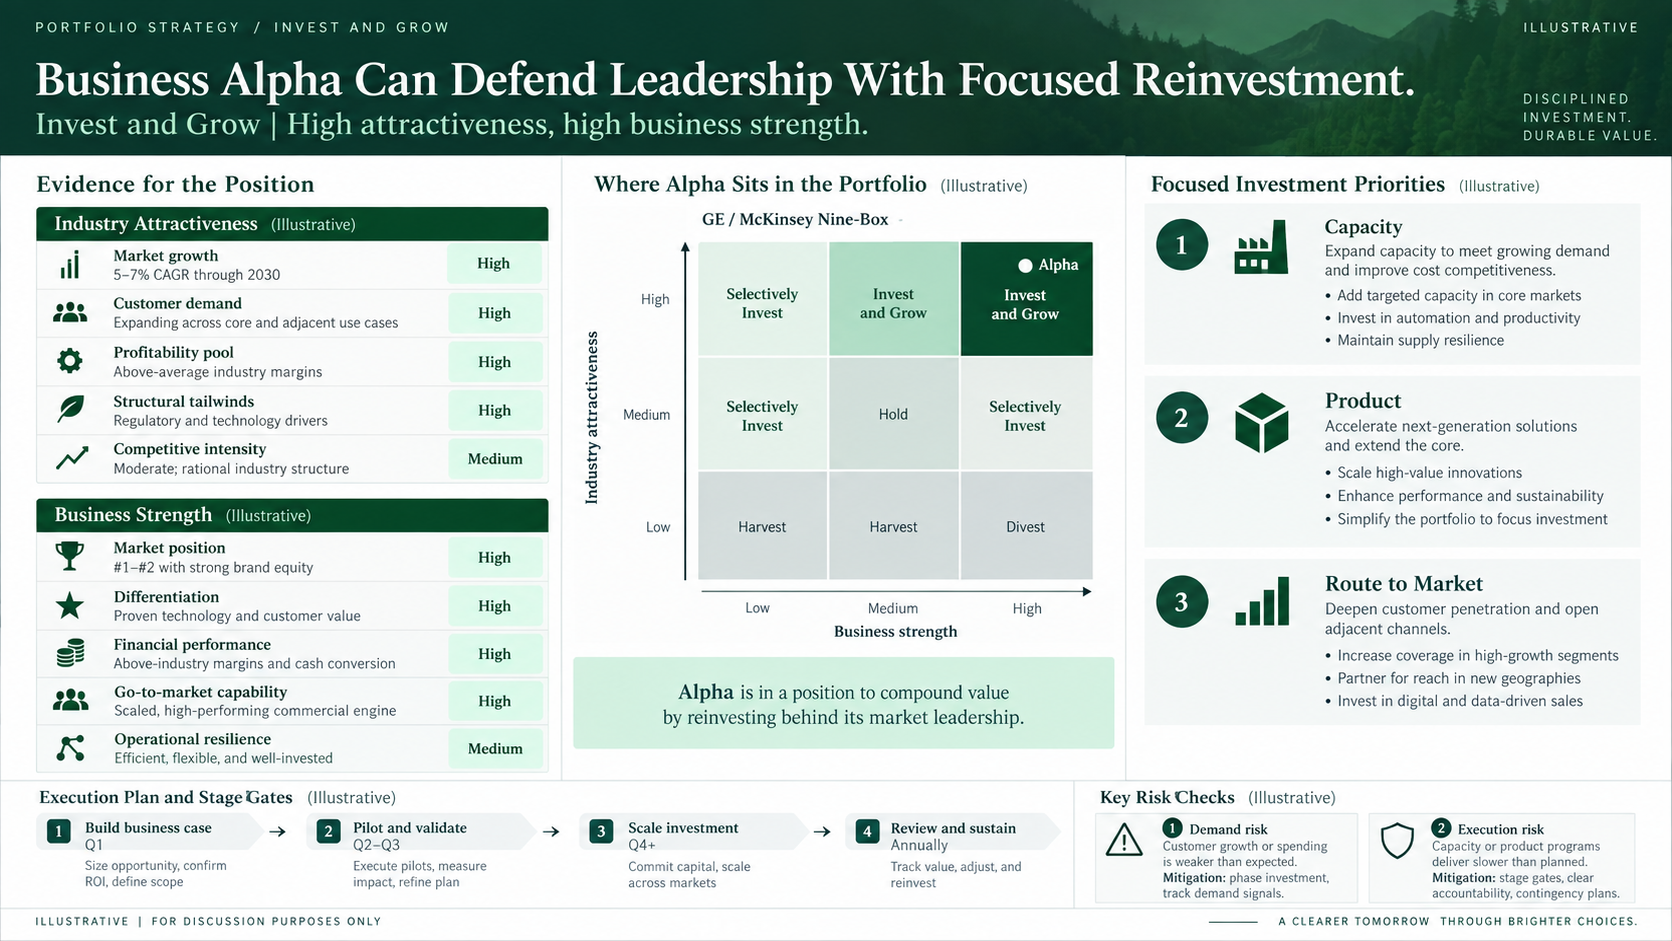
Use this page when market attractiveness and competitive strength justify capital. Show the thesis, milestones, return, and downside controls. The committee is not approving a position on a chart; it is approving a spending profile with checkpoints.
The evidence this page must carry: the investment amount by year, the value drivers behind the return, and the condition under which funding stops. The failure mode: a roadmap with no stop condition, which is how a three-year commitment quietly becomes a five-year one.
Reusable AI prompt
Create a green consulting-style recommendation slide for a business in the invest and grow zone. Use an action title stating that targeted investment can extend market leadership. Include a highlighted nine-box matrix, a three-year investment roadmap, three value drivers, required capabilities, milestone KPIs, and a risk-control panel. Show sample figures clearly as illustrative. Prioritize one message per visual, generous white space, editable shapes, and a concise source footer.
Use Case 4: Selectivity and Earnings
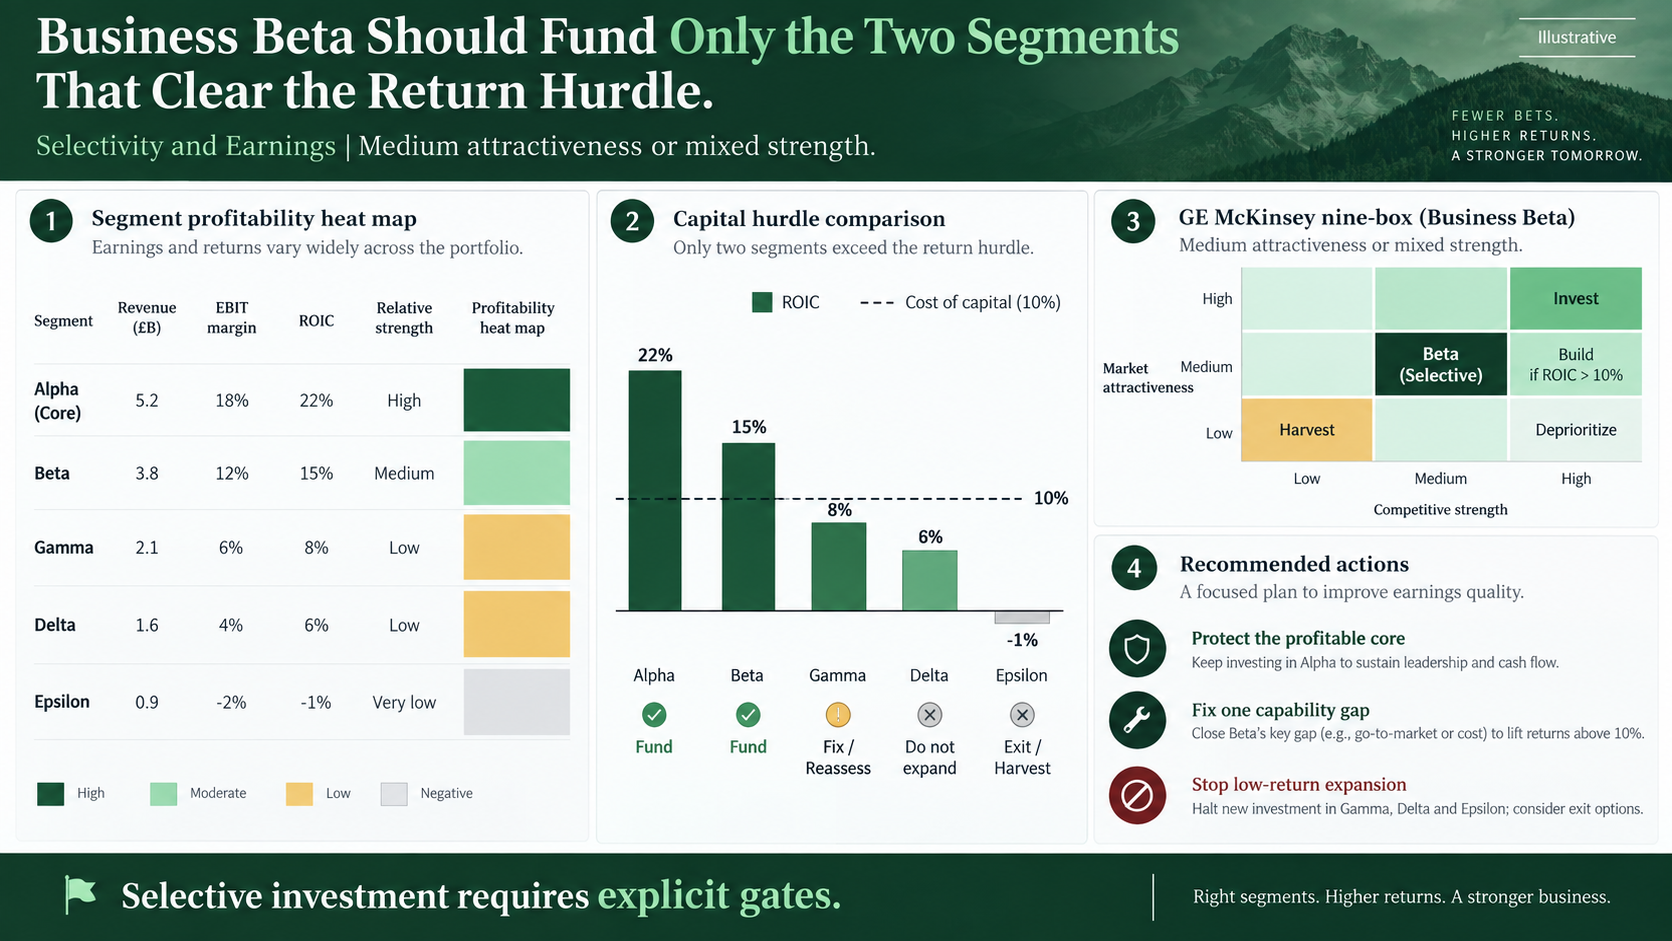
This zone requires the most judgment, which is exactly why it produces the vaguest slides. Fund initiatives that clear return thresholds, protect profitable niches, and avoid recommendations that amount to "continue as before."
The evidence this page must carry: a threshold that separates fund from stop, the cash impact of each initiative, and an owner with a date. The failure mode: a four-column list where every initiative is "maintain," which tells the committee nothing it did not already know.
Reusable AI prompt
Build a 16:9 portfolio slide for a business in the selectivity and earnings zone. The action title should state that focused investment protects earnings while limiting exposure. Show the business position on a nine-box matrix, then divide initiatives into fund, test, maintain, and stop. Add return thresholds, cash impact, owner, timing, and decision gates. Use a white background, dark green headings, mint highlights, charcoal text, and an evidence-based consulting layout with fully editable elements.
Use Case 5: Harvest, Restructure, or Exit
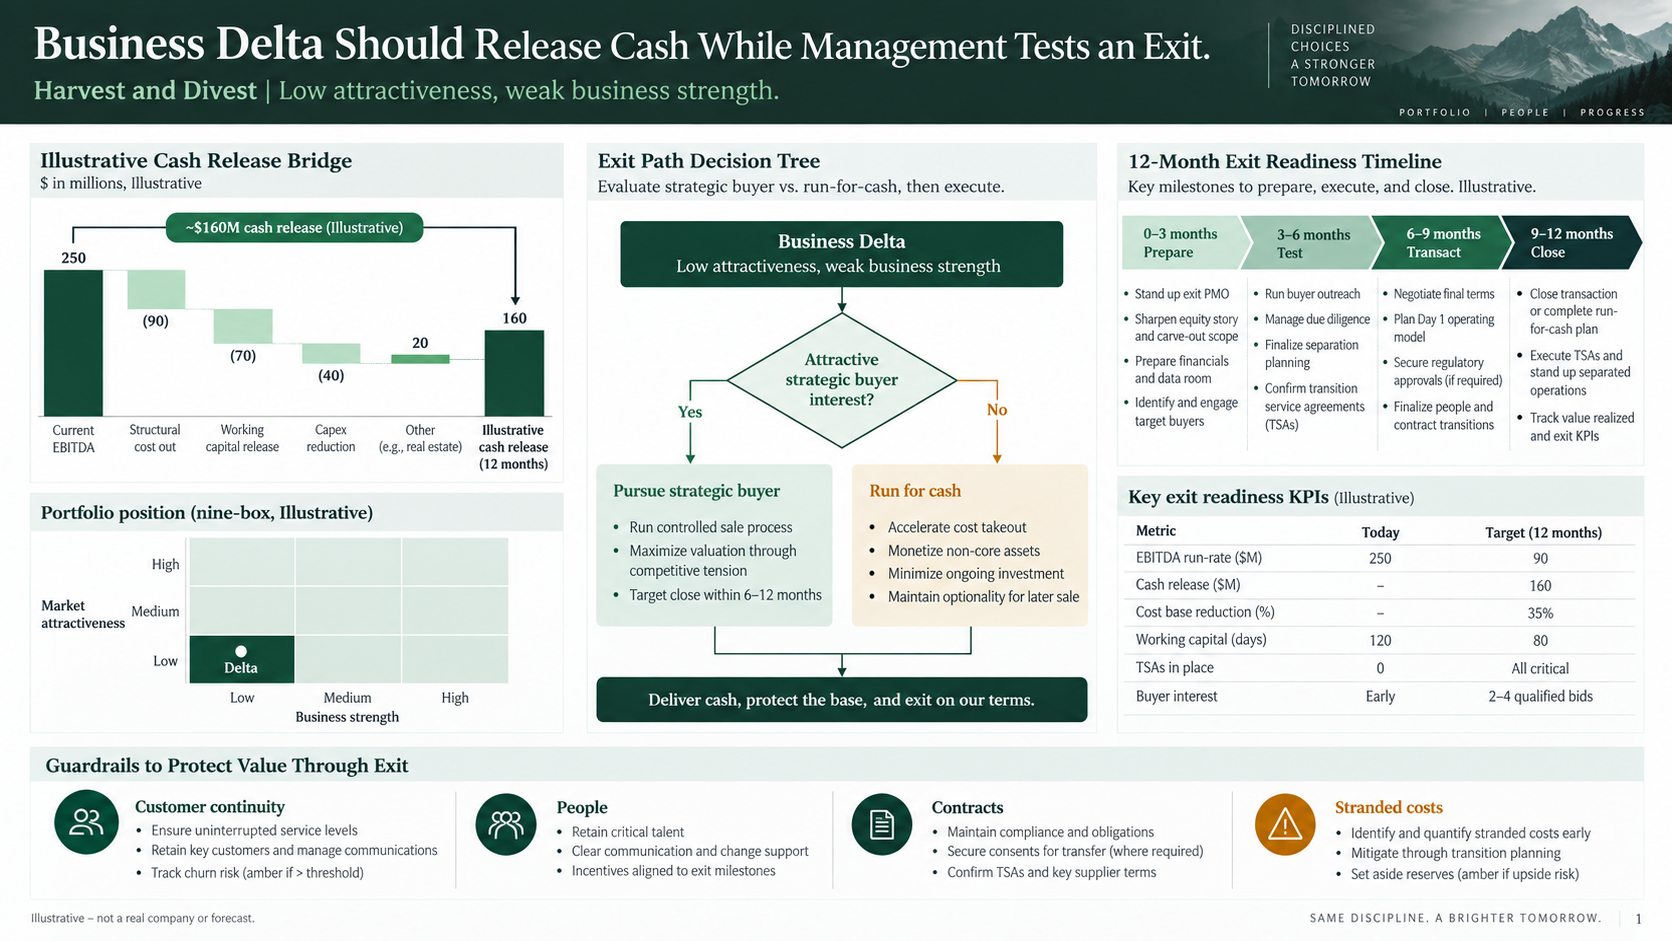
Use this page when expected recovery does not justify further capital. Separate harvest, turnaround, sale, and closure, because each produces a different cash profile, a different timeline, and a different set of stakeholder consequences.
The evidence this page must carry: cash released, execution time, one-time cost, and the trigger that starts each path. The failure mode: collapsing four distinct paths into the single word "divest," which hides the fact that a sale and a closure can differ by years and by an order of magnitude in one-time cost.
Reusable AI prompt
Create an executive options slide for a business in the harvest or divest zone. Include a highlighted nine-box position and compare four paths: harvest, restructure, sell, and exit. For each path show cash released, execution time, one-time cost, major risk, and trigger condition. Add a recommended path, a 100-day plan, and decision dependencies. Use subdued green and gray, simple tables, clear hierarchy, editable objects, and an explicit note that all numbers are illustrative.
Where Nine-Box Decks Get Sent Back
Across portfolio reviews, the same handful of problems account for most of the rework. None of them are design problems.
The weights were chosen after the scores. If the recommendation was formed first, a reviewer can usually find it by checking whether the highest weights sit on the criteria where the favored unit happens to score well. Fix this by locking weights before scoring and recording the date on which they were agreed.
Two units were scored by two analysts. Without shared anchors, one analyst's 4 is another's 2. Fix it by writing anchor definitions per criterion and having one person calibrate every unit's scores at the end.
The bubble size is undeclared. A reviewer sees a large bubble and assumes revenue; the analyst meant capital employed. The interpretation of the whole page changes. Fix it with a legend that names the measure, the period, and the currency.
Precision exceeds the evidence. A strength score of 3.42 implies two decimal places of confidence that no five-criterion judgment model has. Round to one decimal, and show the range where it matters.
The matrix is the answer rather than the summary. The position is a compression of the analysis. If the slide cannot survive the question "what would move this unit one cell to the right," the analysis behind it is thin. Our note on deck logic and argument structure covers how to build the supporting chain so the summary holds up.
Turn the Analysis into a Deck with Tosea AI
Tosea AI lets analysts shape the visual logic before and after generation. During the outline stage, select a layout or diagram for each slide, such as a nine-box matrix, weighted table, option comparison, roadmap, or decision tree. This prevents a strong analysis from being forced into a generic text-and-image page — the most common way a portfolio review loses its argument in the conversion from model to slides.
After rendering, change the layout or diagram without rebuilding the deck. If wording is approved, use Layout Only to refresh structure while preserving content. Compare the result with the source and verify labels, footnotes, citations, and numbers.
A practical workflow is:
- Upload research, a PDF, or an existing presentation reference.
- Ask Tosea AI to produce a decision-led outline.
- Assign the correct diagram to each slide at outline stage.
- Generate the deck in a restrained green consulting theme.
- Replace weak layouts or diagrams after rendering.
- Export an editable PPTX and review it in the delivery environment.
Two limitations are worth planning around. Generated figures are illustrative until an analyst replaces them, so every number on a committee-facing page needs a manual pass against the source model. And export fidelity depends on the fonts available in the delivery environment, which is why the checklist below ends in PowerPoint rather than in the preview. For a broader view of where layout decisions belong in the process, see our PowerPoint layout patterns guide.
Analyst Quality Checklist
- The title states a conclusion, not a topic.
- Every criterion has a definition, source, period, and owner.
- Axis weights total 100 percent and scoring anchors are documented.
- Weights were agreed before scores were assigned.
- Bubble size has one declared meaning and uses area consistently.
- Recommendations include capital, timing, owner, milestone, and risk.
- Sensitivity analysis tests the assumptions that can change the zone.
- Rounding matches the precision the evidence supports.
- Sources and caveats are readable at presentation size.
- Exported fonts, charts, labels, and footnotes are checked in PowerPoint.
Frequently Asked Questions
What is the difference between the GE McKinsey matrix and a BCG matrix?
The GE McKinsey nine-box scores each axis from five to eight weighted criteria, which captures regulation, risk, and capability. The BCG growth-share matrix uses one measure per axis — market growth and relative market share — which makes it faster to build and harder to dispute. Use the nine-box for capital allocation across dissimilar units, and the growth-share matrix for cash-flow balance across a product portfolio.
How many criteria should each axis have?
Five to eight. Below five, the matrix behaves like a two-variable model with extra steps. Above eight, individual weights fall low enough that the criteria driving value get diluted by ones that do not.
How do you keep the weighting from being arbitrary?
Agree weights before scoring, write anchor definitions for every criterion so that a given score means the same thing across units, have one person calibrate the final scores, and publish a sensitivity view showing which assumptions could move a business into a different zone.
Can Tosea AI redesign my existing PowerPoint without changing the content?
Yes. Export the PowerPoint as a PDF, upload it to Tosea AI, and request a redesign that keeps the original wording. Use Layout Only when the goal is to refresh visual structure without intentional rewriting. Review every label, footnote, and slide element afterward.
How do I upload a PowerPoint and ask Tosea AI to redesign each slide?
First export the PowerPoint as a PDF. Upload the PDF, state that the content and sequence must remain intact, choose a template or visual direction, generate the deck, and inspect each slide before exporting the revision.
Can I upload my own PowerPoint template to Tosea AI?
Tosea AI supports custom templates on eligible paid plans. Confirm that the required layouts, fonts, colors, logo placement, and master-slide rules are represented before sharing the final deck.
Can Tosea AI use custom brand colors, fonts, and a logo?
Yes. Provide the required colors and fonts in the instructions and upload the logo or use a supported custom template. After export, verify font availability, color values, logo clear space, and contrast.
Can Tosea AI match the style of my old company presentations?
Tosea AI can use a representative deck as design guidance. This should not be described as permanent model training. For stronger consistency, use an approved template and compare the output with current brand guidelines.
Does Tosea AI preserve PowerPoint formatting after export?
Editable PPTX export is designed to stay close to the preview while keeping elements editable. Fonts, graphics, and software environments can affect results, so test the file in the delivery setup.
Can I tell AI to edit the layout only and keep the exact wording?
Yes. Layout Only changes visual structure without intentionally rewriting content. Compare the edited slide with the source to confirm that citations, labels, footnotes, and line breaks remain correct.
Build the Next Portfolio Review Faster
A credible GE McKinsey Matrix PowerPoint combines transparent scoring with clear resource choices. The matrix is the summary, not the analysis. When the evidence, assumptions, and actions are visible, executives can challenge the right inputs and reach a decision in one meeting instead of three.
Use Tosea AI to turn that analysis into a structured, editable presentation, choose the right diagram during outlining, and refine the visual system after rendering. For related techniques, read Best BCG Strategy Consulting PowerPoint Templates, How to Make a PwC-Style Ansoff Matrix PowerPoint with AI, the McKinsey-style 3C analysis guide, and the AI presentation workflow for PPT designers.
Sources
- Enduring Ideas: The GE and McKinsey nine-box matrix — McKinsey & Company
- Thinking strategically — McKinsey & Company
- BCG history and the Growth-Share Matrix — Boston Consulting Group
- World Bank DataBank — The World Bank