How to Make a PwC-Style PowerPoint with AI: Ansoff Matrix Guide
Build a PwC-style growth deck with AI using the Ansoff Matrix: what evidence each quadrant needs, the failure mode that gets it sent back, and four reusable slide prompts.
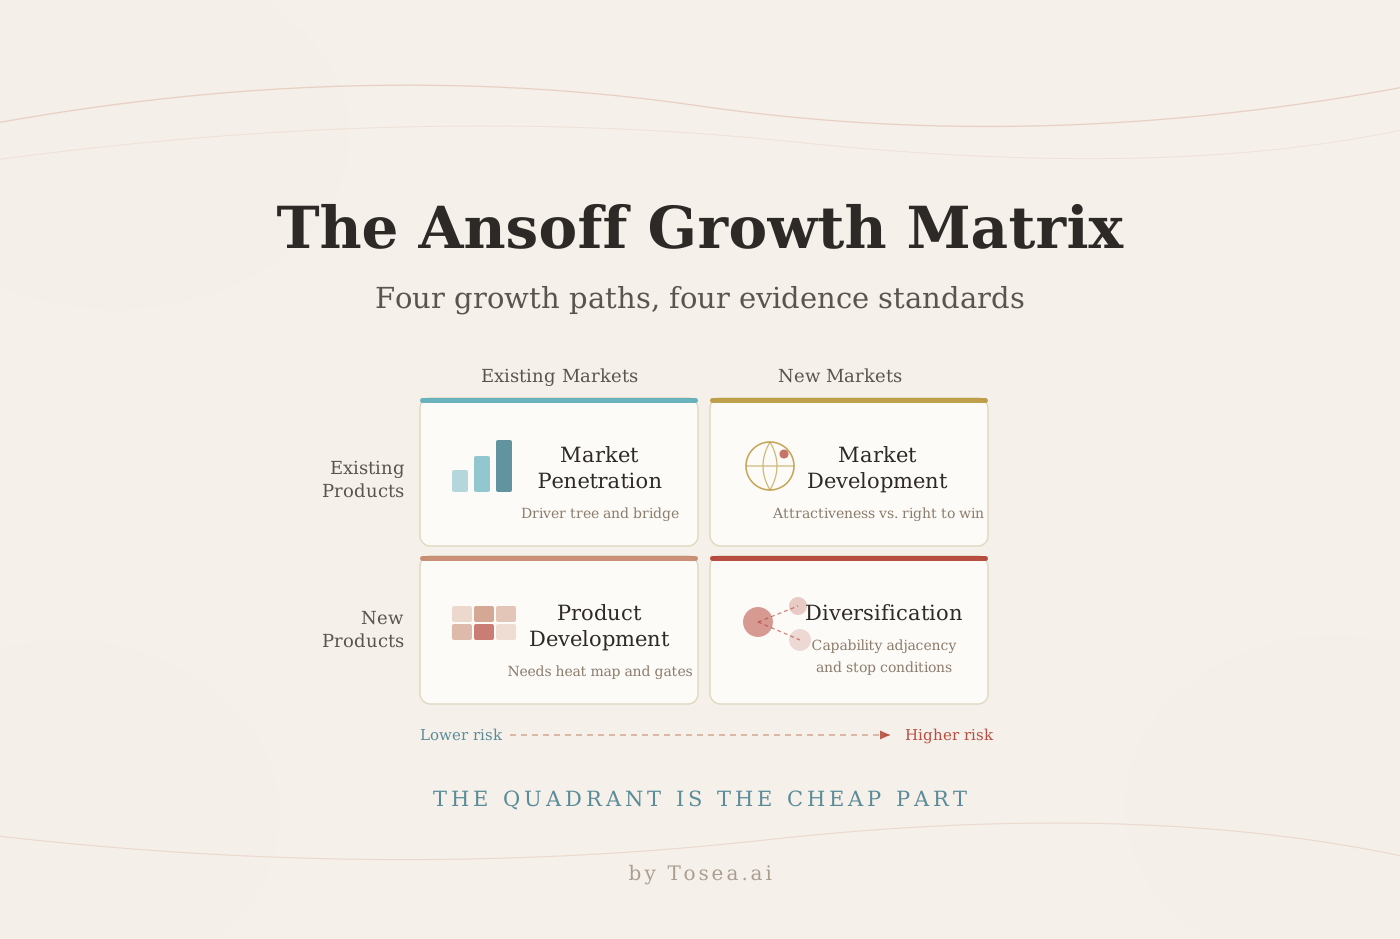
A PwC-style PowerPoint with AI should do more than place a familiar framework on a polished slide. It should make a growth decision easier to understand, test, and defend. The Ansoff Matrix is useful because it turns a broad ambition such as "grow revenue" into four distinct paths: market penetration, market development, product development, and diversification. This guide shows when to use each path, what evidence belongs on the slide, where each page tends to fail review, and how to prompt AI for a presentation that feels rigorous rather than decorative.
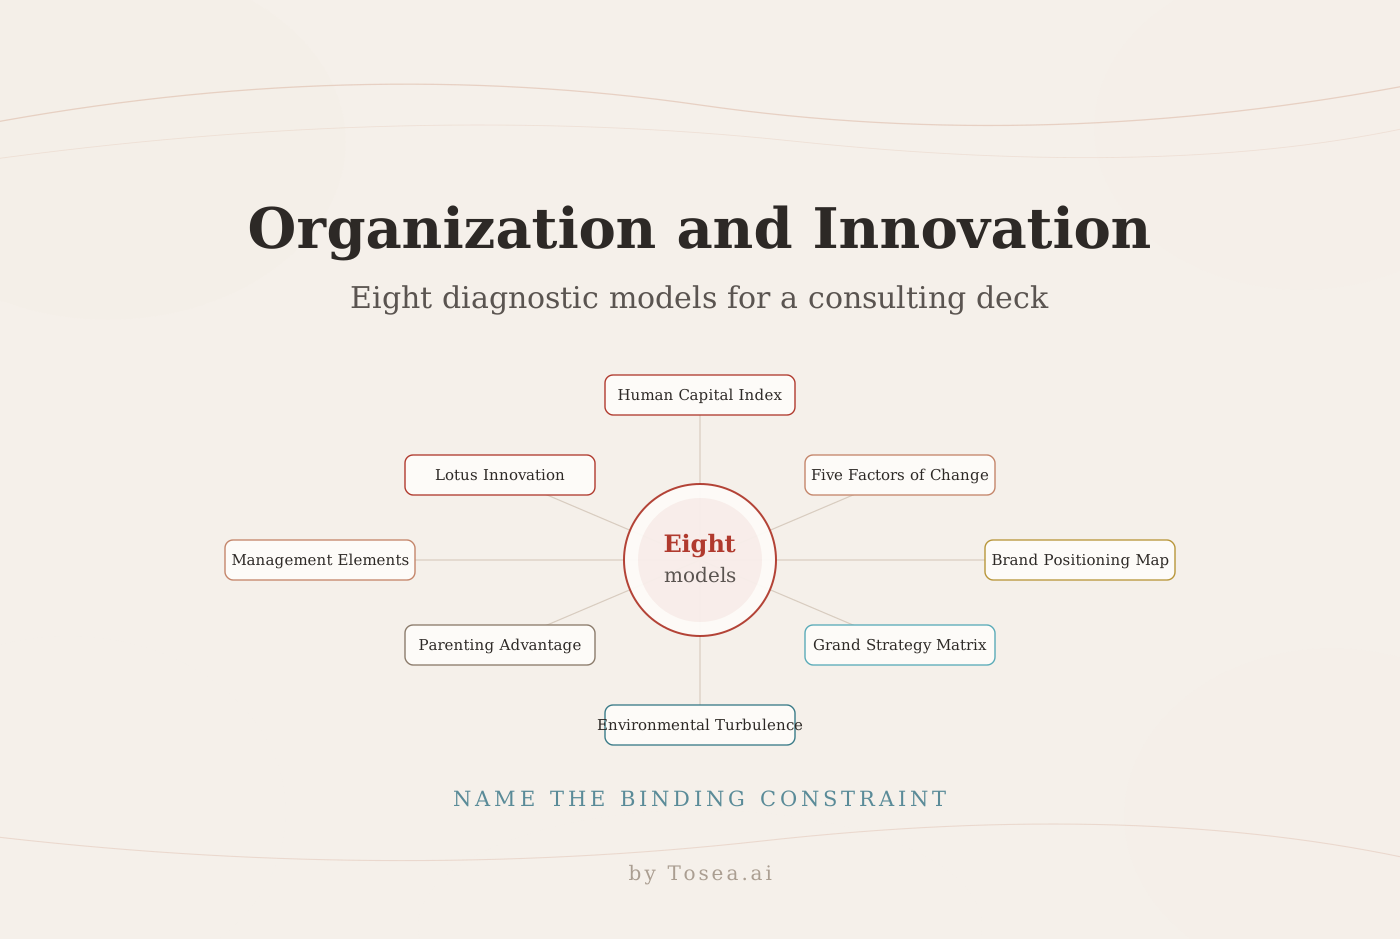
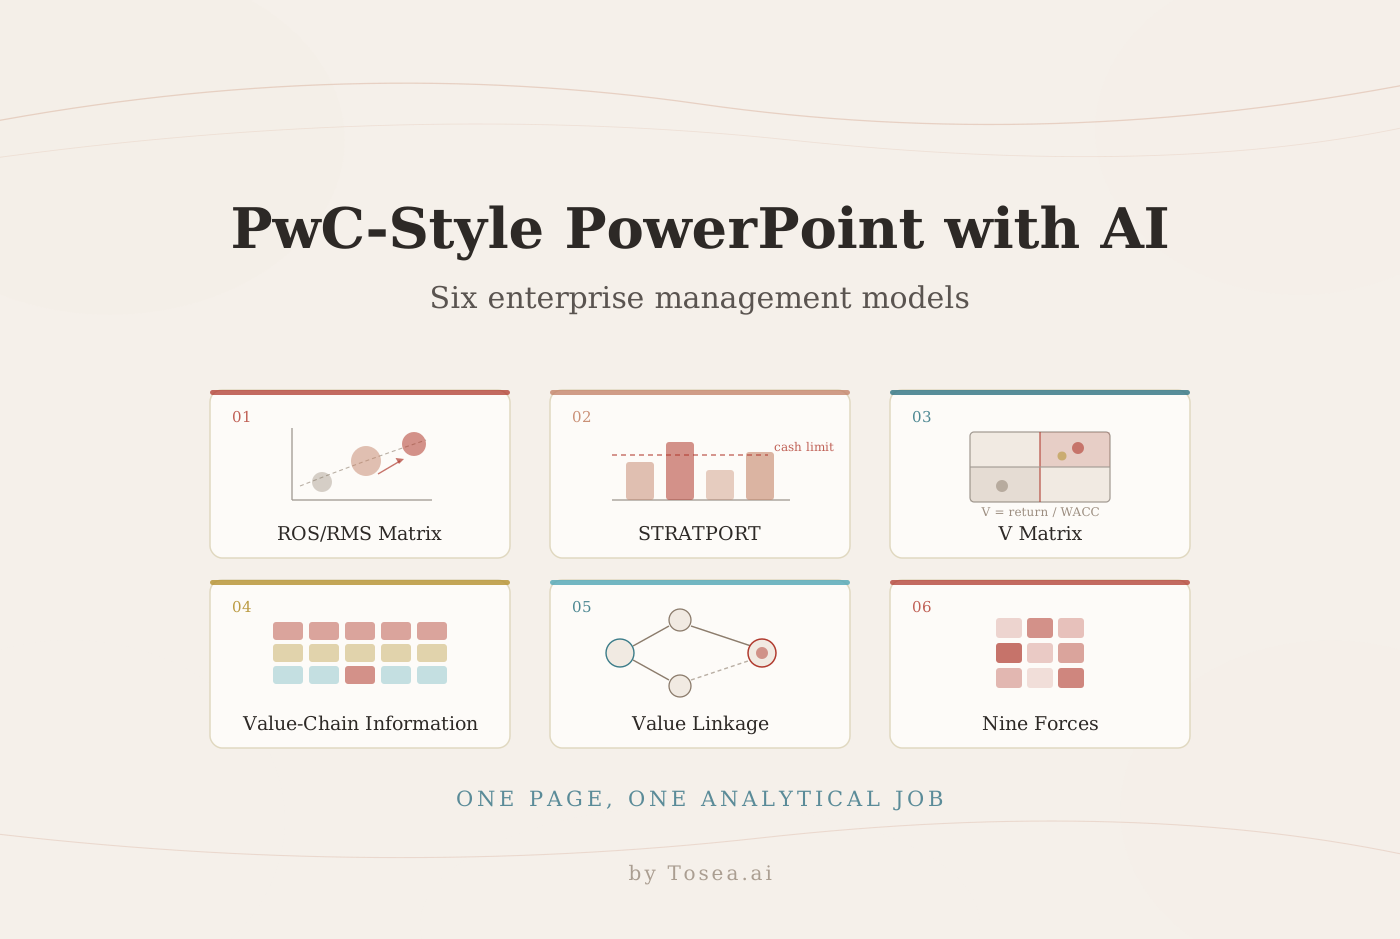
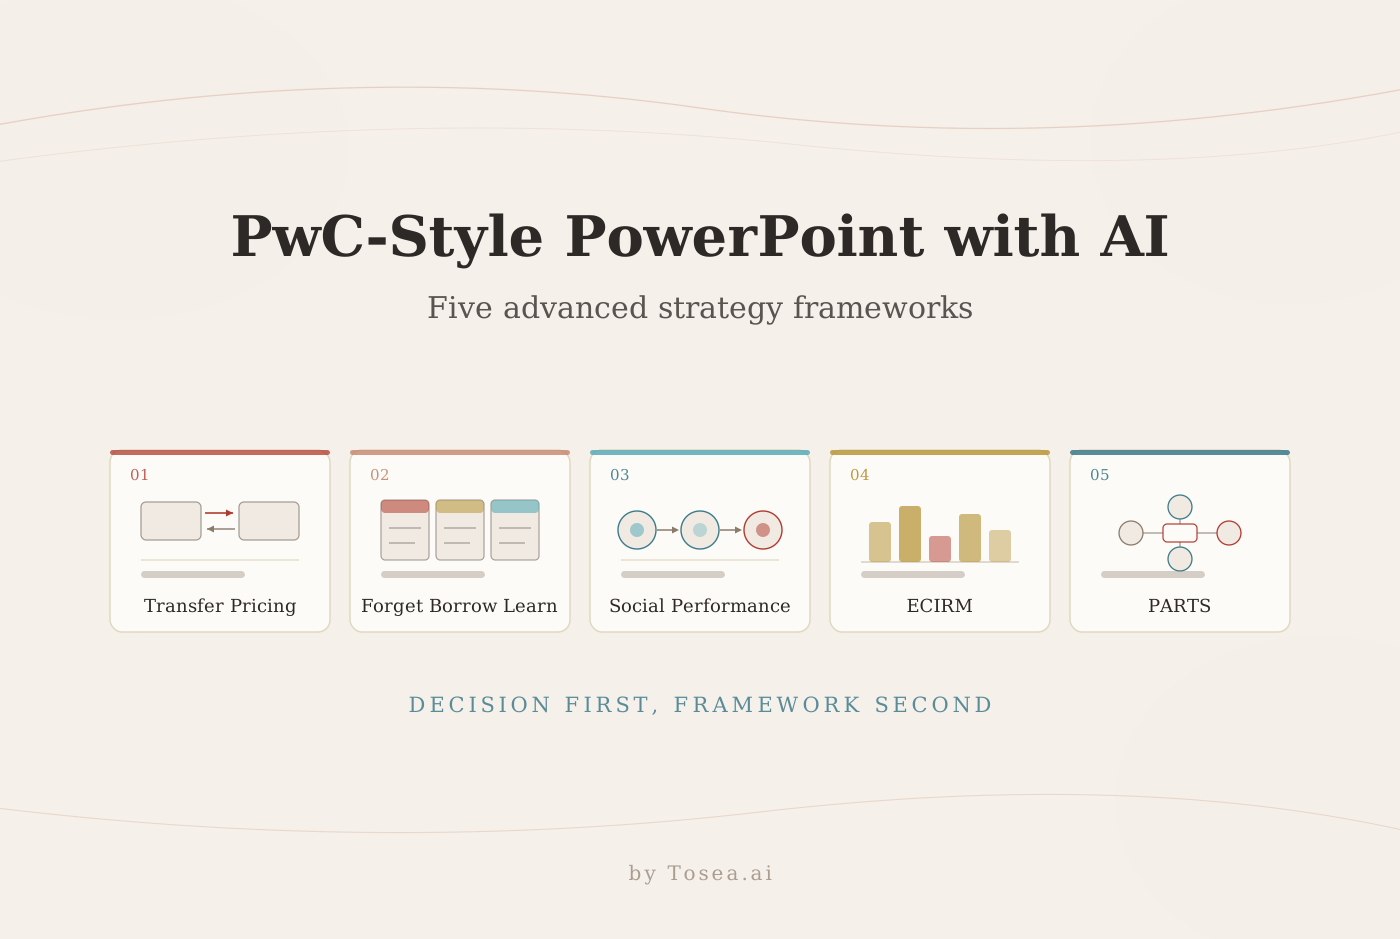
This is the fifth guide in the series. The PwC-style consulting deck guide covers the page system and seven commercial frameworks, five advanced strategy frameworks handles transfer pricing and corporate venturing, six enterprise management models covers portfolio and hurdle-rate questions, and eight organization and innovation models covers the delivery side. This one narrows to a single question: where should growth come from?
The original visuals below apply professional consulting principles but are not PwC templates and do not imply an affiliation with PwC.
Quick Answer
To build an Ansoff-based growth deck with AI, pick the quadrant that matches the decision, then build the page around the evidence that quadrant specifically requires — driver economics for penetration, market attractiveness versus right to win for development, willingness-to-pay research for product development, and capability adjacency for diversification. Write conclusion-led titles, separate actuals from forecasts, and stage the commitment behind evidence gates. Tosea AI supports that sequence with outline review before rendering, layout and diagram selection both before and after slide generation, and editable PPTX export.
What Is the Ansoff Matrix and When Should You Use It?
Igor Ansoff introduced the product-market growth logic in his 1957 article, "Strategies for Diversification." The framework asks two practical questions: is the product existing or new, and is the market existing or new? Their combinations produce four growth routes.
Use the matrix to compare growth options, allocate investment, build a market-entry thesis, or test portfolio choices. It is most helpful before a team jumps into tactics.
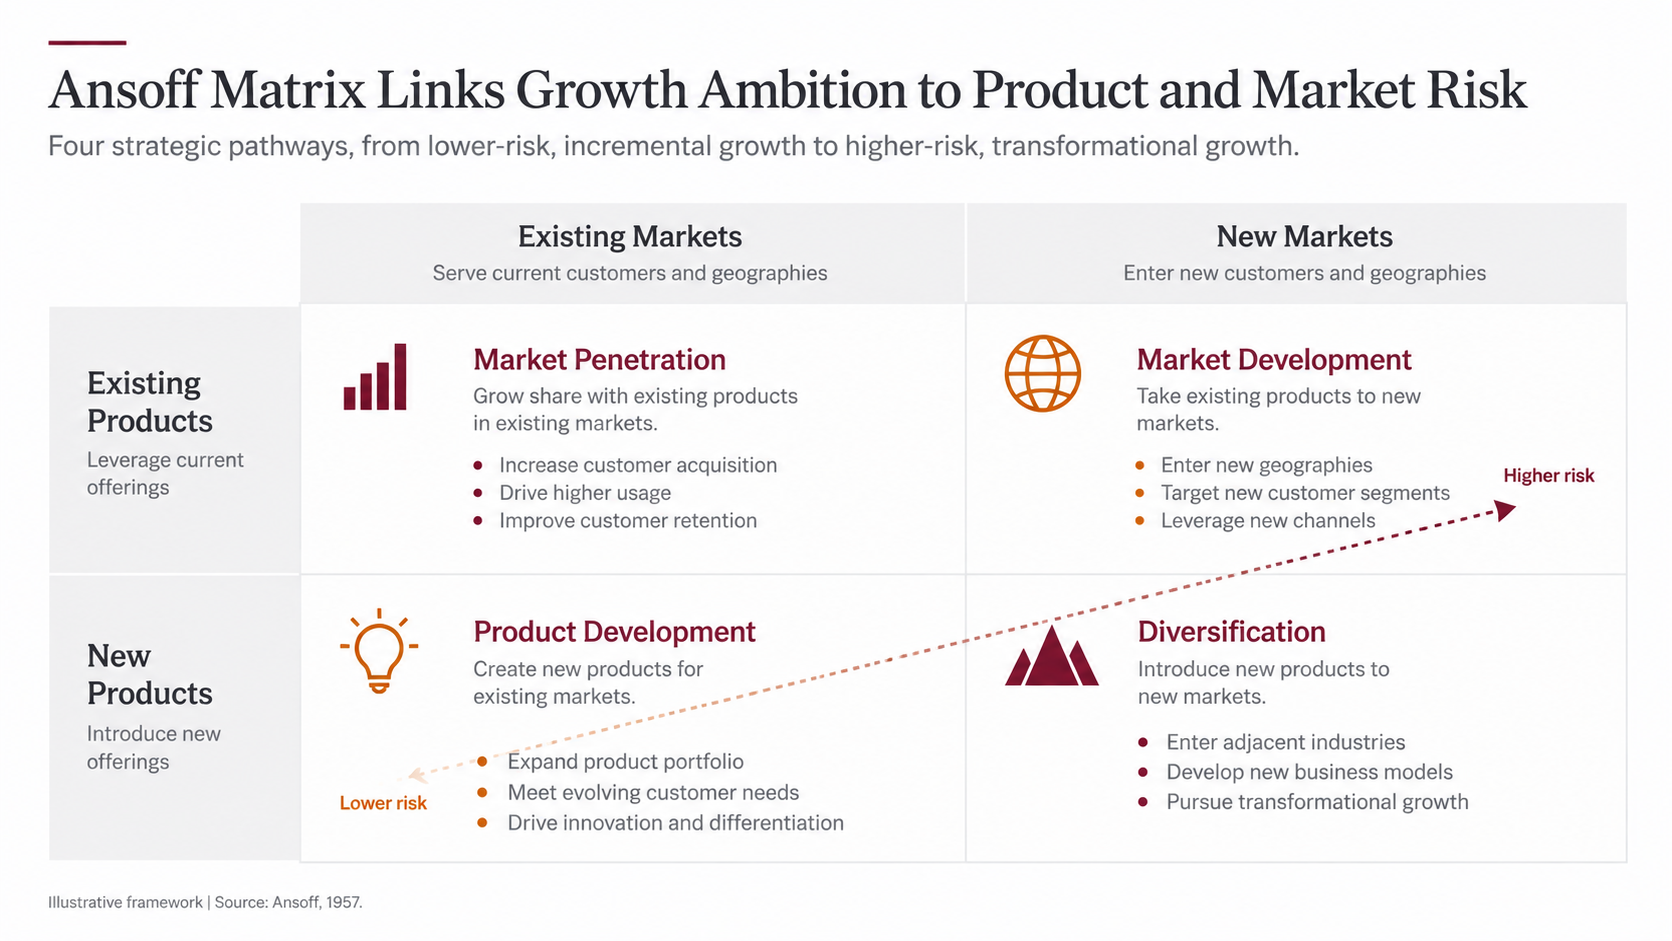
The matrix frames a decision but does not select a winner. A defensible recommendation still needs customer evidence, market economics, competitive analysis, capability fit, investment requirements, and downside scenarios. Diversification generally carries the greatest uncertainty because both dimensions are new, although risk depends on context.
For an accessible academic discussion of the original framework, see this North-West University research repository paper. A professional study text from the Institute of Chartered Accountants of Nigeria also summarizes the four growth directions.
The four paths at a glance
| Path | The question it answers | Evidence that carries the page | Typical time to proof | Where it fails review |
|---|---|---|---|---|
| Market penetration | Can we get more from what we already have? | Retention, conversion, frequency, price-volume mix, channel productivity | 1-2 quarters | A driver tree whose branches double-count the same revenue |
| Market development | Where else does this offer work? | Market size and growth, channel access, regulation, localization cost, unit economics | 2-4 quarters | Attractiveness scored carefully, right to win asserted |
| Product development | What else do our customers need from us? | Interviews, usage, willingness-to-pay tests, churn reasons, delivery cost | 2-3 quarters | A feature list presented as a product strategy |
| Diversification | Can we build a new engine? | Capability adjacency, transferable assets, capital exposure, execution risk | 4+ quarters | Market size used as a substitute for a right to win |
The PwC page system, briefly
The visual grammar is covered in depth in the first guide in this series, so this is a recap. Restrained burgundy carries the recommendation and nothing else. Charcoal handles body text, a warm mid-tone marks secondary emphasis, and neutral gray marks the option you are not recommending. Titles state the finding in a full sentence. One exhibit occupies roughly two-thirds of the page, with implications in the remaining third. Every material number carries a source note.
1. Market Penetration: Grow More From the Current Core
Market penetration means selling existing products in existing markets. It is the right lens when management wants to increase share, usage, purchase frequency, conversion, retention, or cross-sell without changing the core offer or target market.
A strong consulting slide decomposes growth into measurable drivers. Start with the current revenue or customer base, quantify each lever, and finish with a decision. Useful evidence includes retention, conversion, price-volume mix, purchase frequency, share of wallet, and channel productivity.
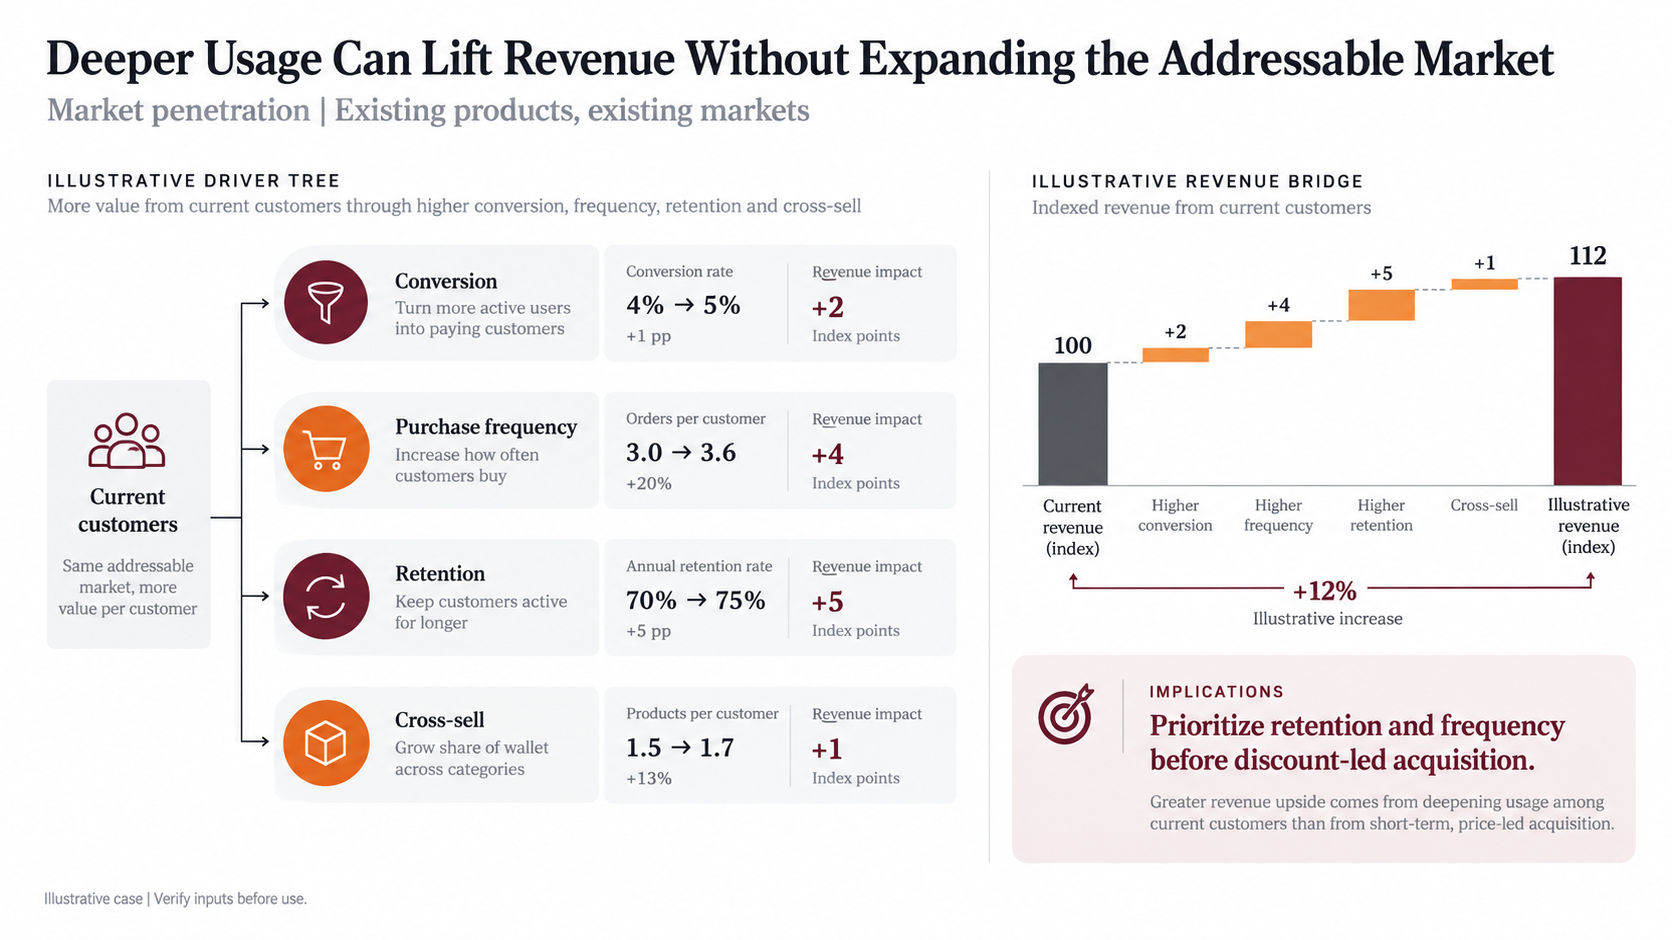
Evidence the page must carry
- A named baseline: current revenue or active customers, as of a stated date, from a stated system.
- Drivers that are arithmetically independent. If "improve conversion" and "increase acquisition" both claim the same incremental customers, the bridge overstates the opportunity.
- A realistic ceiling for each lever, ideally from the company's own historical range rather than an industry benchmark.
- The cost of pulling each lever. A retention gain bought with a permanent discount is a margin decision, not a growth decision.
Where this slide gets sent back
Penetration decks fail on double-counting more than on any other issue. The second failure is a bridge with no downside bar: every lever points up, the total lands exactly on the target, and the reviewer correctly concludes that the target was set first and the drivers reverse-engineered. Show at least one headwind — churn, price erosion, a channel that is shrinking — and the page immediately reads as analysis rather than advocacy.
Reusable AI Prompt for Market Penetration
Create one 16:9 executive strategy slide for market penetration. Audience: [leadership team]. Business: [company and product]. Decision required: [decision]. Use only the verified data below: [paste data and sources]. Build a driver tree covering acquisition, conversion, purchase frequency, retention, pricing, and cross-sell. Add a revenue bridge from the current baseline to the target. Write an action title that states the main implication. Use a restrained consulting layout with white space, charcoal text, muted burgundy accents, and one warm highlight color. Label estimates and assumptions clearly. Do not invent numbers. Add source notes and a recommendation box.
2. Market Development: Take the Core Offer to New Markets
Market development uses an existing product to serve a new geography, customer segment, channel, or use case. It fits questions such as which country to enter, whether an enterprise product can serve mid-market buyers, or whether a direct-sales offer can scale through partners.
This slide should compare markets rather than show a generic map. Separate attractiveness from the right to win. Market size and growth describe opportunity. Channel access, regulation, localization effort, unit economics, and competition describe feasibility. A bubble matrix reveals priorities, while a staged entry path limits irreversible investment.
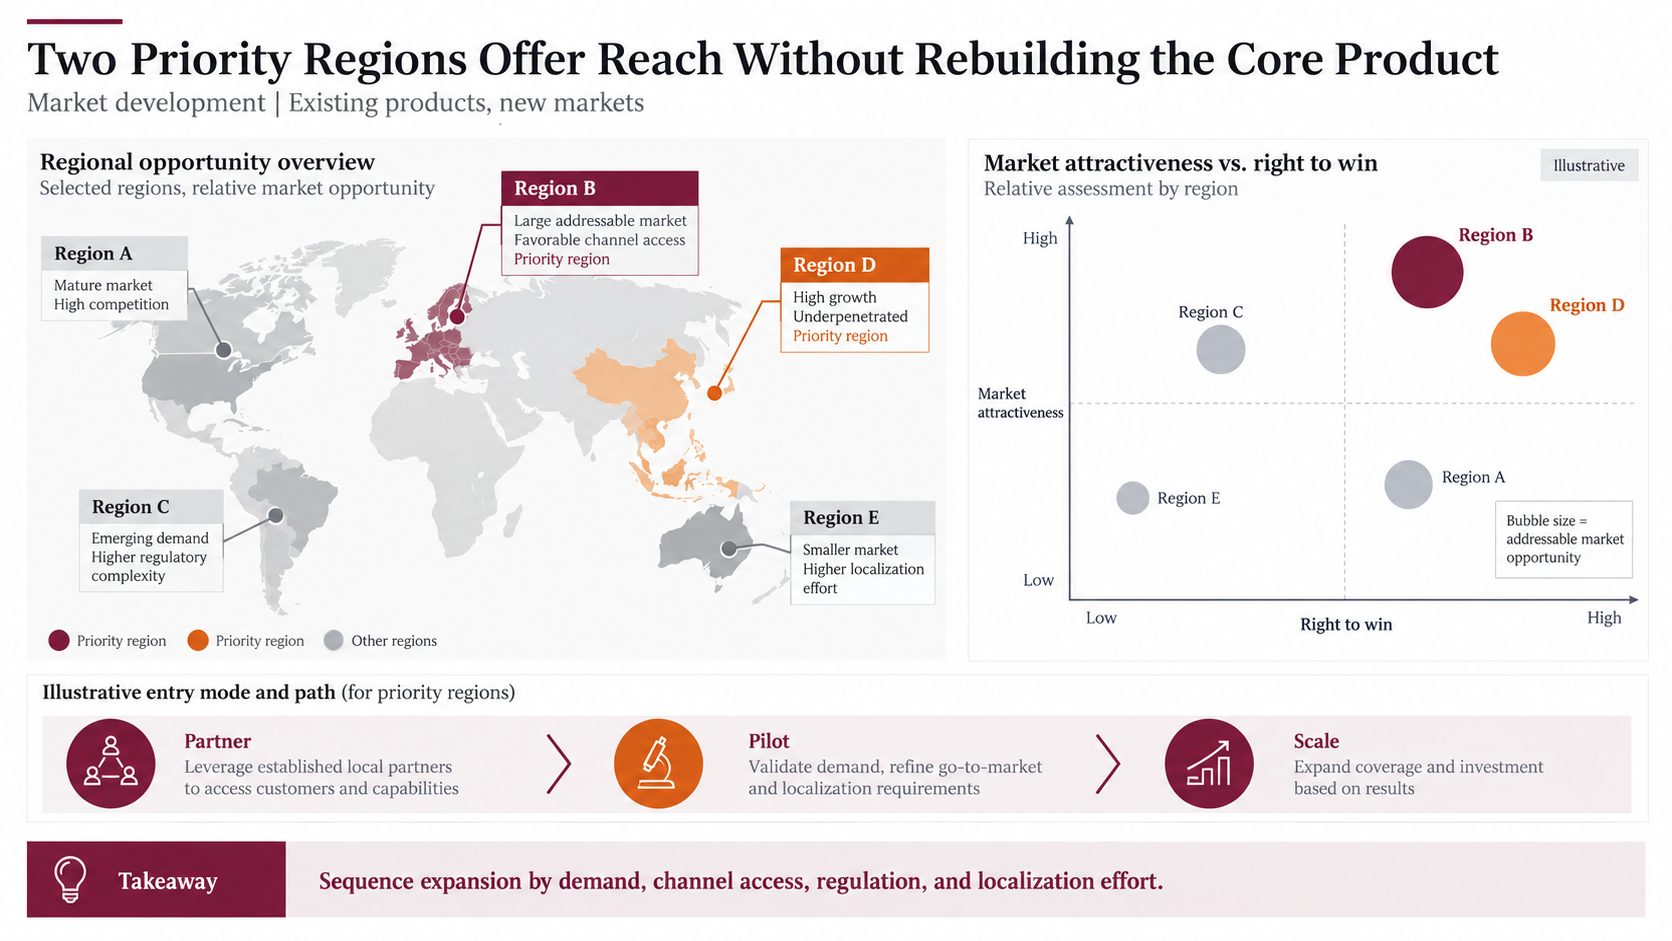
Evidence the page must carry
- Market sizing with the method disclosed: top-down from a published figure, bottom-up from unit economics, or both with the gap explained.
- Right-to-win inputs scored on the same scale as attractiveness, so the two axes are comparable.
- Localization cost as a real number, including product changes, support-language coverage, and compliance work, not a qualifying adjective.
- The regulatory gate, named. In several sectors the entry question is a licence timeline, and no amount of market attractiveness moves it.
Where this slide gets sent back
Market development pages are usually strong on the vertical axis and weak on the horizontal one: attractiveness is researched in detail, and right to win is assumed because the product already works at home. The diagnostic question a reviewer asks is "who is selling this in that market on day one?" If the answer is a hire that has not been made, the entry path needs a partner stage before a scale stage.
A second, quieter failure is assuming the buying process transfers. The same product can be a self-serve purchase in one country and a tendered procurement in another, which changes the unit economics more than pricing does.
Reusable AI Prompt for Market Development
Create one 16:9 market development slide for [company]. Compare these new markets or segments: [list]. Use only these verified inputs: [market size, growth, margin, competition, regulation, channel access, localization cost, sources]. Place a simple opportunity map on the left and a market attractiveness versus right-to-win matrix on the right. Highlight no more than two priority markets. Add a Partner, Pilot, Scale entry path and state the conditions required to move between stages. Use an action title with the recommendation, not a topic label. Mark any missing evidence as a gap. Do not fabricate data.
3. Product Development: Expand Value for Existing Customers
Product development introduces a new product, module, feature, or service to a market the company already serves. Use it when the customer relationship is an advantage but the current offer does not capture the full need or spending pool.
The question is whether a defined segment has an important unmet need and will pay for a solution the company can support. Evidence can include interviews, usage, willingness-to-pay tests, churn reasons, delivery cost, and adoption barriers.
A customer-needs heat map can identify the opportunity, while a phased roadmap makes funding conditional on evidence. A feature list alone is not a product strategy.
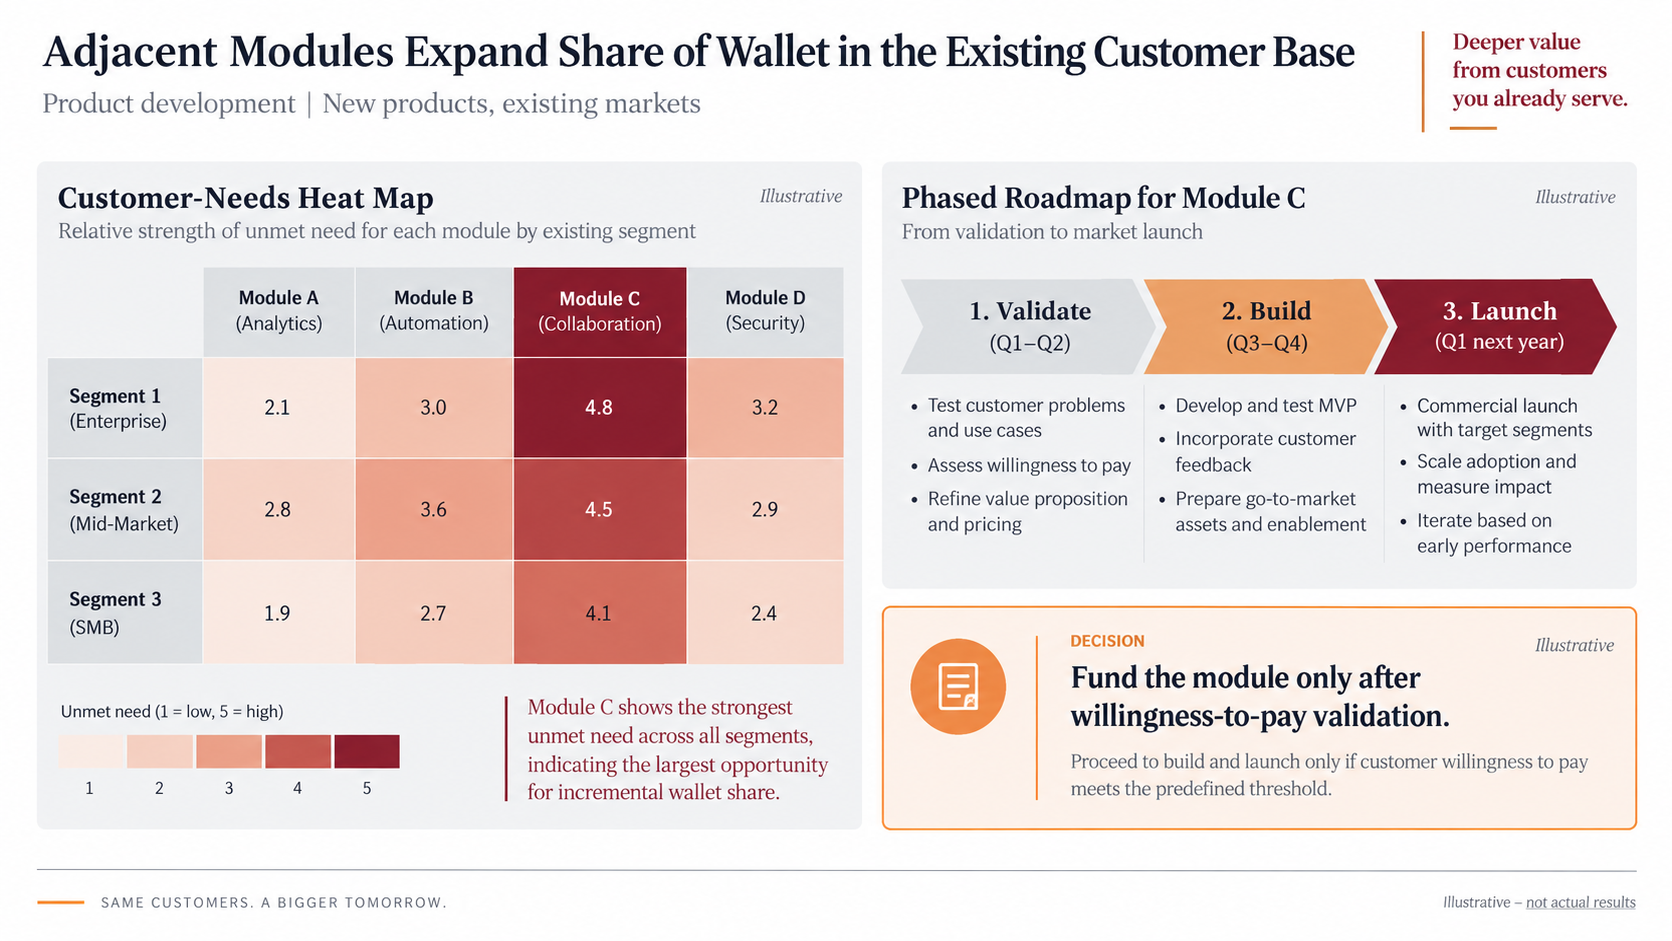
Evidence the page must carry
- Need intensity and willingness to pay as separate measurements. Customers routinely confirm a need and decline the price.
- Sample sizes on the heat map. "Eight of twelve enterprise accounts" is evidence; an unlabeled dark cell is decoration.
- Delivery cost per customer, because a module that raises support load can be revenue-positive and margin-negative.
- One measurable gate per roadmap stage, defined before the stage begins.
Where this slide gets sent back
The recurring failure is that the heat map is built from what the company can build rather than from what the customer said. A reviewer can spot this quickly: the hottest cells line up suspiciously well with the existing engineering roadmap. Build the map from research first, then overlay feasibility as a second layer, and the page becomes an argument instead of a confirmation.
Reusable AI Prompt for Product Development
Create one 16:9 product development slide for existing customers. Customer segments: [segments]. Candidate products or modules: [options]. Verified evidence: [research findings, usage, willingness to pay, delivery cost, sources]. Build a customer-needs heat map and identify the strongest evidence-backed opportunity. Add a three-stage roadmap covering Validate, Build, and Launch. Define one measurable gate for each stage. Use an action title that links customer need to the investment decision. Keep all wording concise, label illustrative values, and do not invent evidence.
4. Diversification: Enter New Markets With New Offers
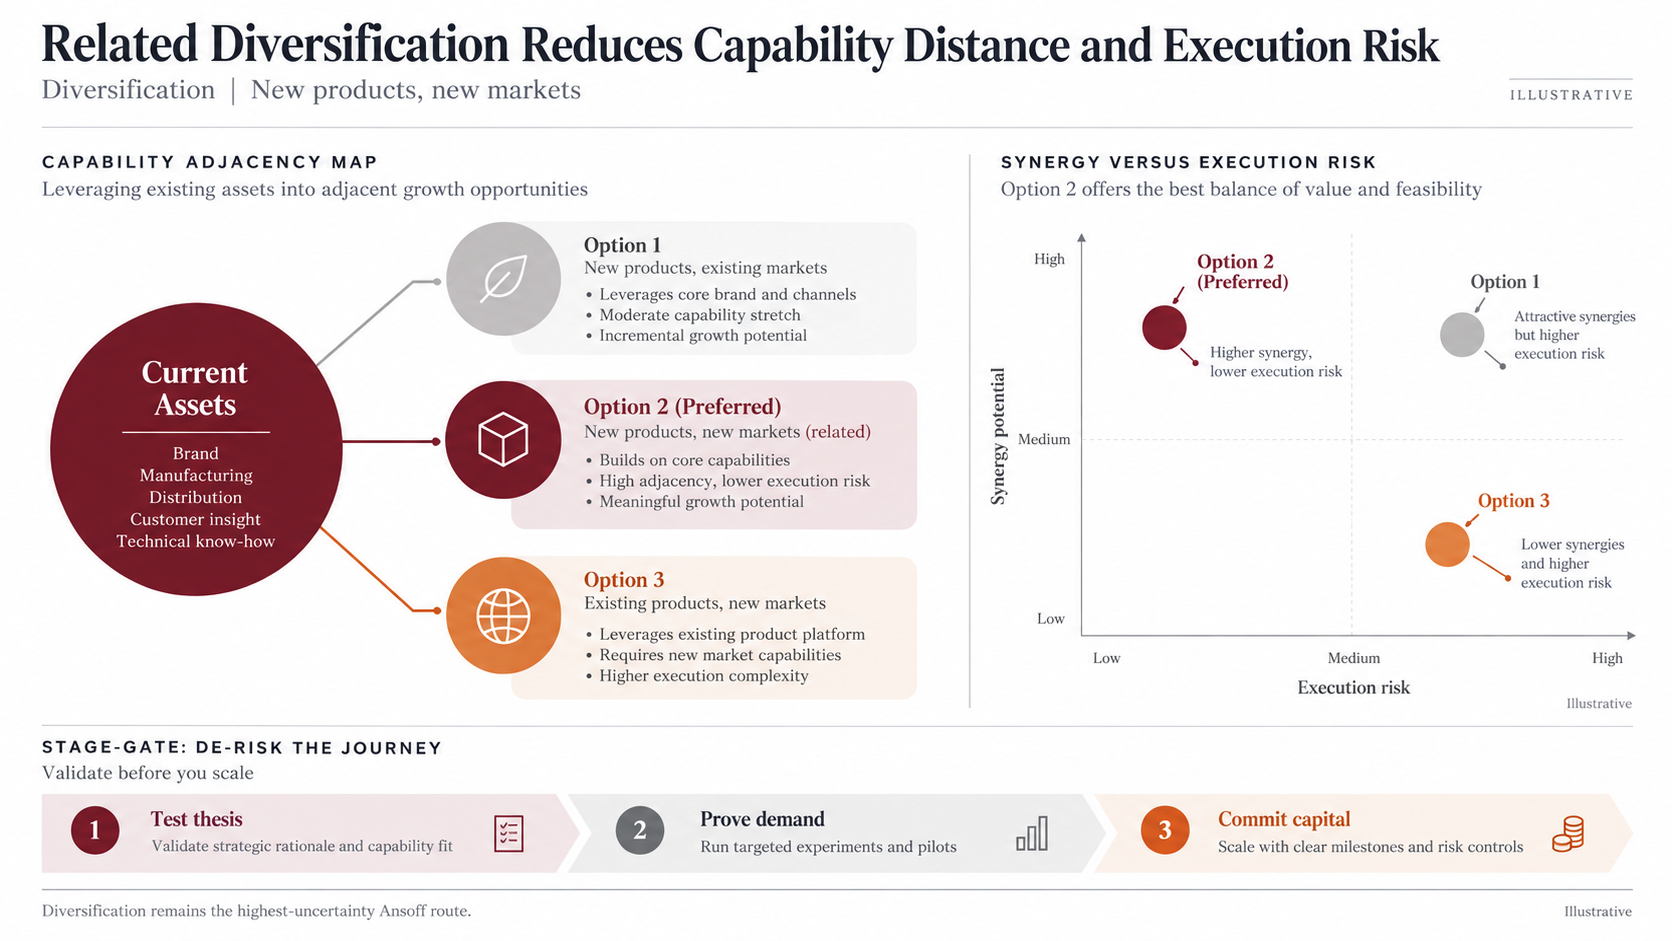
Diversification combines a new product with a new market. It can create a new growth engine, but it also reduces the value of existing knowledge. Teams may need unfamiliar technology, channels, customer insight, operating capabilities, or regulatory expertise at the same time.
A good diversification slide makes capability distance visible. Compare strategic fit, transferable assets, synergy, capital exposure, time to proof, and execution risk. Related diversification may reuse brand, data, distribution, manufacturing, or technical know-how.
Evidence the page must carry
- A named list of transferable assets, each with the evidence that it actually transfers. A brand is transferable in an adjacent category and often worthless two categories away.
- Capital exposure expressed as the maximum loss before the next gate, not as the total programme budget.
- Time to proof: how long before the organization knows whether the thesis holds.
- Stop conditions, written before commitment and owned by someone.
Where this slide gets sent back
Do not rely on market size alone. A large addressable market is the weakest argument on the page, because it is equally available to every competitor and says nothing about the company's specific right to participate. Test the thesis, prove demand with a limited experiment, and commit capital only when predefined evidence is met.
The organizational failure is subtler: diversification pages often understate the management attention required. If the same executive team that runs the core business is expected to run the new venture, say so on the page, because that constraint has ended more diversification programmes than capital ever has.
Reusable AI Prompt for Diversification
Create one 16:9 diversification decision slide. Current transferable assets: [brand, data, channels, technology, operations, customer insight]. New product and market options: [options]. Verified evidence and sources: [paste]. Map each option by capability adjacency, synergy potential, execution risk, capital required, and time to proof. Recommend an option only if the evidence supports it. Add three stage gates: Test thesis, Prove demand, Commit capital. State the stop conditions. Use an implication-led title, a restrained consulting palette, and clear source notes. Do not invent numbers or certainty.
Sequencing the Four Paths Instead of Choosing One
Most growth decks present the four quadrants as alternatives, then recommend one. Real portfolios run several at once, on different clocks and with different capital profiles, and a deck that shows this reads as more senior than one that does not.
A practical sequencing logic:
Fund the near term from penetration. It has the shortest feedback loop and the lowest capability requirement, which makes it the natural source of the cash and the credibility that later moves consume.
Run market development as the medium-term bet. It reuses the product, so the risk concentrates in go-to-market — a risk that can be staged through partners before any fixed cost is committed.
Treat product development as the retention insurance. It rarely produces the largest revenue number in year one, but it protects the base that everything else is calculated from.
Hold diversification to a strict evidence budget. One option, explicitly capped exposure, clear stop conditions. Two simultaneous diversification bets usually means neither gets the management attention it needs.
Showing this as a single portfolio page — four paths, four time horizons, four capital envelopes — is often the most useful slide in the entire deck, because it answers the question executives actually have: not "which one," but "how much of each, and when."
Move Beyond the Basic 2 by 2 Matrix
After choosing a quadrant, expand the analysis across customer need, product or technology change, and geographic scope. Then test four questions.
- What competitive advantage can the company build in the selected market?
- Which capabilities and resources transfer from the current business?
- Where can businesses share channels, data, operations, or technology?
- How much strategic flexibility remains if assumptions prove wrong?
This turns a workshop graphic into an investment logic: choice, evidence, trade-off, recommendation, and next test.
The last question deserves more room than it usually gets. Strategic flexibility is the difference between a commitment that can be unwound in two quarters and one that cannot be unwound at all. Where a growth path involves a long lease, an exclusive distribution agreement, or a regulatory registration, note the reversibility on the page. Reviewers who have seen an irreversible bet go wrong will look for it.
Build and Reformat the Deck Faster With Tosea AI
Tosea AI separates presentation creation into stages. At the outline stage, you can review the narrative and choose a layout or diagram for each section, including a matrix, waterfall, heat map, roadmap, or prioritization chart.
After rendering, you can still change the layout or diagram. If wording is approved, use Layout Only to refresh visual structure without intentionally rewriting content.
A practical workflow is:
- Upload source documents, research, or an existing deck exported as PDF.
- Define the audience, decision, scope, and evidence boundaries.
- Review the outline and assign the best layout or diagram to each message.
- Generate the slides and revise the action titles first.
- Change layouts or diagrams after rendering when a page is too dense.
- Export an editable PPTX and test it in the delivery environment.
This reduces formatting work and leaves more time for evidence, implications, and decision preparation. For designers who want to keep manual control over the visual system while speeding up structure, see the AI presentation workflow for PPT designers.
Frequently Asked Questions
Is the Ansoff Matrix still relevant for modern growth strategy?
The four-way product-market split remains a clean way to separate growth options that require fundamentally different evidence and carry different risk. What has dated is the implication that risk rises smoothly from penetration to diversification. In practice a saturated core market can make penetration the riskiest path available, and a closely adjacent diversification can be safer than a distant geographic expansion. Use the quadrants to organize the analysis, not to rank the risk automatically.
How many quadrants should one deck cover?
One quadrant per decision page, and one portfolio page showing how the paths sequence together. A deck that analyzes all four in equal depth usually indicates the decision has not been framed yet.
What is the difference between the Ansoff Matrix and the Growth-Share Matrix?
Ansoff asks where growth should come from; the Growth-Share Matrix asks how capital should be distributed across a portfolio you already own. They answer different questions and frequently appear in the same deck, one after the other. The BCG strategy framework guide covers the portfolio side in detail.
Can Tosea AI redesign my existing PowerPoint without changing the content?
Yes. Export the PowerPoint as a PDF, upload it to Tosea AI, and request a redesign that preserves the original wording. Use Layout Only when the goal is to refresh visual structure without rewriting content. Confirm that labels, footnotes, citations, and slide elements remain complete.
How do I upload a PowerPoint and ask Tosea AI to redesign each slide?
Export the PowerPoint as a PDF, upload the PDF, and explain that every slide should be redesigned while preserving its content and sequence. Choose a template or describe the visual direction, generate the deck, inspect each slide, and then export the revised presentation.
Can I upload my own PowerPoint template to Tosea AI?
Tosea AI supports custom templates on eligible paid plans. Configure the template through the available product workflow, then verify layouts, fonts, colors, logo placement, and master-slide rules before sharing the result.
Can Tosea AI use custom brand colors, fonts, and a logo?
Yes. Specify brand colors and fonts in the instructions, and upload the logo or use a supported custom template. Custom logo and template features are available on eligible plans. Check font availability, exact colors, logo spacing, and contrast after export.
Can Tosea AI match the style of my old company presentations?
Tosea AI can use a representative deck as design guidance, but this should not be described as permanent model training. For stronger consistency, use an approved template containing the company layouts, colors, fonts, and logo, then compare the output with the brand guidelines.
Does Tosea AI preserve PowerPoint formatting after export?
Editable PPTX export is designed to stay close to the generated preview while keeping elements available for further editing. Results may vary with fonts, complex graphics, and the application used to open the file. Test the deck in the exact PowerPoint environment used for delivery.
Can I tell AI to edit the layout only and keep the exact wording?
Yes. Layout Only changes visual structure without intentionally rewriting slide content. It is useful after wording has been approved. Compare the new slide with the source to confirm that labels, citations, footnotes, and line breaks remain correct.
Turn Growth Logic Into a Decision-Ready Deck
The Ansoff Matrix becomes useful when each quadrant leads to a different evidence plan, risk discussion, and management decision. The quadrant is the cheap part; the evidence standard behind it is what makes the recommendation survive a room full of people whose capital is at stake.
With Tosea AI, you can shape that logic in the outline, choose the right diagram, refine layouts after rendering, and export an editable PowerPoint for final review. Start your next strategy presentation at Tosea AI. For related guidance, read five advanced PwC-style strategy frameworks, eight organization and innovation models, and the McKinsey-style 3C strategy deck guide.
Sources
- Strategies for Diversification — academic discussion of Ansoff's original framework — North-West University research repository
- ICAN 2025 Study Text: Corporate Strategy — Institute of Chartered Accountants of Nigeria
- PwC — for reference to the consulting house style discussed in this series