How to Make a PwC-Style PowerPoint with AI: 8 Organization and Innovation Models
Eight organization, brand, and innovation models for a PwC-style deck: Human Capital Index, Five Factors of Change, positioning maps, Parenting Advantage, Lotus Innovation, and more.
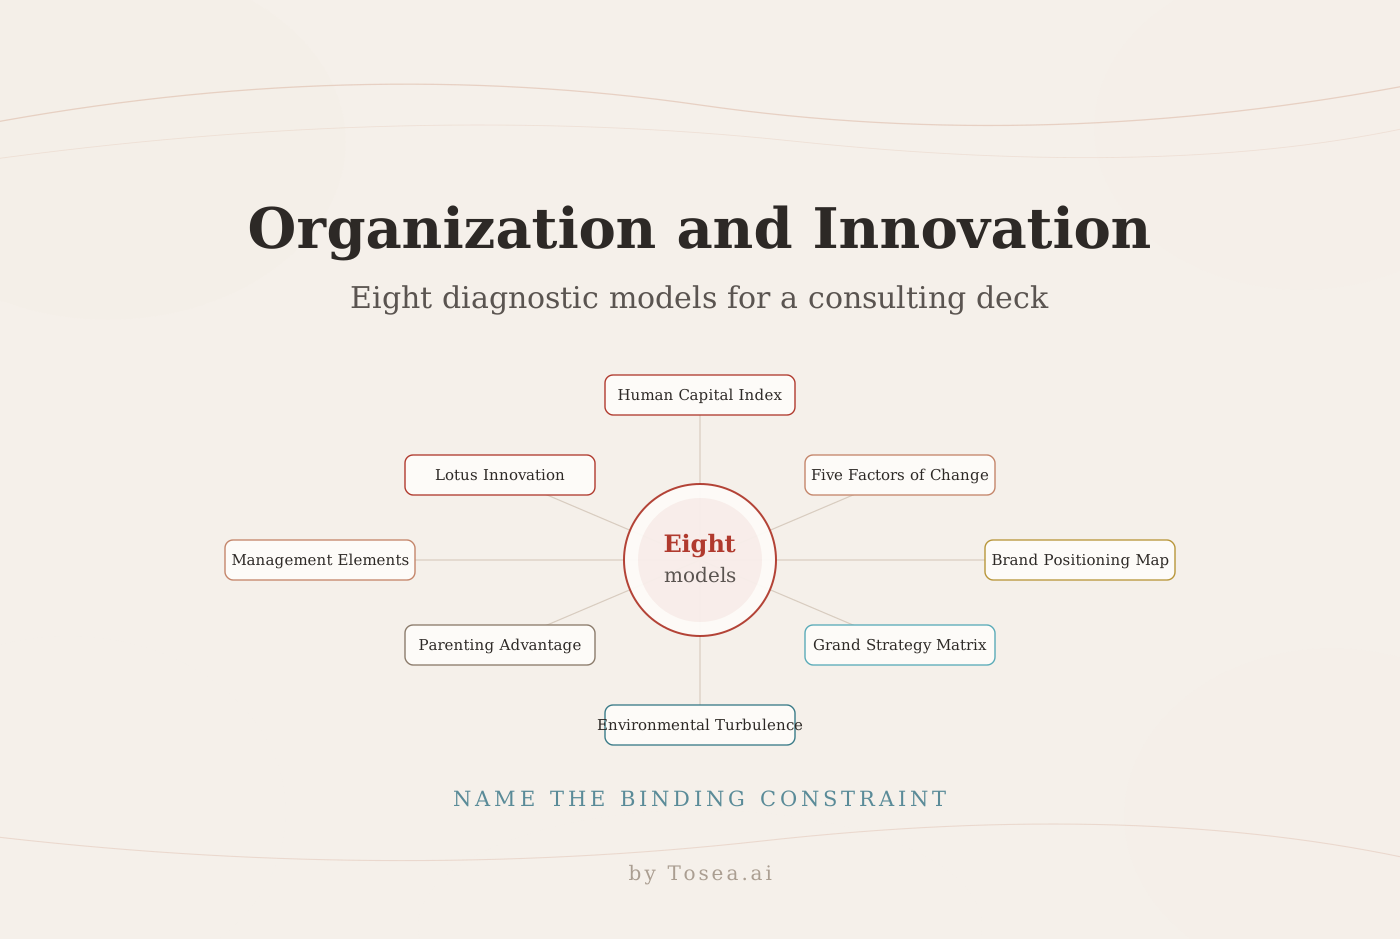
A PwC-style PowerPoint with AI should do more than look polished. It should turn an ambiguous business question into a clear answer, show the evidence behind that answer, and make the next decision easier. This guide covers eight models that answer a class of question the earlier guides in this series did not: not where the money goes, but whether the organization behind the strategy can actually deliver it — people, transformation, brand, corporate structure, operating model, and innovation.
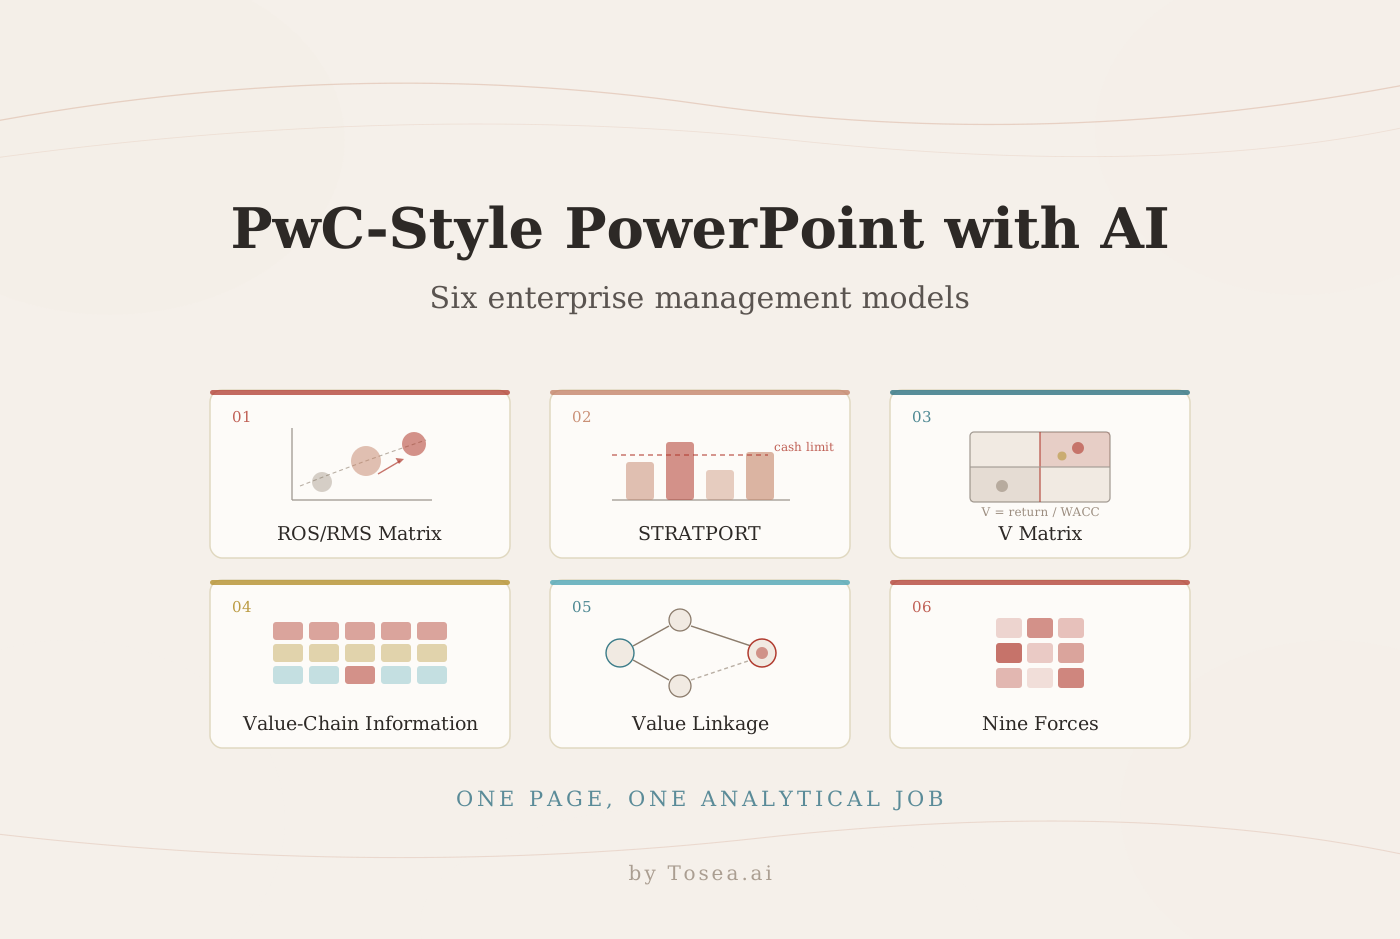
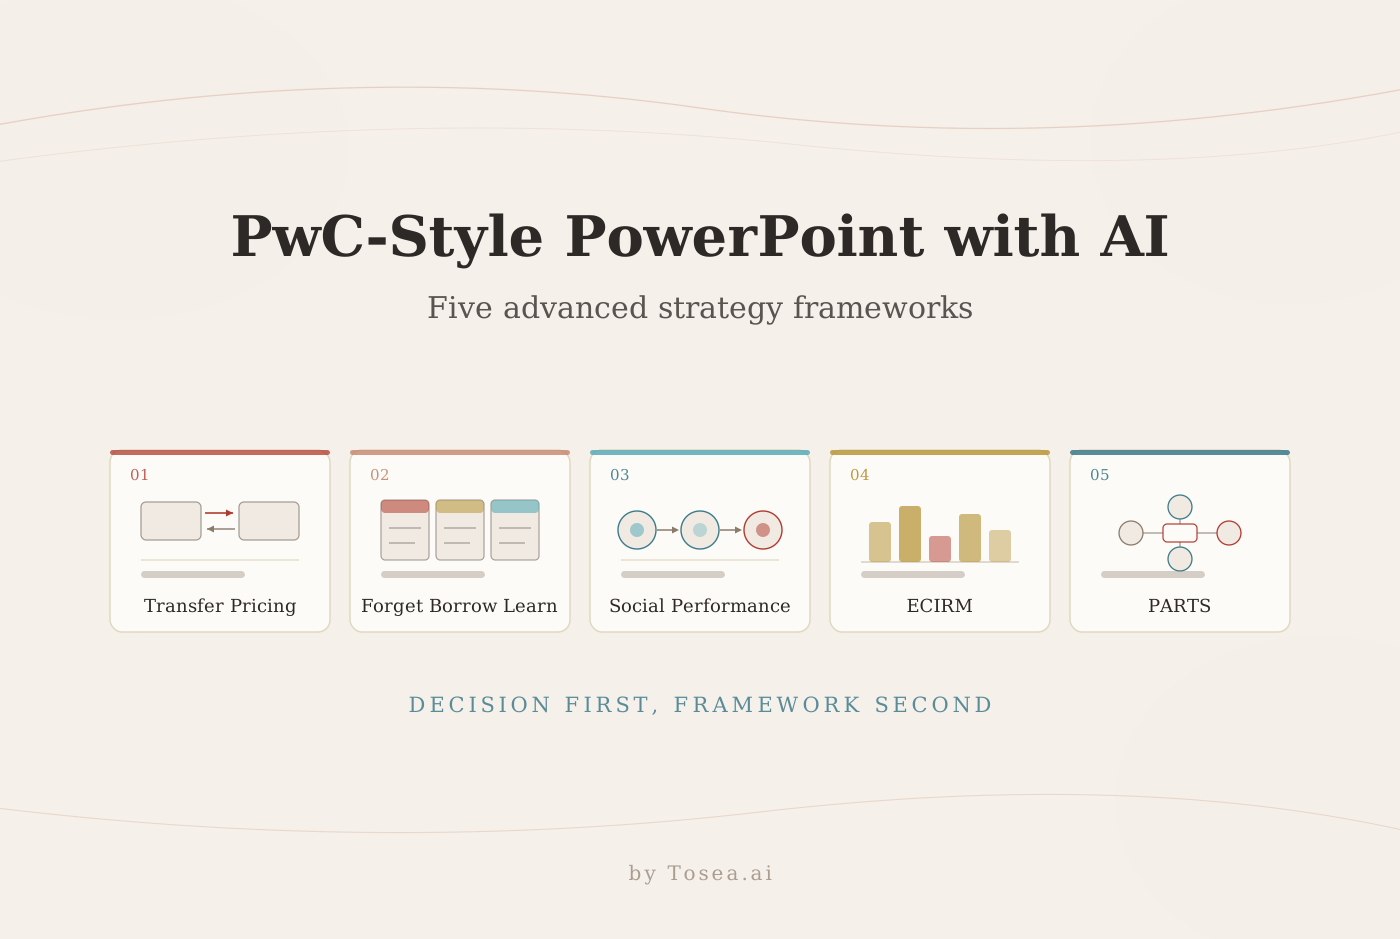
This is the fourth guide in the series. The PwC-style consulting deck guide covers the page system and seven commercial frameworks, five advanced strategy frameworks handles transfer pricing and corporate venturing, and six enterprise management models covers portfolio allocation, hurdle rates, and capability constraints. Each section below includes a practical slide format, the evidence the page must carry, the failure mode that gets it sent back, and a prompt you can reuse in Tosea AI.
The examples are original consulting-style illustrations with restrained color, answer-first titles, and clean grids. They are not PwC templates and do not imply an affiliation with PwC.
Quick Answer
Choose the model that matches the organizational question — human capital for people economics, Five Factors for stalled transformation, positioning maps for brand competition, Grand Strategy for direction, turbulence for planning cadence, Parenting Advantage for corporate structure, Management Elements for execution gaps, and Lotus Innovation for ecosystem innovation. Then replace every generic label with company evidence, dates, sources, and owners. Tosea AI lets you choose the exhibit at the outline stage and change it again after rendering.
What makes a consulting slide feel professional
Weak slides start with a topic. Strong consulting slides start with a conclusion. Use one answer-first headline, one primary exhibit, and two or three implications. Keep the palette narrow, align objects to a grid, and remove decoration. An executive should understand the main message within five seconds.
Organizational models carry a specific risk that commercial frameworks do not. A market-sizing slide can be checked against an external source; an "alignment" or "capability" score usually cannot. That makes disclosure the whole game. Whenever a page rates something soft, it has to say who rated it, against what anchors, and from what evidence — otherwise the exhibit is an opinion in the shape of a chart.
Choosing among the eight
| Model | The question it answers | Reach for it when |
|---|---|---|
| Human Capital Index | Do our people practices connect to business outcomes? | An HR investment case needs a financial argument |
| Five Factors of Change | Why has this transformation stalled? | Programme milestones slip without an obvious cause |
| Brand Positioning Map | How do customers see us against alternatives? | A repositioning or pricing decision is on the table |
| Grand Strategy Matrix | Which strategic direction fits our position? | Growth and competitive strength point different ways |
| Environmental Turbulence | Is our planning cadence matched to the market? | An annual plan keeps being overtaken by events |
| Parenting Advantage | Should the group own this business at all? | A portfolio review, divestment, or restructuring |
| Management Elements | Why is an approved strategy not executing? | Strategy is agreed but delivery is slow |
| Lotus Innovation | Where does innovation value actually come from? | Internal R&D is not producing ecosystem outcomes |
1. Watson Wyatt Human Capital Index
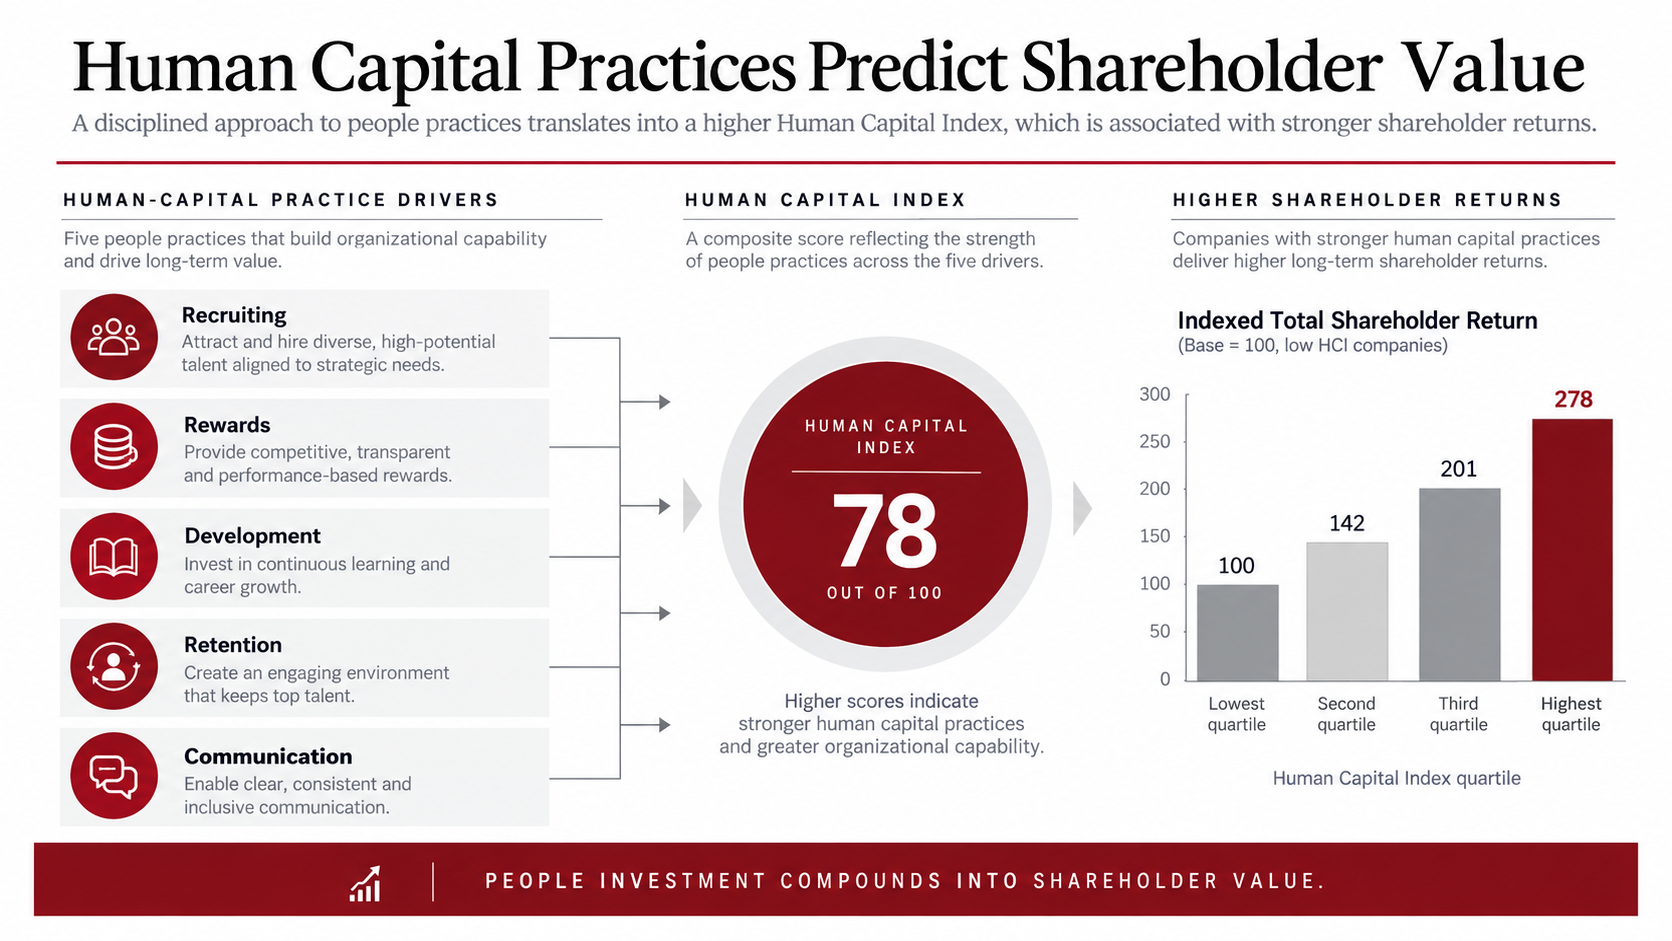
Watson Wyatt Worldwide developed the Human Capital Index to examine the relationship between human-capital practices and shareholder value. The original study reported an association, not proof that one HR practice directly causes a particular return. That distinction matters. Use the model to connect recruiting, rewards, development, retention, and communication with business outcomes, then label assumptions and data sources clearly. The original Human Capital Index report provides useful background.
Evidence the page must carry
- The practice scores and their source: an employee survey, an HR systems extract, or an external benchmark, each with a date and a sample.
- The outcome measure, defined precisely. "Shareholder return" needs a period, a peer set, and a starting index date.
- An explicit statement of the relationship claimed. Association is defensible with this evidence; causation usually is not.
Where this slide gets sent back
The page fails when the arrow between practices and returns is drawn as if it were a mechanism. A CFO will ask, reasonably, whether high-performing companies can simply afford better HR practices — the reverse of the implied direction. Acknowledge the direction problem on the page in one line, and the rest of the argument survives. Hide it, and the whole exhibit is discounted.
Reusable PPT prompt
Create a 16:9 consulting slide with an answer-first headline. Show five human-capital practice drivers flowing into a Human Capital Index, then connect the index to an indexed shareholder-return chart. Use only supplied data, label correlation carefully, and add three management implications.
2. Five Factors of Change
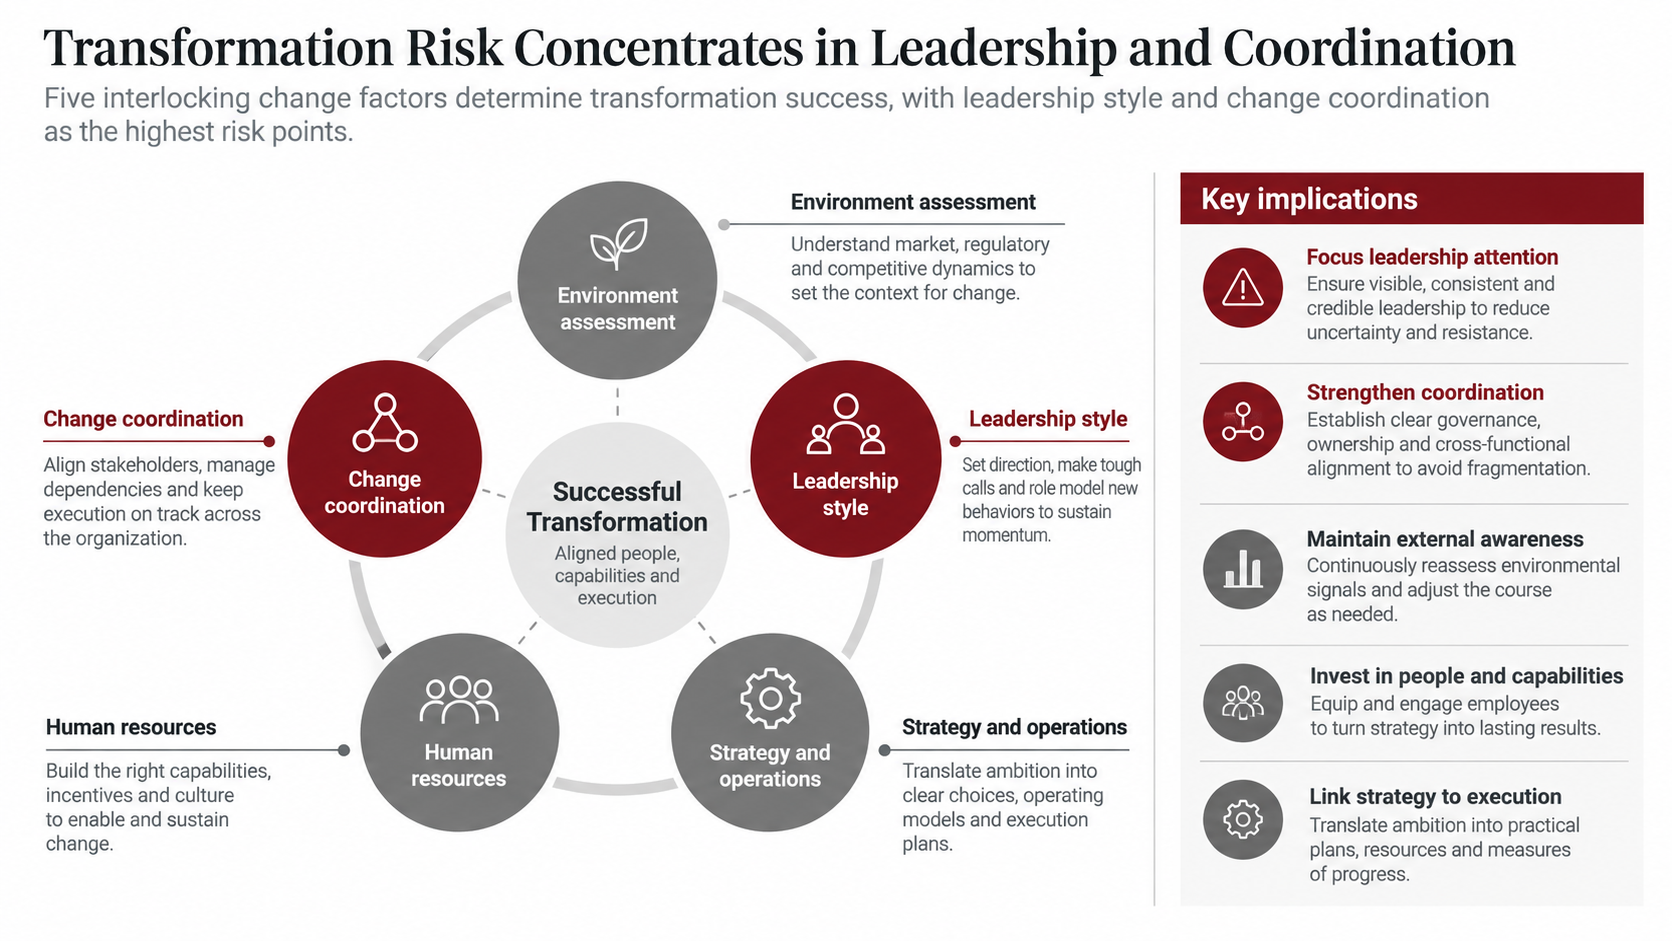
This change diagnostic reviews environment, leadership, strategy and operations, human resources, and coordination. Use it when a transformation is stalling and the team must identify whether the problem is direction, capability, incentives, or execution. Score each factor from 1 to 5, cite evidence, and highlight the two main constraints.
Evidence the page must carry
- Scoring anchors written out. A 2 on leadership has to mean something specific, such as "sponsor has not communicated the change in the last quarter."
- Evidence under each factor: an interview count, a survey result, a milestone-slip statistic, a turnover number.
- Named owners for the two constraints, with a next action and a date.
Where this slide gets sent back
Diagnostics are politically sensitive in a way that market analysis is not, because the factors map onto people in the room. The page fails when it softens the two real constraints into five moderate ones — everything scores a 3, nothing is the problem, and the meeting ends without a decision. If the evidence says leadership sponsorship is the constraint, the page has to say so and carry the evidence to support it.
Reusable PPT prompt
Build a 16:9 change diagnostic slide using five connected circles: environment, leadership, strategy and operations, human resources, and coordination. Highlight the two highest-risk factors in burgundy. Add evidence under each factor and a right-hand panel with owners and next actions.
3. Brand Positioning Map
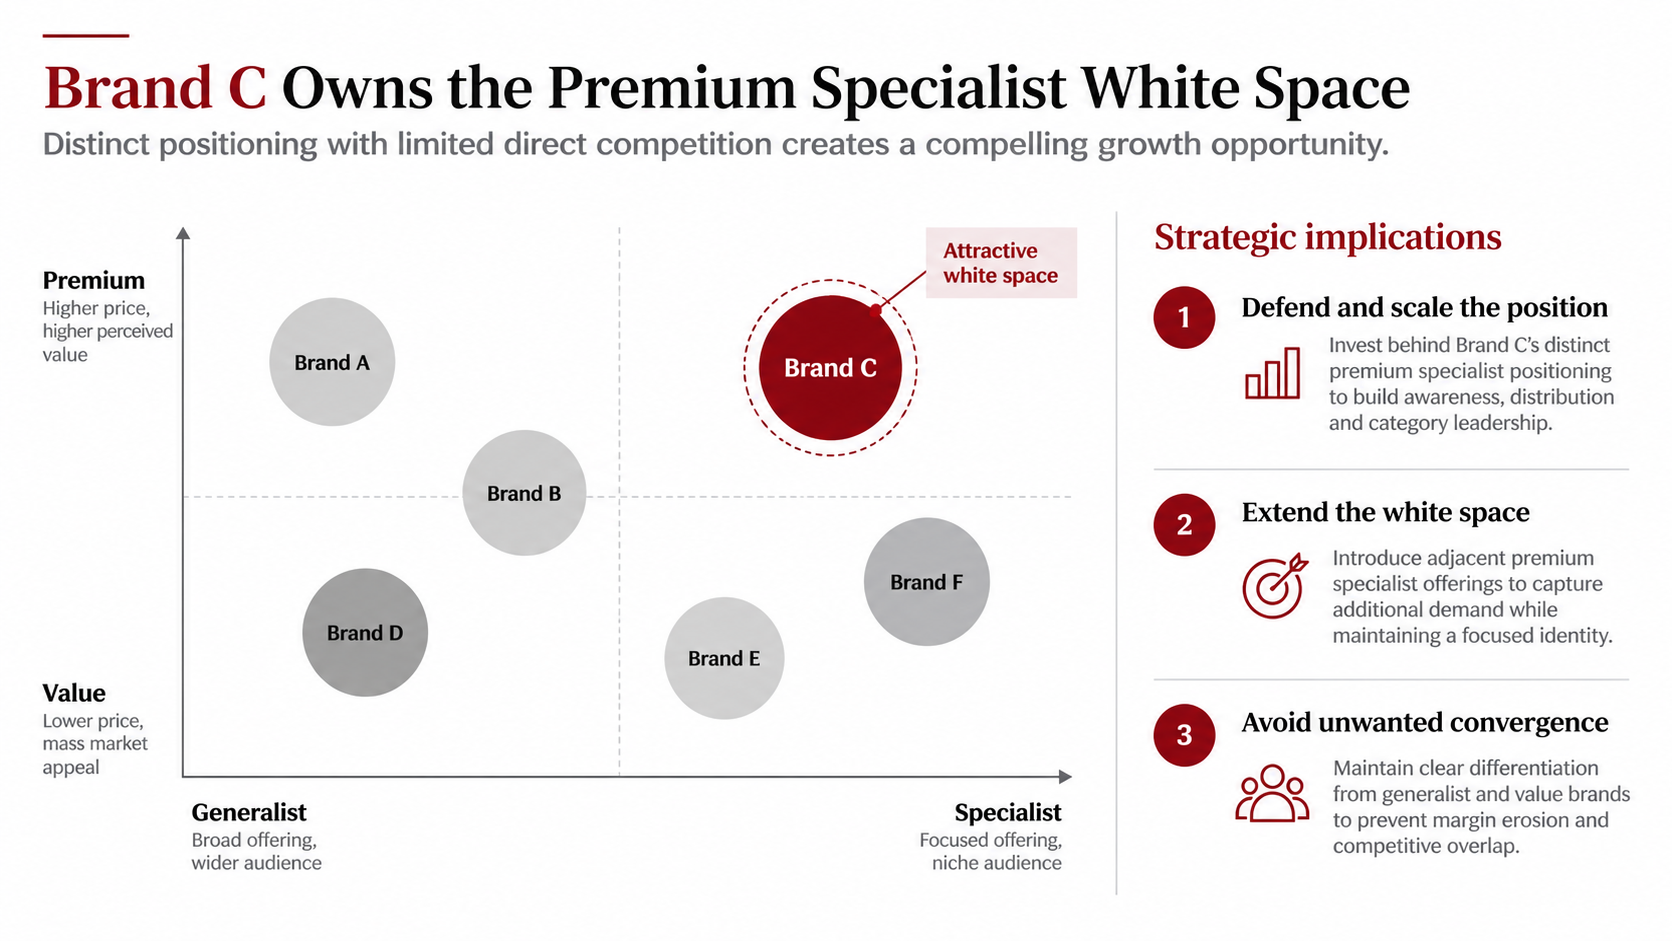
A brand positioning map compares how customers perceive competing brands on two decision-relevant dimensions. Unlike a broad SWOT or 3C analysis, it concentrates on competitive position. Choose axes from customer research rather than internal preference. Price, specialization, convenience, trust, and innovation can work, but only when the data supports them. Bubble size can represent revenue, awareness, or consideration. An empty area is a hypothesis, not automatic proof of demand.
Evidence the page must carry
- Axes derived from customer research, with the research named. Axes chosen internally tend to place the company favorably by construction.
- Perceived position, not actual position. The map is about what customers believe, which is frequently out of date relative to the product.
- Bubble metric and its source in the legend.
- Sample size and survey date, because brand perception moves.
Where this slide gets sent back
The white space trap. An empty quadrant looks like an opportunity and is very often an area where no one has found a viable business. Before recommending a move into white space, the page should state why the space is empty: nobody has tried, everyone who tried failed, or the segment is too small to support an entrant. Any of those three is an acceptable answer. Silence is not.
Reusable PPT prompt
Create a 16:9 brand positioning map from the supplied customer data. Plot six brands on Premium versus Value and Specialist versus Generalist axes. Size bubbles by market share, highlight our brand, identify one credible white space, and state three strategic implications without inventing data.
4. Grand Strategy Matrix
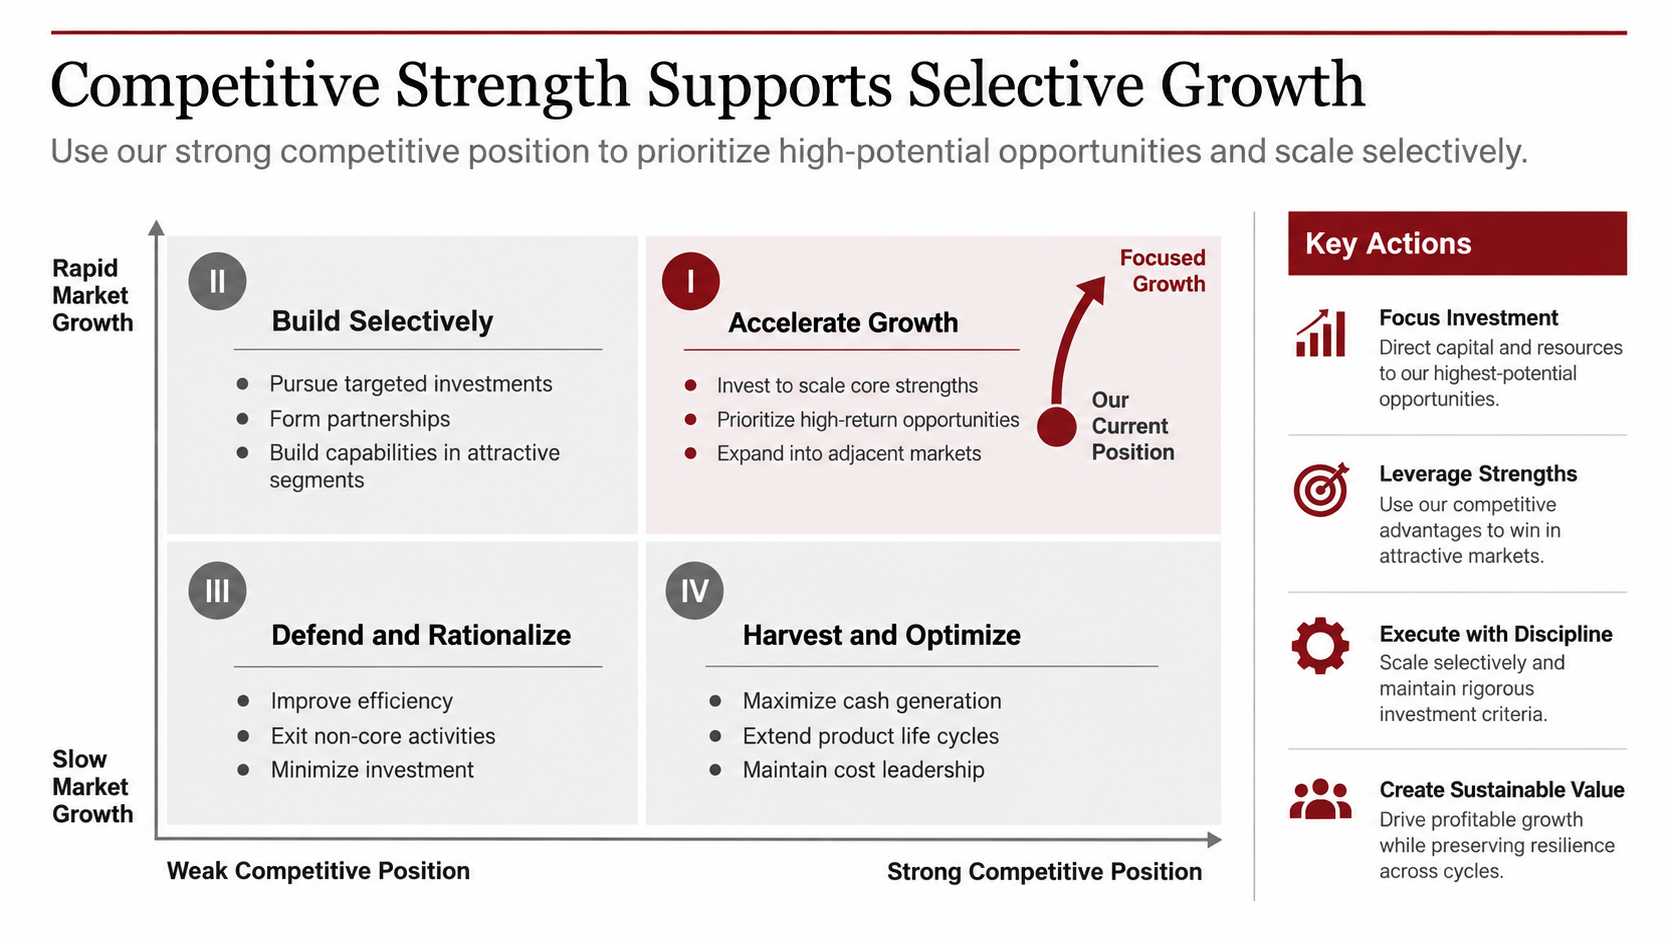
The Grand Strategy Matrix organizes options by market growth and competitive position. Its four quadrants indicate when to accelerate growth, build selectively, defend, or harvest. Define growth with a period and source. Measure competitive strength through factors such as share, relative cost, differentiation, channel access, and capability.
Evidence the page must carry
- Competitive position as a composite with the components and weights shown, not as a single unexplained rating.
- Market growth with a period, a geography, and a source.
- One recommended direction, three actions, two risks, and the decision being requested.
Where this slide gets sent back
The Grand Strategy Matrix produces four plausible-sounding directions for every position, which makes it easy to write a page that recommends nothing in particular. Commit. If the analysis places the business in the strong-position, slow-growth quadrant, the page should recommend either selective investment or harvest and defend the choice — not list both as options and leave the decision to the audience. Listing options is what an appendix is for.
Reusable PPT prompt
Design a 16:9 Grand Strategy Matrix. Use market growth on the vertical axis and competitive position on the horizontal axis. Place the business using supplied evidence, label four strategic zones, show one recommended direction, and list three actions, two risks, and one decision required.
5. Ansoff Environmental Turbulence Model
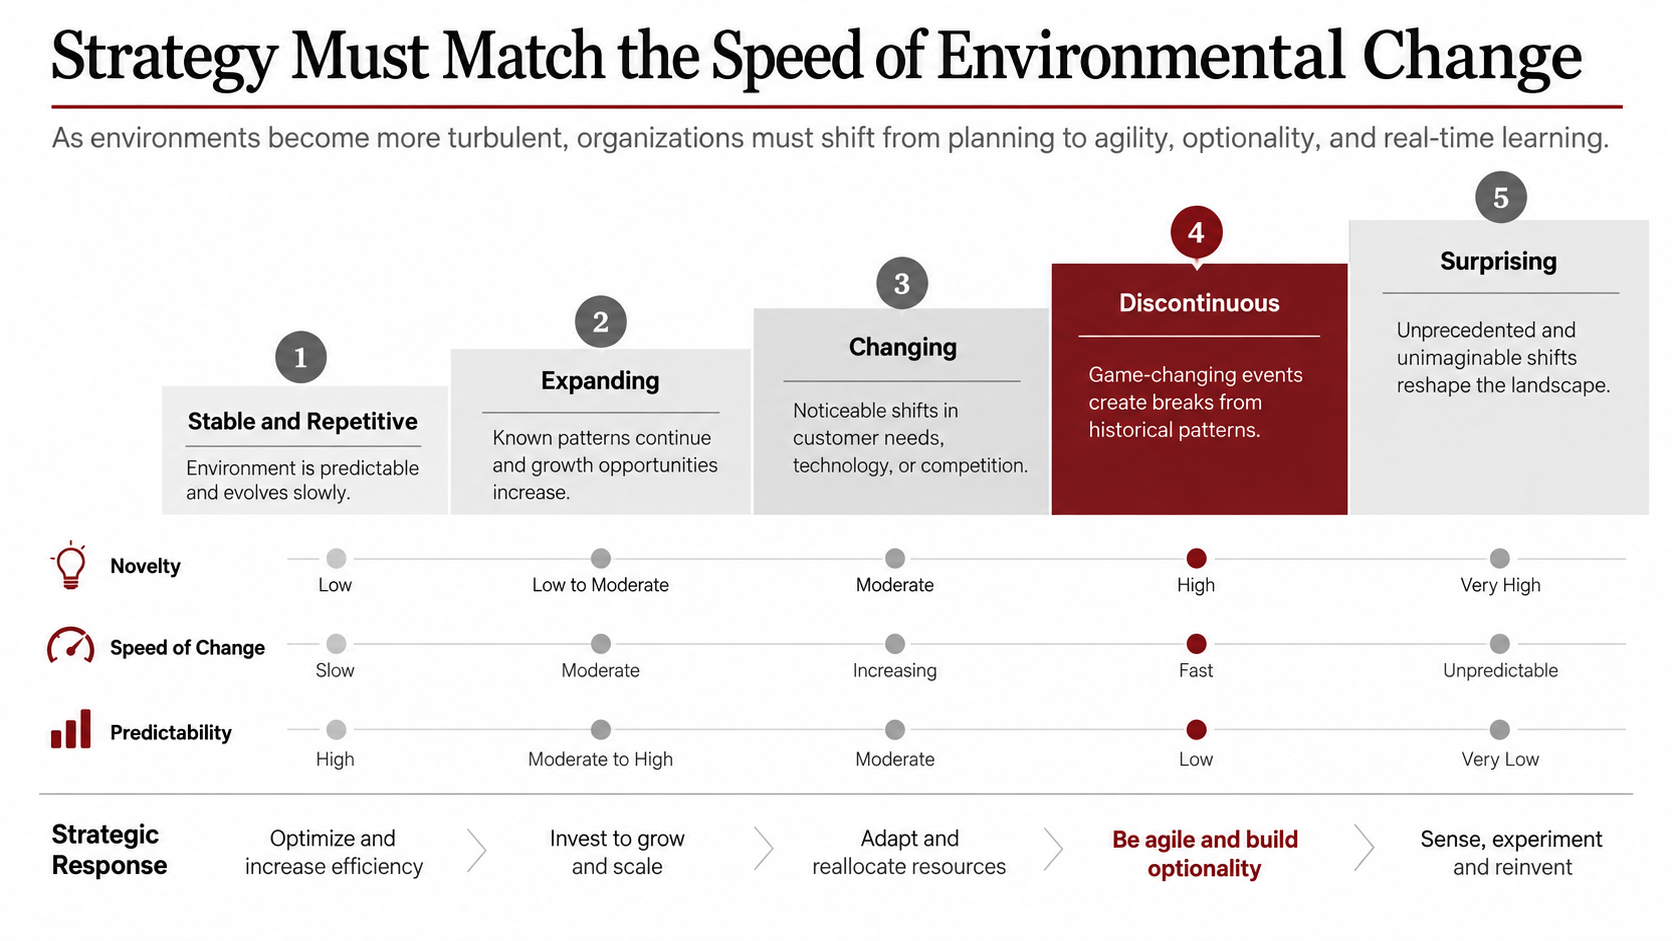
Igor Ansoff used environmental turbulence to help leaders match strategic behavior to the novelty, speed, and predictability of change. A stable environment rewards efficiency and planning. A discontinuous environment requires sensing, experimentation, options, and faster resource reallocation. The model is valuable because it prevents a common mistake: applying a slow annual-planning process to a market that is moving every month. This Ansoff strategy reference explains the connection between turbulence and strategic behavior.
Evidence the page must carry
- Observable indicators for the assessed level: rate of new entrants, product lifecycle length, regulatory change frequency, forecast error over the last few cycles.
- The current planning cadence, stated plainly, so the mismatch is visible rather than implied.
- Three signals that would trigger a reassessment, with who watches them.
Where this slide gets sent back
Forecast error is the strongest available evidence for turbulence and is almost always omitted, because it is uncomfortable. If the last three annual plans missed by a wide margin, that single fact makes the argument better than any qualitative description of market dynamics. Pull it from the planning cycle and put it on the page.
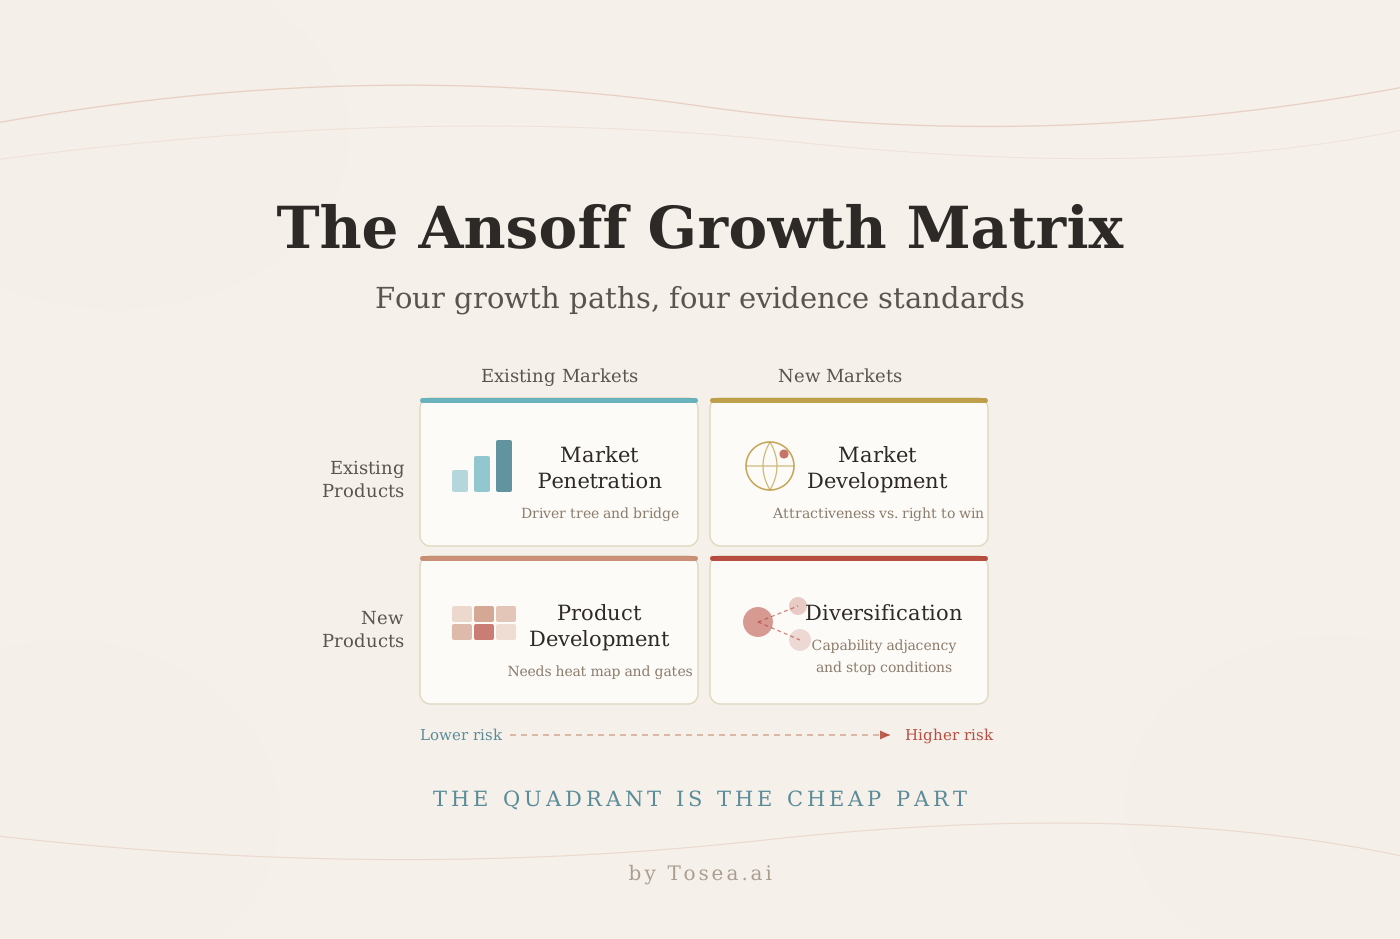
For a related growth-planning framework by the same author, see the Ansoff Matrix growth deck guide.
Reusable PPT prompt
Create a five-level environmental turbulence staircase for a 16:9 strategy slide. Assess novelty, speed of change, and predictability at each level. Mark the current level, match it with the appropriate strategic response, and include three observable signals that would trigger a reassessment.
6. Parenting Advantage
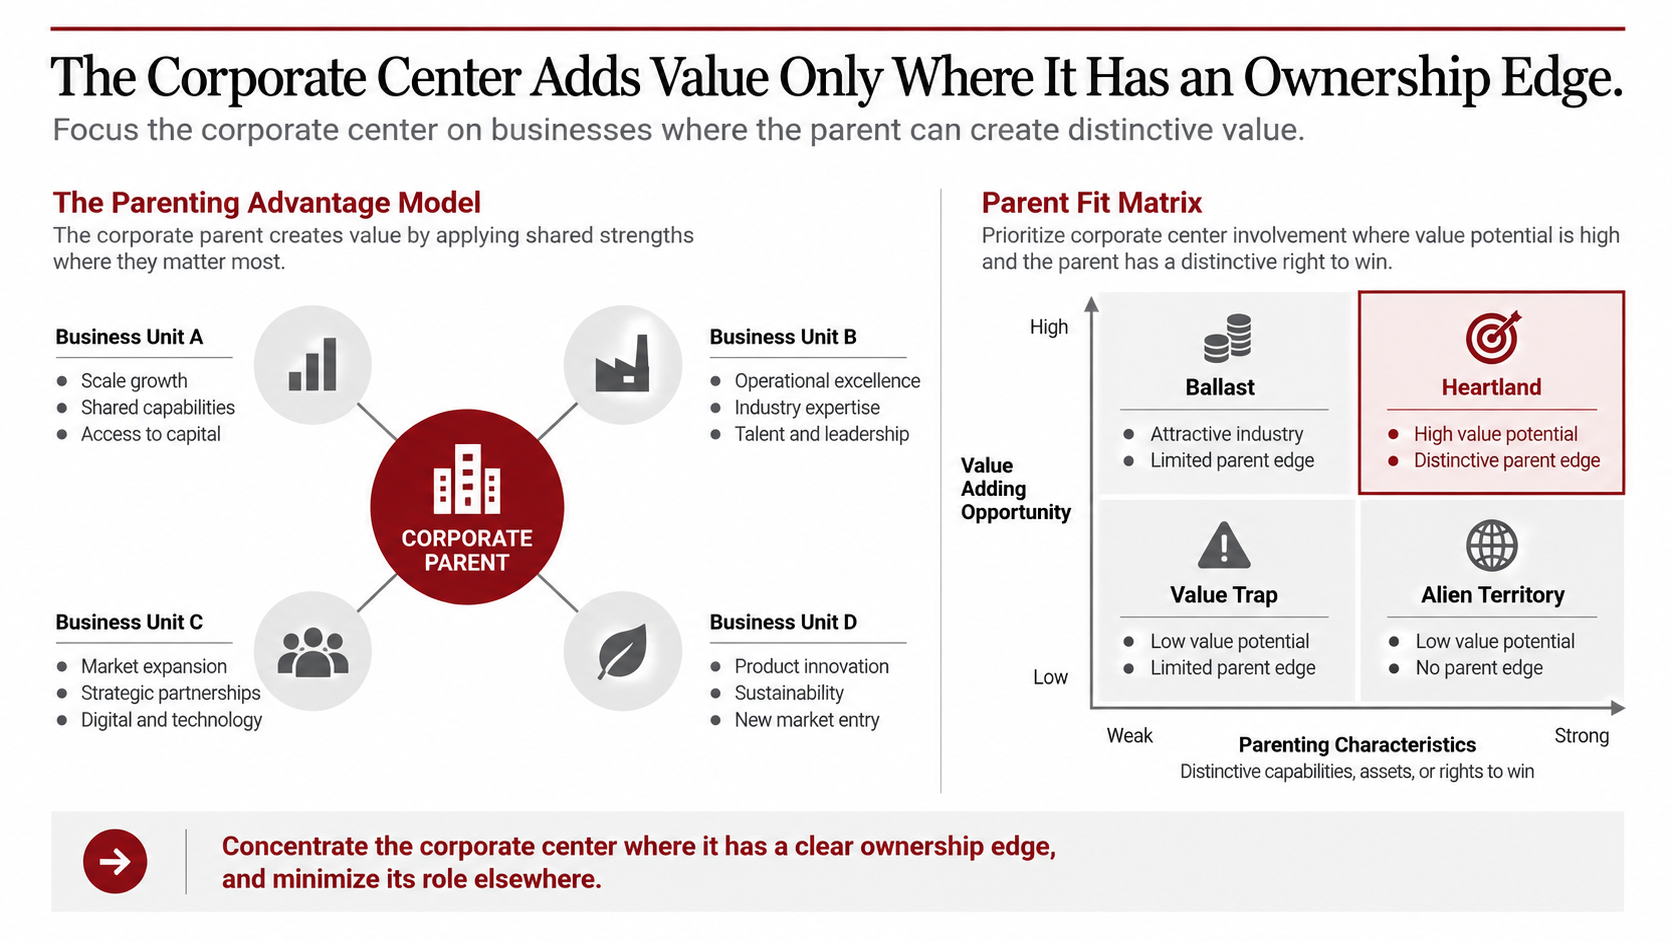
Parenting Advantage asks a disciplined corporate-strategy question: can the parent company create more value from a business than another owner could? The corporate center may add value through talent, capital allocation, shared capabilities, governance, technology, or market access. It can also destroy value through complexity and inappropriate intervention. Map each business by value-creation opportunity and fit with the parent. The Harvard Business Review article on Parenting Advantage is the foundational reading.
Evidence the page must carry
- The specific parenting mechanism per business: what the center actually does that another owner would not.
- The cost of the center, allocated. Group functions are rarely free to the units.
- An honest estimate of the alternative owner. "Would a focused private-equity owner run this better?" is the test the framework exists to apply.
Where this slide gets sent back
Parenting Advantage is the framework most likely to be softened by the people presenting it, because the corporate center is usually in the room and the honest answer is sometimes "no." A page that places every business in the heartland quadrant has not run the analysis; it has documented a preference. Where a business is a genuine value trap, saying so — with the mechanism and the number — is the entire value of the exercise.
Reusable PPT prompt
Build a 16:9 Parenting Advantage slide. Show the corporate parent connected to four business units and plot each unit on a parent-fit matrix. Label heartland, ballast, value trap, and alien territory. Recommend where the center should intervene, enable, monitor, or step back.
7. Management Elements Analysis Model
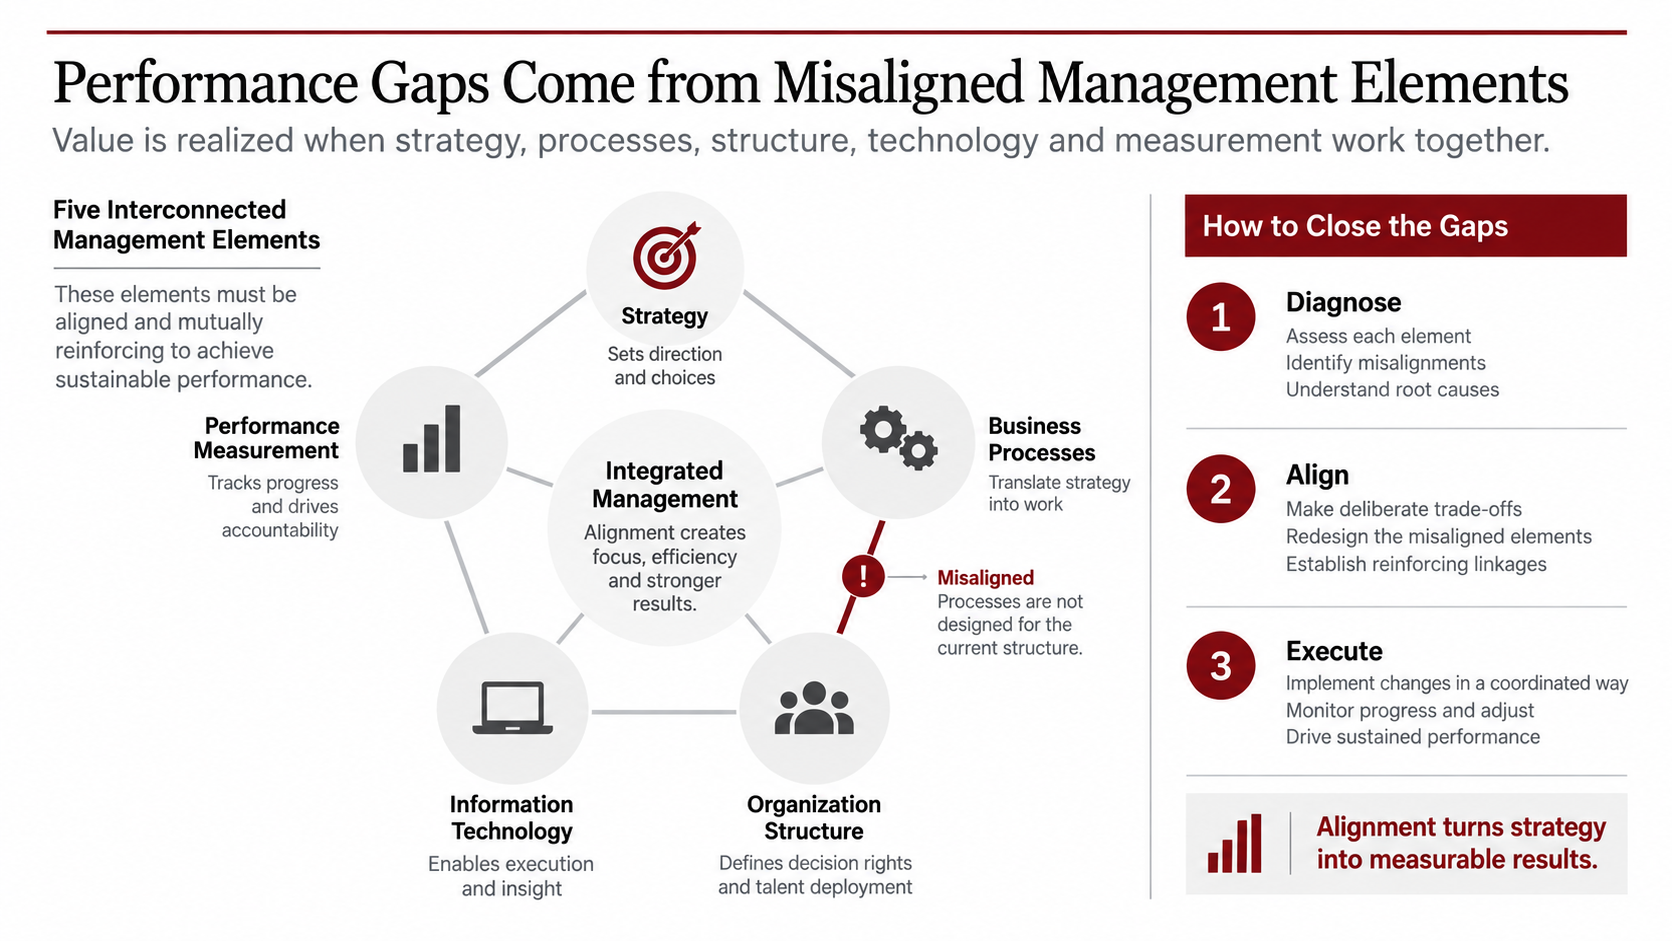
This diagnostic examines alignment among strategy, processes, organization, technology, and performance measurement. Use it when a new strategy is approved but execution remains slow. Test whether processes deliver the strategy, decision rights support the processes, technology enables the workflow, and metrics reinforce the intended behavior. Focus on the misalignments causing the largest gap.
Evidence the page must carry
- The specific misalignment, expressed as a contradiction: the strategy asks for X, the incentive pays for Y.
- Its operational consequence in a number — cycle time, escalation volume, rework rate, or a missed service level.
- A sequenced fix. Aligning metrics before decision rights usually produces new metrics that nobody can act on.
Where this slide gets sent back
Five-element diagnostics tend to conclude that everything needs improvement, which is both true and useless. The page has to identify the binding constraint — the one element whose misalignment makes the other four fixes ineffective. If decision rights sit two levels above the people doing the work, no amount of process redesign will change cycle time, and the page should say that in the title.
Reusable PPT prompt
Create a 16:9 management-elements diagnostic with five connected nodes: strategy, processes, organization, technology, and performance measurement. Use evidence to rate alignment, highlight the weakest links, explain the operational consequence, and propose a sequenced diagnose, align, execute plan.
8. Lotus Innovation
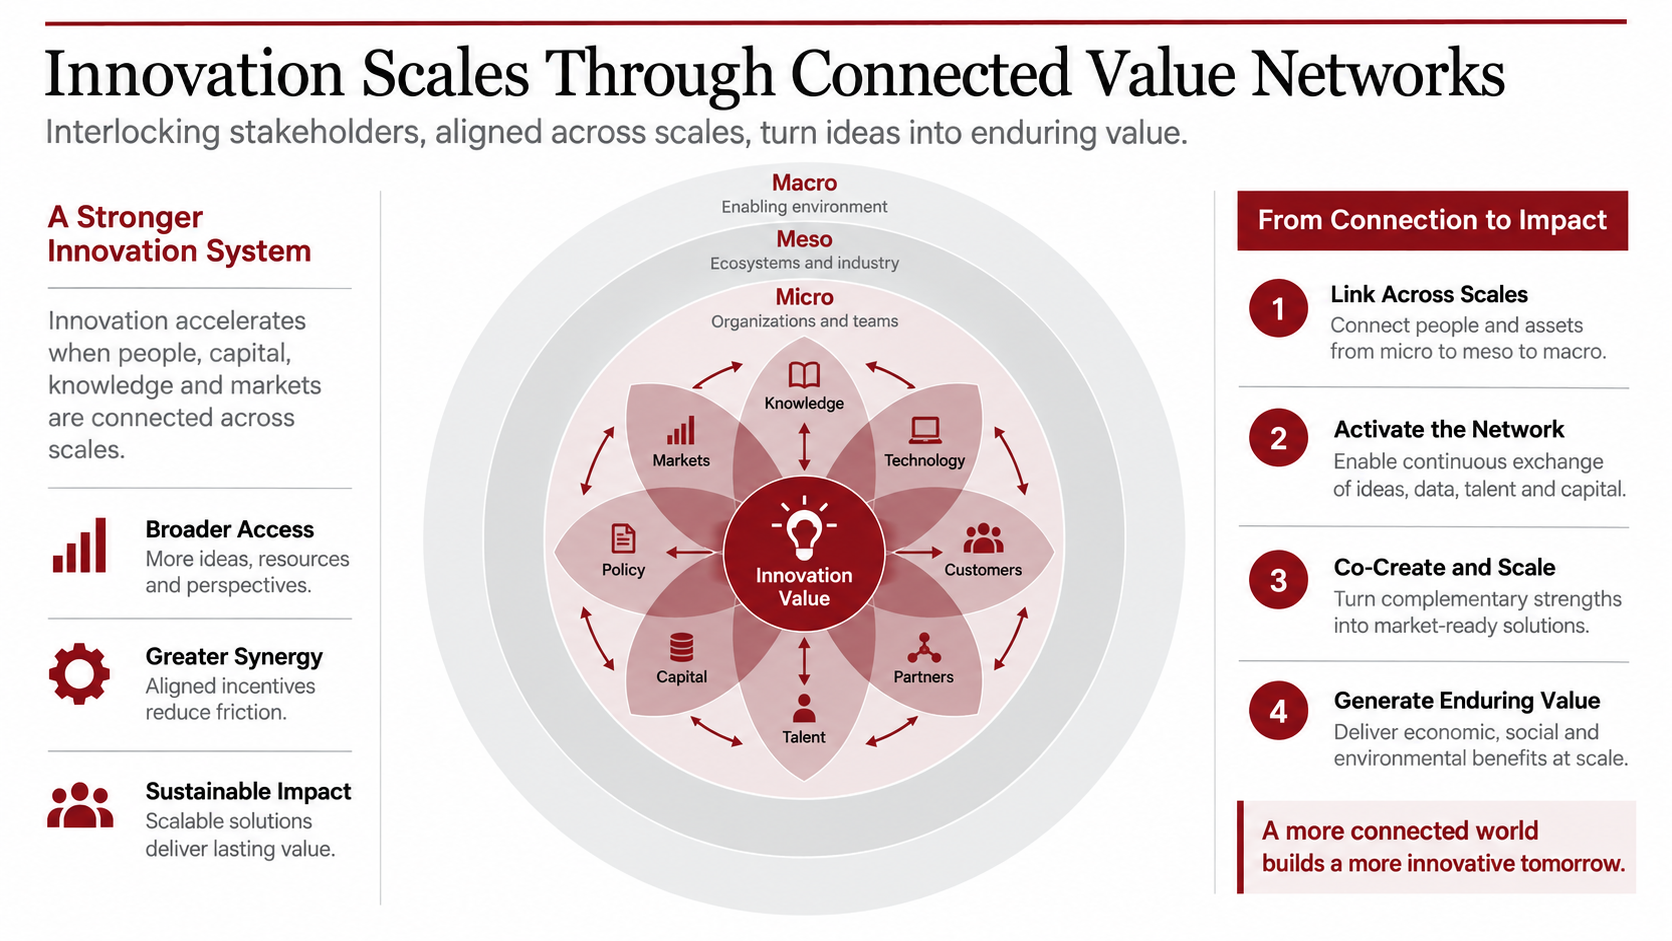
Lotus Innovation is commonly associated with Debra M. Amidon and the ENTOVATION knowledge-innovation work. It represents innovation as a network of relationships rather than a closed internal pipeline. The three levels are micro, covering teams and organizations; meso, covering industries and ecosystems; and macro, covering policy and the wider economy. Use overlapping petals to show how knowledge, talent, technology, partners, customers, capital, policy, and markets combine to create value.
Evidence the page must carry
- Named relationships, not categories. "Partners" is a label; a named university lab with a signed agreement is evidence.
- The missing links, explicitly. The diagnostic value of the model is in the petals that are thin.
- An owner per ecosystem relationship, because unowned partnerships decay quietly.
- A measurable innovation outcome the network is supposed to produce.
Where this slide gets sent back
Network diagrams are the easiest exhibit in consulting to make beautiful and meaningless. Eight symmetrical petals imply eight equally healthy relationships, which is almost never the case. Vary the visual weight to match reality, and let the page show an asymmetric, partly broken network. That version starts a useful conversation; the symmetrical one ends it.
Reusable PPT prompt
Design a 16:9 Lotus Innovation slide with micro, meso, and macro layers. Use eight overlapping petals for knowledge, talent, technology, partners, customers, capital, policy, and markets. Highlight missing relationships, name ecosystem owners, and connect the network to measurable innovation outcomes.
Rating soft factors without losing credibility
Six of these eight models require rating something that cannot be measured directly. Four practices keep those pages defensible.
Write the anchors before the scoring. Define what a 1 and a 5 look like in observable terms, then score. Anchors written afterwards tend to describe the scores that were already assigned.
Separate the rater from the owner. When the person who owns a function also scores it, the distribution compresses toward the middle. Independent scoring, even informally, produces a more useful spread.
Show the spread, not just the mean. If five interviewees rated coordination 1, 2, 4, 5, and 5, the average of 3.4 destroys the most interesting fact on the page — that people in the same organization disagree sharply about how well it coordinates.
State the evidence class in the footer. Interview-based, survey-based, systems data, or management estimate. A reader who knows which one it is can calibrate; a reader who does not will assume the weakest.
How Tosea AI simplifies consulting-slide layout
The hard part is selecting the right visual structure. In Tosea AI, choose a layout or diagram at the outline stage. A comparison can become a matrix, a transformation can become a five-part system, and an operating model can become a connected-node diagram before rendering.
After rendering, change the layout or diagram when the content is right but the exhibit is not. Use Layout Only when wording is approved and only the visual hierarchy should change. Check labels, citations, footnotes, and line breaks before delivery.
These eight models are unusually sensitive to exhibit choice, because a diagnostic rendered as a bullet list loses the relationship that makes it a diagnostic at all. Being able to convert a list into a connected-node diagram after the wording is settled removes the usual trade-off between getting the argument right and getting the page right.
A five-step workflow for a PwC-style PowerPoint with AI
- Write the decision question and intended audience.
- Select the model that matches the question, not the model that looks most impressive.
- Replace generic labels with company evidence, dates, sources, and owners.
- Convert the analysis into an answer-first headline and one primary exhibit.
- Review the editable PPTX in the exact PowerPoint environment used for delivery.
Frequently asked questions
Which of these eight models should I use for a board-level discussion?
Parenting Advantage and the Grand Strategy Matrix are built for board-level ownership and direction questions. Management Elements and Five Factors of Change are executive-committee diagnostics — they name internal constraints, which is usually a conversation for the people who can fix them rather than for a board.
How do I present a diagnostic that criticizes the leadership team?
Lead with the evidence rather than the rating, use the same scoring standard for every factor, and name the constraint without naming individuals. A page that shows milestone slippage, interview counts, and a specific coordination breakdown is far harder to dismiss than one that assigns leadership a 2 out of 5.
Are Five Factors of Change and Management Elements official proprietary frameworks?
No. Both are practical synthesis tools with several variants in circulation, and this guide presents them as such. Attribution accuracy matters on a consulting page — claim a framework's provenance only where it is documented, as with the Human Capital Index and Parenting Advantage, both of which are cited in the sources below.
Can Tosea AI redesign my existing PowerPoint without changing the content?
Yes. Export the PowerPoint as a PDF, upload the PDF to Tosea AI, and request a redesign that keeps the original wording. Use Layout Only when the goal is to refresh visual structure without rewriting content. Confirm that every label, footnote, citation, and slide element remains complete.
How do I upload a PowerPoint and ask Tosea AI to redesign each slide?
First export the PowerPoint file as a PDF. Upload it to Tosea AI and explain that every slide should be redesigned while preserving content and sequence. Choose a template or describe the visual direction, generate the deck, inspect each slide, and then export the revised presentation.
Can I upload my own PowerPoint template to Tosea AI?
Tosea AI supports custom templates on eligible paid plans. Configure the template through the available product workflow, then apply it to the presentation. Before sharing the deck, check that required layouts, fonts, colors, logo placement, and master-slide rules are represented correctly.
Can Tosea AI use custom brand colors, fonts, and a logo?
Yes. Specify the brand colors and fonts in the instructions, then upload the logo or use a supported custom template. Custom logo and template features are available on eligible plans. After export, verify font availability, color values, logo clear space, and contrast in PowerPoint.
Can Tosea AI match the style of my old company presentations?
Tosea AI can use a representative company deck as design guidance. This does not mean permanent model training. For stronger consistency, use an approved custom template with company layouts, colors, fonts, and logo rules. Compare the generated deck with the official brand guidelines before distribution.
Does Tosea AI preserve PowerPoint formatting after export?
Tosea AI editable PPTX export is designed to remain close to the generated preview while keeping elements available for editing. Results can vary with fonts, complex graphics, and the application used to open the file. Test the export in the exact PowerPoint setup used for delivery.
Can I tell AI to edit the layout only and keep the exact wording?
Yes. Tosea AI provides Layout Only for changing visual structure without intentionally rewriting slide content. It is useful when wording has already been approved. After the edit, compare the slide with the source and confirm that labels, citations, footnotes, numbers, and line breaks remain correct.
Build the analysis first, then make it beautiful
A credible consulting deck does not hide weak thinking behind polished graphics. Start with the business question, choose the right model, make assumptions visible, and let the slide structure clarify the answer. Organizational models reward this discipline more than commercial ones do, because their inputs are softer and their conclusions are harder to check.
Continue the series with five advanced PwC-style strategy frameworks, six enterprise management models, and the McKinsey-style 3C strategy deck guide. When you are ready to build your own deck, start with Tosea AI.
Editorial and evidence note
Framework variants differ across sources. Five Factors of Change and Management Elements Analysis are practical synthesis tools, not universally standardized proprietary models. Replace illustrative content with verified client data before use.
Sources
- The Human Capital Index: Human Capital as a Lead Indicator of Shareholder Value — Watson Wyatt Worldwide
- Corporate Strategy: The Quest for Parenting Advantage — Harvard Business Review, March 1995
- Ansoff on environmental turbulence and strategic behavior — RePEc / Palgrave Macmillan