How to Build a Bain-Style Consulting PowerPoint with 10 Decision-Making Frameworks
Match 10 decision frameworks, from 5W2H and Delphi to Kepner-Tregoe, decision trees, and Six Thinking Hats, to the right consulting slide, with worked examples and AI prompts.
A Bain-style consulting PowerPoint turns an unclear management question into a decision that an executive team can inspect, challenge, and act on. The frameworks behind those pages are not interchangeable: some define the problem, some widen the option set, some turn expert judgment into an estimate, and only a few are built to choose. This guide maps 10 decision-making and creative-thinking frameworks to those four jobs, works through the arithmetic a steering committee will check, and shows how to build each page with AI in Tosea AI.
The slide examples are original editorial illustrations, not Bain & Company templates, and Tosea AI is not affiliated with or endorsed by Bain.
Quick answer: Pick the framework from the decision problem, not from the visual you want to draw. Use 5W2H and the Garbage Can Model to frame a messy decision; Six Thinking Hats, brainstorming, Synectics, the Gordon Technique, and the Osborn checklist to generate and reframe options; the Delphi method when expert judgment is the evidence; and Kepner-Tregoe Decision Analysis plus a decision tree to select. Keep generation and selection in separate steps.
The Ten Decision-Making Frameworks at a Glance
| Framework | Stage | Best question | Recommended slide output |
|---|---|---|---|
| 5W2H | Frame | What exactly is the problem, scope, owner, timing, method, and cost? | Seven-question issue-framing canvas |
| Garbage Can Model | Frame | Why does an ambiguous organization make inconsistent decisions? | Four-stream timing map |
| Six Thinking Hats | Generate | How can a team examine one issue from distinct modes of thought? | Six-lens discussion sequence and synthesis |
| Brainstorming | Generate | How can a group produce a broad initial option set? | Idea clusters and evaluation funnel |
| Synectics | Generate | Which analogies can reframe a stubborn problem? | Analogy-to-design-principle map |
| Gordon Technique | Generate | What emerges if the broad challenge is explored before the exact problem is revealed? | Progressive abstraction and concept reveal |
| Osborn checklist | Generate | How can systematic prompts stretch an existing concept? | Prompt checklist and concept scorecard |
| Delphi method | Estimate | Where do expert estimates converge when hard data is incomplete? | Round-by-round distribution and consensus range |
| Kepner-Tregoe Decision Analysis | Select | Which alternative best meets mandatory and preferred objectives? | MUST screen, weighted WANT table, and risk review |
| Decision tree analysis | Select | How do probabilities and payoffs change the preferred choice? | Branching scenarios and expected values |
These methods do different jobs. Brainstorming should not select the final investment, and a decision tree should not manufacture probabilities that nobody can defend. The Garbage Can Model is diagnostic rather than prescriptive: it explains why decisions go wrong, not which option to pick.
How to Sequence the Frameworks: Diverge, Then Converge
Most stalled decisions fail at the handoffs between these tools, not inside any one of them: options get scored before the problem is agreed, or experts are asked to estimate a question nobody framed. A workable sequence has four stages:
- Frame. Agree the decision, owner, deadline, scope, and value at stake.
- Generate. Widen the option set without judging it, then shortlist against agreed criteria.
- Estimate. Where the choice depends on quantities nobody can observe yet, collect structured expert judgment.
- Select. Screen, score, and stress-test the short list, and end with an owner, conditions, and mitigations.
Stages 1 and 2 diverge; stages 3 and 4 converge. Finish diverging before converging starts, ideally in separate meetings, because ideas scored in the session that produced them anchor on whichever came first.
Not every decision needs all four stages. A vendor renewal with three known options can go straight to Kepner-Tregoe; a market-entry question with no internal data may live mostly in Delphi. The table is a menu, not a checklist, the same principle we apply when choosing strategy frameworks for a BCG-style deck.
Stage 1: Frame a Messy Decision with 5W2H and the Garbage Can Model
5W2H: seven questions before any option is compared
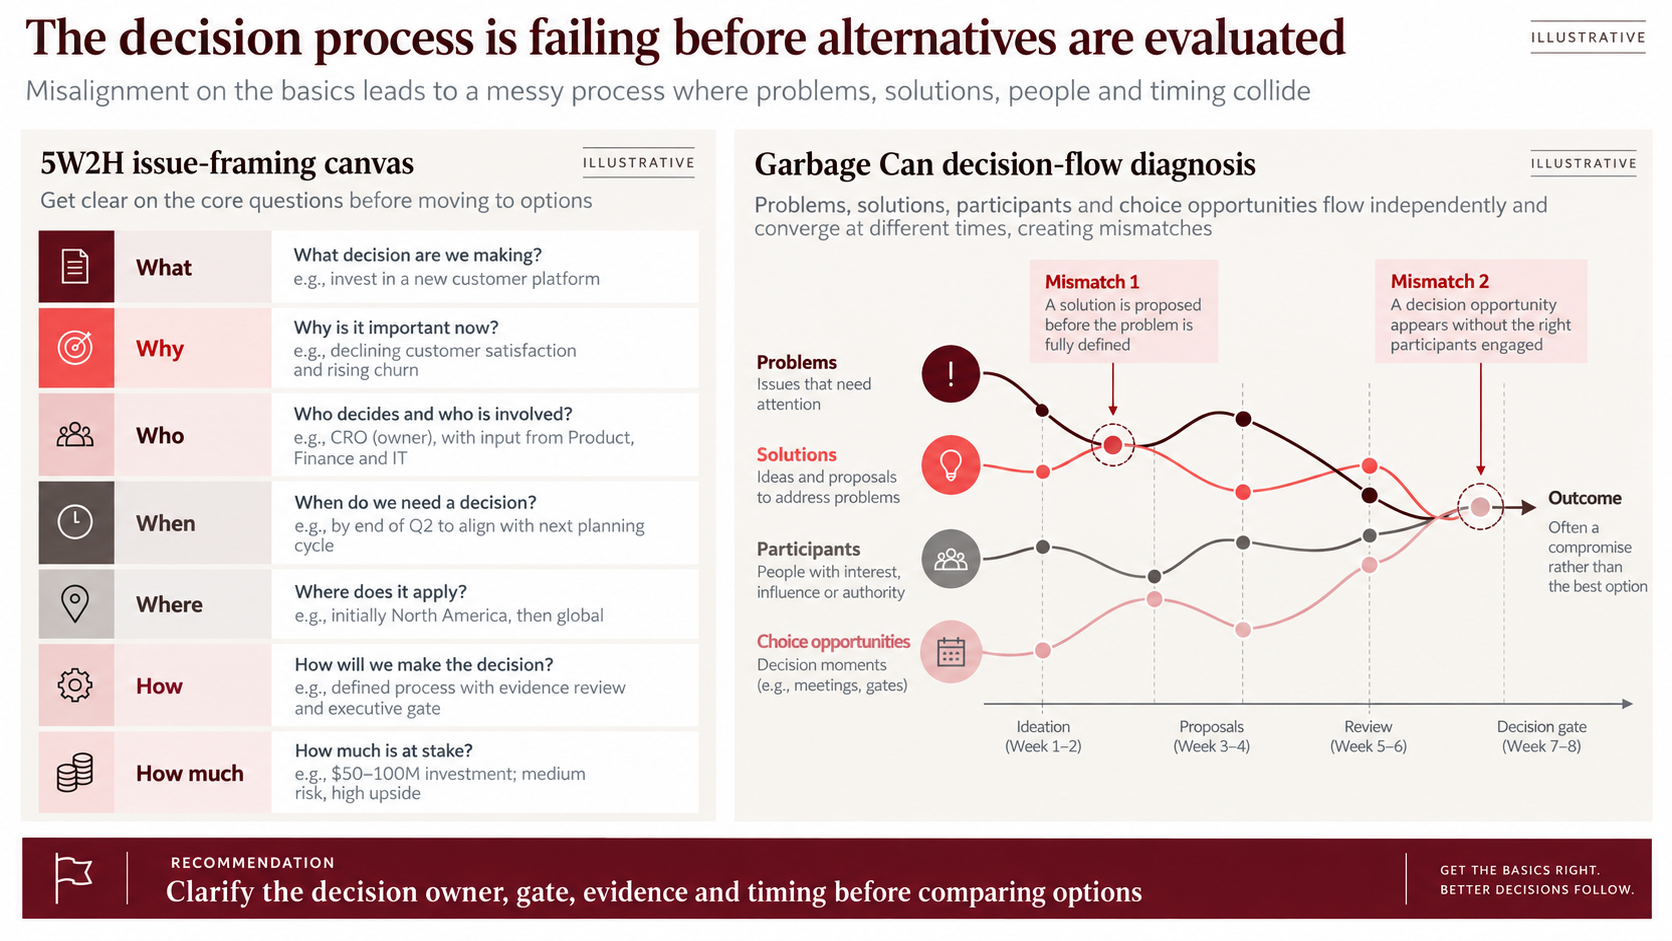
5W2H asks What, Why, Who, When, Where, How, and How much. Its value comes from forcing answers specific enough to disagree with. "What: improve customer experience" fails; "What: decide whether to invest in a new customer platform" passes.
Work through it in this order:
- What and Why first. Name the decision, then the reason it matters now. If two stakeholders write different "What" statements, stop. That disagreement is the finding.
- Who next. Separate the single decision owner from contributors. A committee is not an owner.
- When and Where. Give a decision date tied to a planning cycle and an initial scope, such as one region or one product line.
- How and How much last. Describe the decision process (evidence review, executive gate) and the value at stake, including a risk band.
The Garbage Can Model: why good options still produce bad decisions
In 1972, Michael Cohen, James March, and Johan Olsen described "organized anarchies" in which problems, solutions, participants, and choice opportunities flow independently and meet almost by accident. A solution looking for a problem attaches itself to the next available meeting, and a decision gets made because a budget deadline arrived, not because the analysis was ready.
On a slide, the model becomes a four-stream timeline with the mismatches marked.
Illustrative slide. The scenario and figures are fictional.
The left side fixes the basics: the CRO owns the decision with input from Product, Finance, and IT, it is due by the end of Q2, and $50–100M is at stake. The right side explains the stall. A solution is proposed before the problem is fully defined, and a decision opportunity arrives near the week 7–8 gate without the right participants engaged. The recommendation is a governance change, not an option choice.
When to skip it. If the owner and decision date are already agreed in writing, go to Stage 2. If they are still disputed, any weighted scoring shown later will look precise and settle nothing.
Reusable AI prompt
Create one executive decision-framing slide from the attached notes and meeting records. Build a 5W2H canvas covering What, Why, Who, When, Where, How, and How much. On the same page, map Problems, Solutions, Participants, and Choice opportunities across time. Identify where these streams fail to meet. Write a conclusion-led title and recommend one governance change. Use only source evidence and label unresolved questions instead of inventing answers.
Stage 2: Generate and Reframe Options
Six Thinking Hats: parallel thinking instead of debate
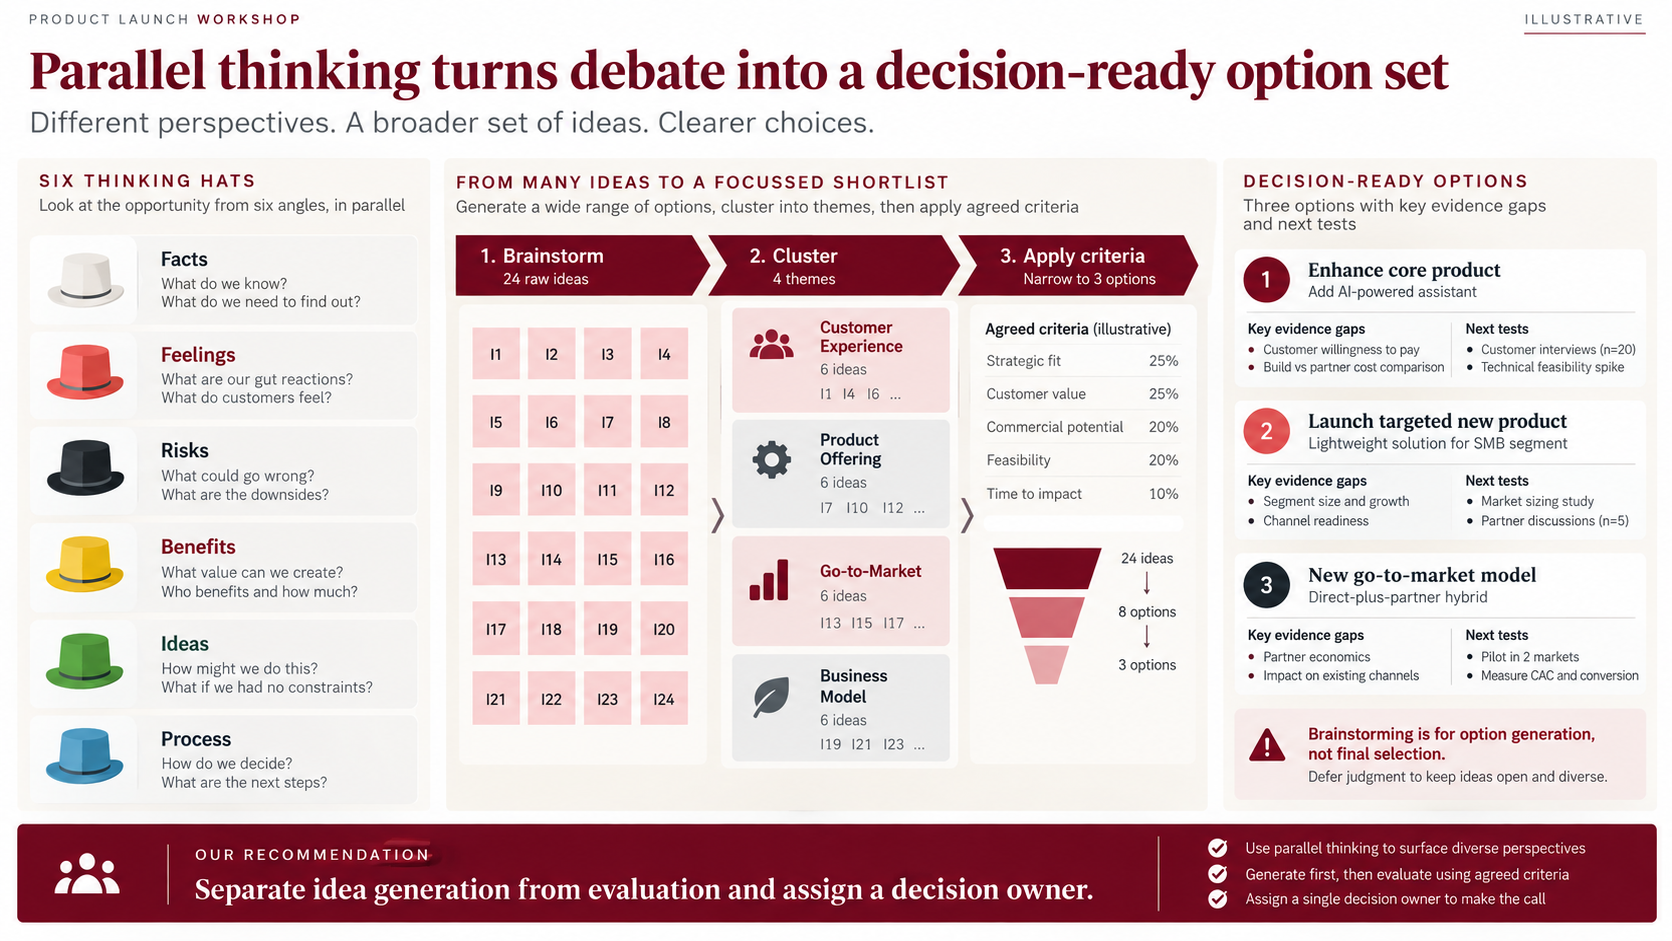
Edward de Bono's method has everyone use the same mode of thinking at the same time. The De Bono Group describes six hats: white for facts, red for feelings and intuition, black for risks, yellow for benefits, green for new ideas, and blue for managing the process. Because nobody argues risks while another person pitches benefits, each mode gets a hearing.
For option generation, a practical order is blue (agree the question), white, green, yellow, black, red, and blue again (next steps and owner). Keep black-hat time short here; its full weight belongs in Stage 4.
Brainstorming: quantity first, and ideally in writing
Alex Osborn popularized brainstorming in the late 1940s and 1950s with four rules: defer judgment, aim for quantity, welcome unusual ideas, and build on others' ideas. Later research, including Diehl and Stroebe's 1987 study, found that interacting groups often produce fewer ideas than the same number of people working alone, largely because only one person can speak at a time. The practical fix is brainwriting: everyone writes ideas silently for ten minutes, then the group clusters and builds on them.
Illustrative slide. The scenario and figures are fictional.
The funnel is the part executives read: 24 raw ideas clustered into four themes of six, narrowed to eight options, then to three against disclosed criteria (strategic fit and customer value at 25% each, commercial potential and feasibility at 20% each, time to impact at 10%). Each surviving option carries its evidence gaps and next test, which is what makes it decision-ready rather than merely shortlisted.
Synectics, the Gordon Technique, and the Osborn checklist: reframe when ideas run dry
When a brainstorm keeps producing variations of the same idea, the framing is usually too narrow. Three older techniques help.
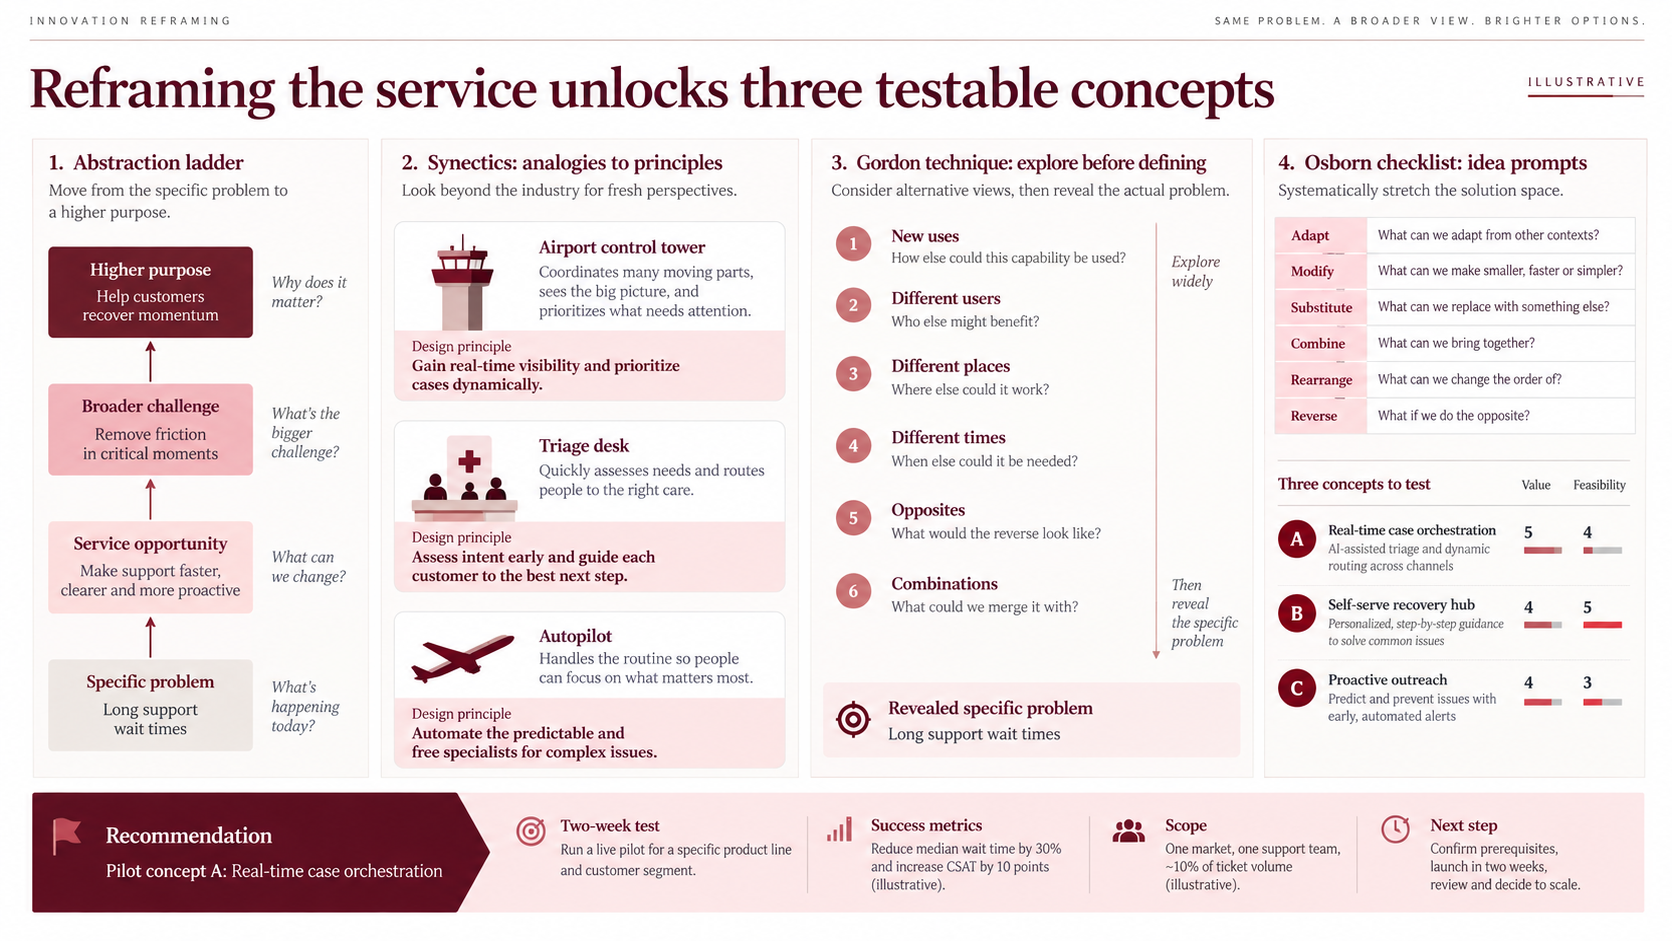
Synectics grew out of work by William J. J. Gordon and George Prince, who studied recorded innovation sessions from the 1950s onward, as Synecticsworld recounts. Its core move is analogy: make the strange familiar and the familiar strange. In business settings, direct analogy does most of the work. How does an airport control tower, a hospital triage desk, or an autopilot handle the same underlying problem? Each analogy should end in a design principle, not a metaphor.
The Gordon Technique withholds the exact problem. The facilitator opens with an abstract theme, such as "moving things" rather than "our warehouse layout," and reveals the specific problem only after the group has explored the broad space. This reduces the anchoring that happens when experts recognize a familiar problem and reach for the familiar fix.
The Osborn checklist comes from Osborn's Applied Imagination (1953), which groups idea-spurring questions under verbs such as adapt, modify, magnify, minify, substitute, rearrange, reverse, and combine, and was later condensed into the SCAMPER mnemonic. Run it against a concept that already exists; it stretches ideas rather than starting them.
Illustrative slide. The scenario and figures are fictional.
The example climbs from "long support wait times" to "help customers recover momentum," comes back down with three rated concepts, and ends with a two-week pilot in one market covering roughly 10% of ticket volume. A reframing page that ends without a test is a workshop artifact, not a decision slide.
Reusable AI prompt
Design a structured option-generation workshop for the attached business problem. Start with Six Thinking Hats so the group examines facts, reactions, benefits, risks, new ideas, and process. Run brainstorming without evaluation, then cluster duplicate ideas. Use Synectics to translate three outside analogies into design principles. Apply the Gordon Technique by exploring the broader challenge before revealing the exact problem. Finish with an Osborn checklist and rank the concepts using disclosed value and feasibility criteria. Keep generation and selection as separate stages.
Stage 3: Estimate Under Uncertainty with the Delphi Method
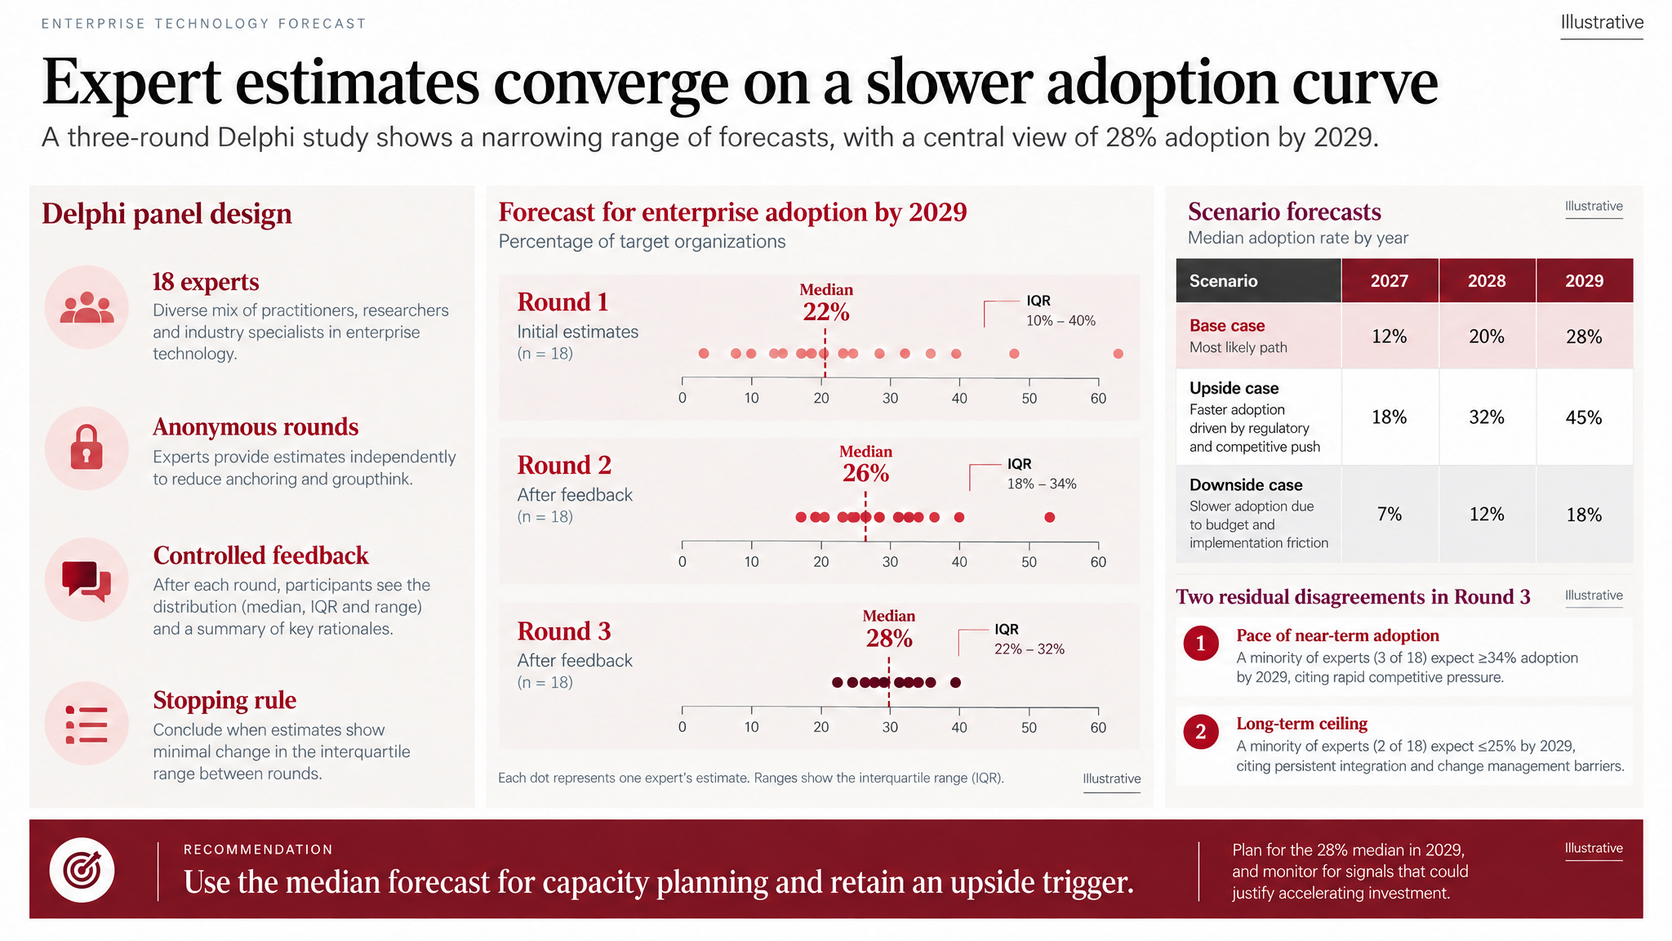
The Delphi method was developed at RAND in the 1950s. Norman Dalkey and Olaf Helmer's 1962 memorandum, An Experimental Application of the Delphi Method to the Use of Experts, describes the early experiments. Four features define the method: anonymity, iteration across rounds, controlled feedback between rounds, and a statistical summary of the group's answer rather than a negotiated one.
How to run a Delphi study that holds up in a deck
- Design the panel for coverage of the relevant knowledge, not seniority. Record composition and attrition between rounds.
- Write one quantitative question per estimate. "What share of target organizations will have adopted by 2029?" is answerable; "How fast will adoption go?" is not.
- Collect round 1 independently, with no names and no discussion.
- Feed back the distribution: median, interquartile range, and the reasoning behind outlying answers.
- Repeat until the range stops moving, using a stopping rule set before round 1.
- Report what did not converge. A minority view with a credible mechanism is information, not noise.
Illustrative slide. The scenario and figures are fictional.
Read the example as a convergence story. The median moves from 22% to 26% to 28% across three rounds, while the interquartile range narrows from 30 points (10–40%) to 16 points (18–34%) to 10 points (22–32%). The narrowing is the evidence; the median alone is not. The slide also keeps two minority views visible, three experts at 34% or more and two at 25% or less, and ties the recommendation to a trigger that would justify revisiting it.
Where Delphi goes wrong. Controlled feedback can become conformity pressure if experts simply drift toward the median. Ask for a short rationale whenever an estimate changes, and never drop outliers without a rule written before the study began.
Reusable AI prompt
Build a Delphi forecasting slide from the attached round-level responses. State the expert panel size and composition, anonymity protocol, feedback process, and stopping rule. Plot every response for each round, then show the median, interquartile range, and change between rounds. Separate consensus from unresolved disagreement. Do not remove outliers without a documented rule. End with the planning assumption and the trigger that would justify revising it.
Stage 4: Select an Alternative with Kepner-Tregoe and a Decision Tree
"KT" in management practice means Kepner-Tregoe Decision Analysis, from the rational process Charles Kepner and Benjamin Tregoe published in The Rational Manager (1965) and that Kepner-Tregoe still teaches. It is not a "knowledge tree" method. The sequence is:
- State the decision objective in one sentence.
- Separate MUST objectives (pass or fail, measurable) from WANT objectives (weighted preferences).
- Screen every alternative against the MUSTs. Any failure eliminates the option.
- Weight the WANTs, score each surviving alternative on one disclosed scale, and total the results.
- Review adverse consequences for the leading alternatives: probability, seriousness, and mitigation.
A decision tree, introduced to managers by John Magee in Harvard Business Review in 1964, is a separate tool that adds uncertain events, probabilities, and payoffs. Combine the two only when the source data supports the probabilities.
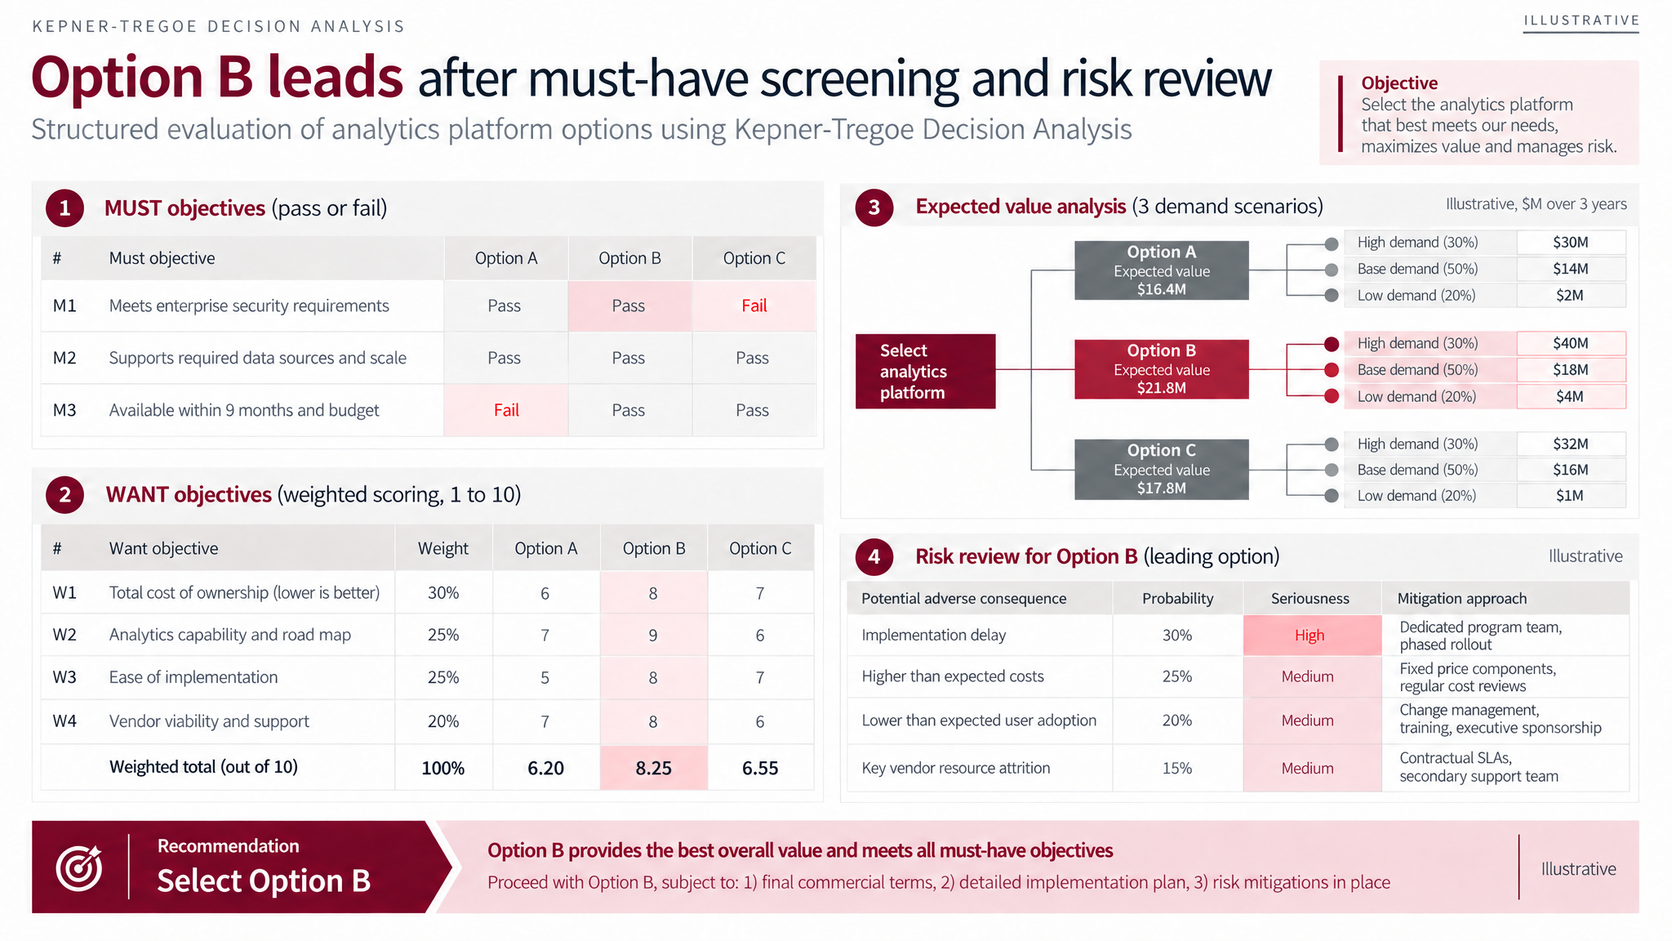
Illustrative slide. The scenario and figures are fictional.
Worked example: the arithmetic behind "Option B leads"
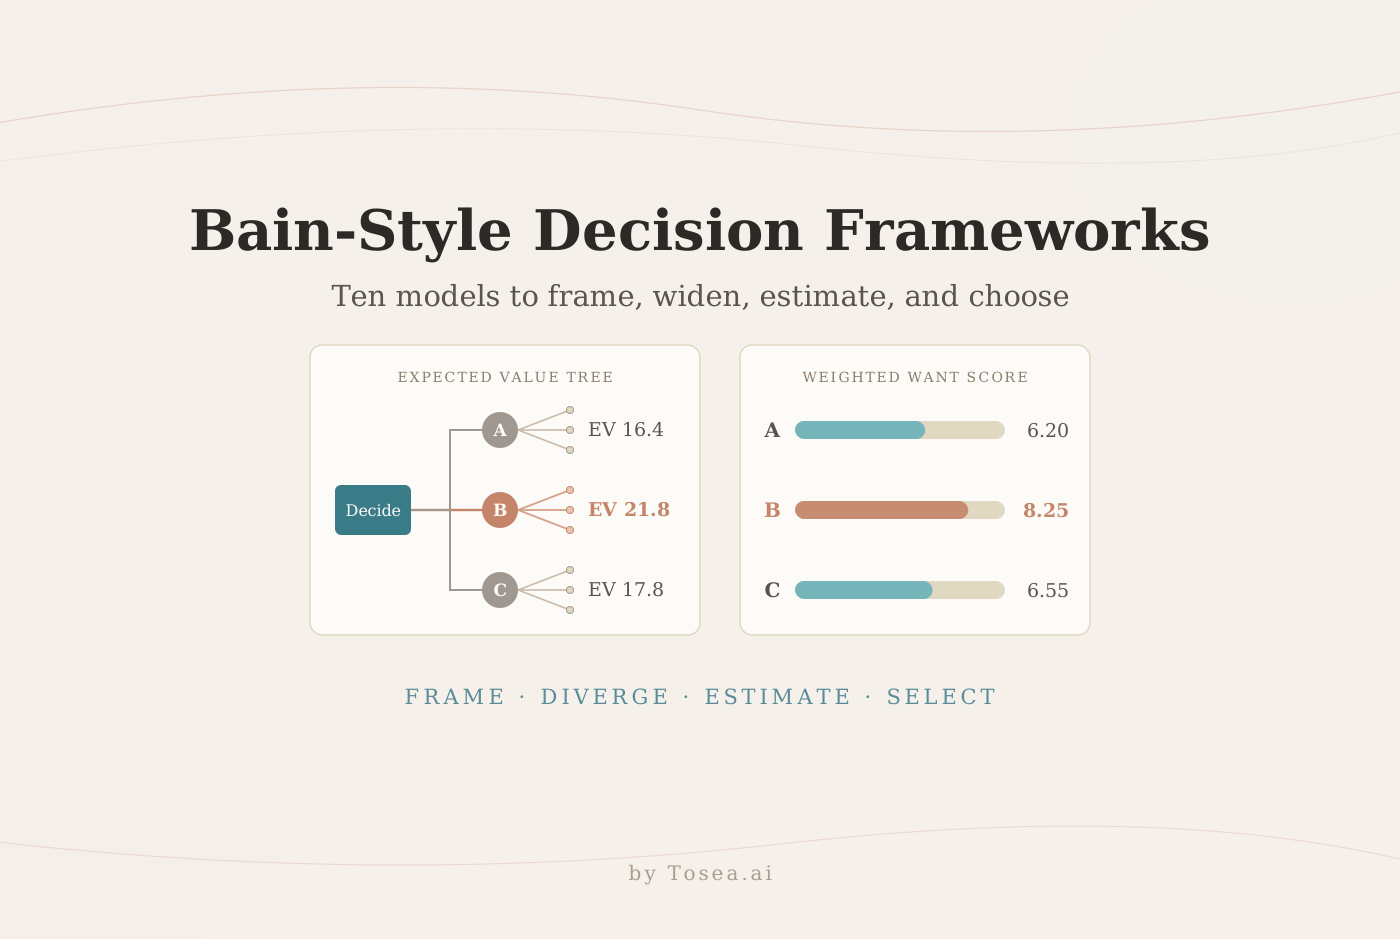
The objective is to select an analytics platform. Three MUSTs apply: enterprise security, required data sources and scale, and availability within nine months and budget. Option A fails the timing MUST and Option C fails security. Under strict KT rules both drop out at the screen; the slide keeps them visible so the committee can see why.
The WANT table uses a 1–10 scale where a higher score is better on every row, including cost, where a higher score means a lower total cost of ownership:
| WANT objective | Weight | Option A | Option B | Option C |
|---|---|---|---|---|
| Total cost of ownership | 30% | 6 | 8 | 7 |
| Analytics capability and road map | 25% | 7 | 9 | 6 |
| Ease of implementation | 25% | 5 | 8 | 7 |
| Vendor viability and support | 20% | 7 | 8 | 6 |
| Weighted total (out of 10) | 100% | 6.20 | 8.25 | 6.55 |
For Option B: 0.30 × 8 + 0.25 × 9 + 0.25 × 8 + 0.20 × 8 = 2.40 + 2.25 + 2.00 + 1.60 = 8.25.
Two observations belong on the page. First, Option B scores higher than both A and C on every WANT, so no reweighting can put either ahead; the sensitivity test passes by construction. Second, the WANT scoring hardly matters because A and C already failed MUSTs. The real work for B is the adverse-consequence review: a 30% chance of implementation delay rated high, plus cost, adoption, and vendor-attrition risks, each with a named mitigation.
The expected-value tree uses three demand scenarios with three-year payoffs:
| Option | High demand (30%) | Base demand (50%) | Low demand (20%) | Expected value |
|---|---|---|---|---|
| A | $30M | $14M | $2M | $16.4M |
| B | $40M | $18M | $4M | $21.8M |
| C | $32M | $16M | $1M | $17.8M |
For Option B: 0.3 × 40 + 0.5 × 18 + 0.2 × 4 = 12.0 + 9.0 + 0.8 = 21.8.
When the tree actually earns its place
In this example B wins in every branch, so the probabilities barely matter. Any set of scenario weights would pick B. Decision trees become valuable when payoffs cross. Suppose a fourth platform, Option D, passes all MUSTs and pays $55M in high demand and $15M in base demand, but loses $5M in low demand. Its expected value is 0.3 × 55 + 0.5 × 15 + 0.2 × (−5) = 16.5 + 7.5 − 1.0 = 23.0, ahead of B's 21.8.
Now hold the base case at 50% and let the high-demand probability p vary, with low demand at 0.5 − p. B's expected value is 36p + 11 and D's is 60p + 5. They are equal at p = 0.25. The committee is therefore choosing between B and D on whether high demand is more or less likely than 25%, only five points below the planning assumption, and on whether it can absorb a $5M loss. That break-even probability, not the 23.0 versus 21.8 headline, is the number to put in the slide title.
Reusable AI prompt
Create one Kepner-Tregoe Decision Analysis slide for the attached alternatives. State the decision objective. Separate MUST objectives from WANT objectives. Eliminate any option that fails a MUST. Weight the WANT objectives, score each feasible option on one disclosed scale, and show the weighted totals. Add a decision tree only where source data provides probabilities and outcomes, and report the break-even probability if the ranking changes between branches. Review adverse consequences for the leading option and list mitigations. Recalculate every total and flag missing evidence.
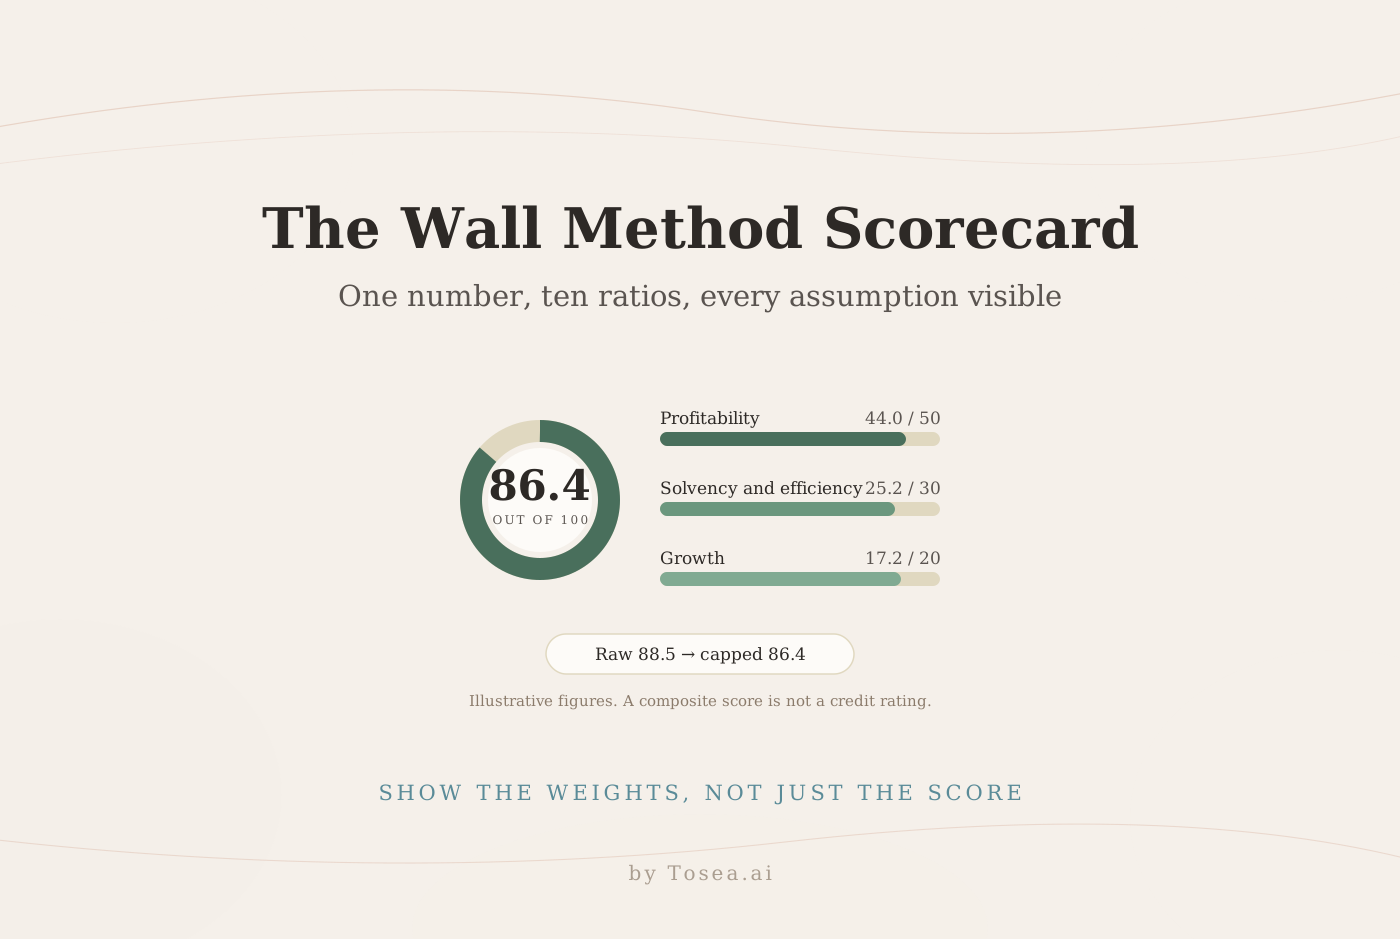
Weights contain judgment, so record who approved the criteria and when. For a longer treatment of weighted scoring, benchmarks, and caps, see our Wall method scoring guide.
Five Failure Modes That Get Decision Slides Sent Back
1. The framework was chosen for its look. A decision tree with invented probabilities looks rigorous until someone asks where the probabilities came from. Without source probabilities, present scenarios without them.
2. False precision in the weights. Weights of 27% and 23% imply a calibration nobody performed. Use 5-point steps, show who approved them, and test whether a 5-point shift changes the answer.
3. Generation and selection in the same meeting. The idea discussed first gets scored most generously. Separate the sessions, or at least the pages.
4. Minority views disappeared. A median or a weighted total can hide the one expert or criterion that saw the risk. Keep a small dissent panel on the page.
5. The recommendation has no owner. "Proceed with Option B" is incomplete without the owner, conditions, next gate date, and the trigger that would reopen the decision. Our note on why McKinsey decks feel so logical shows how action titles carry that recommendation through a storyline.
How Tosea AI Turns Decision Evidence into an Editable Deck
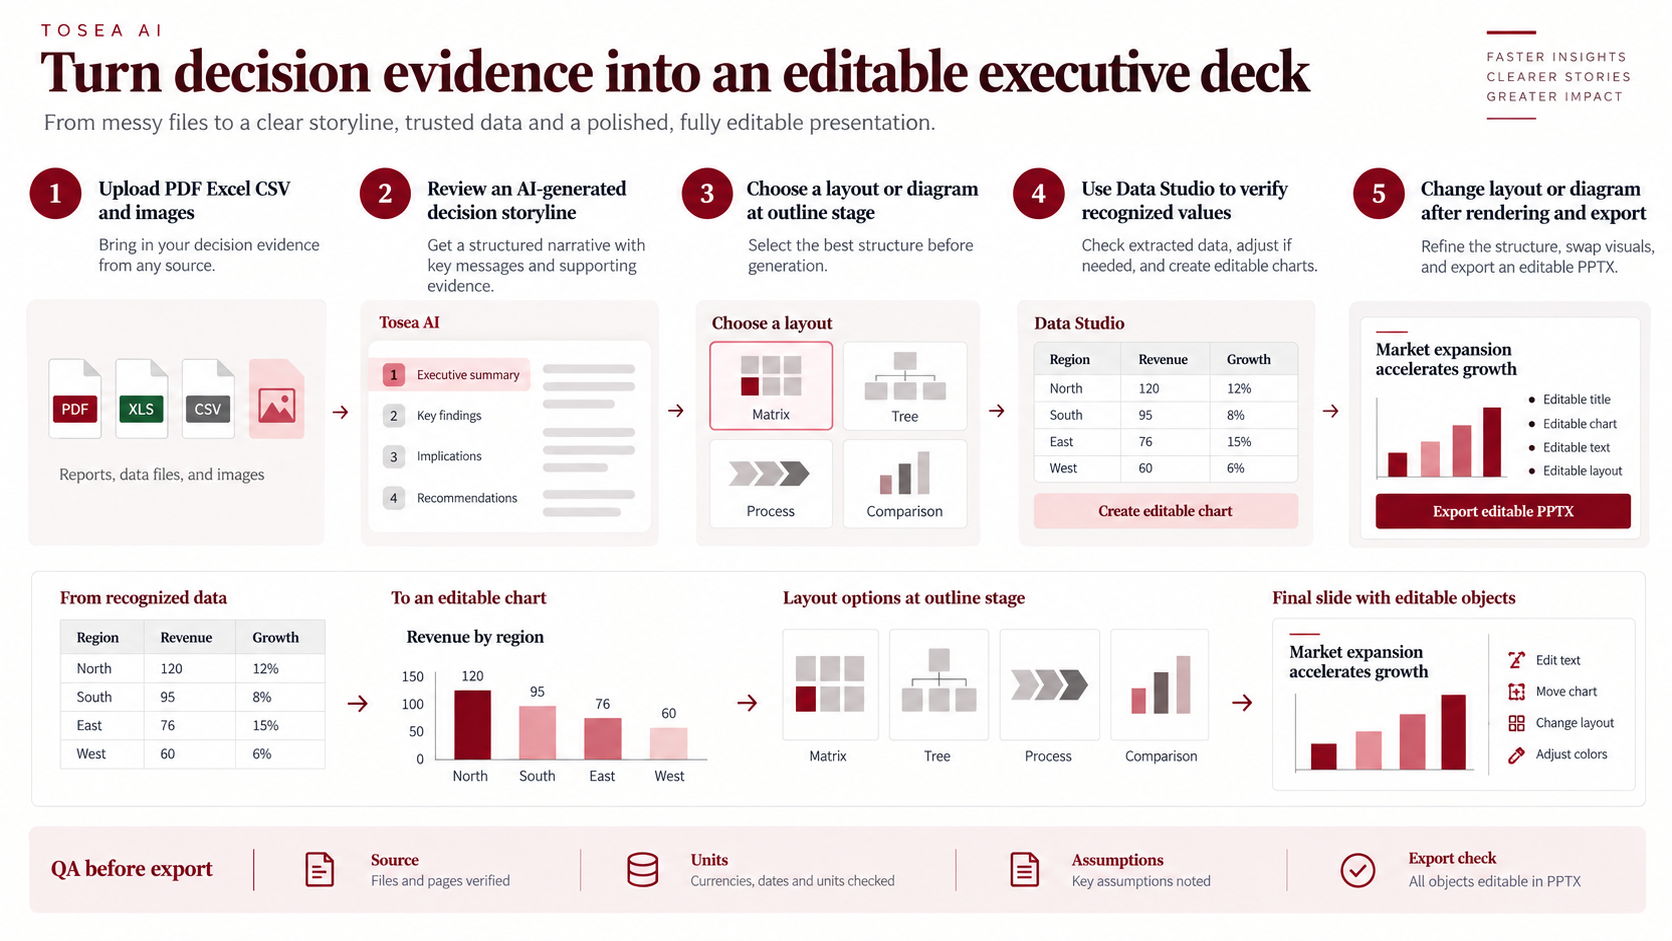
Upload the source material, whether PDFs, spreadsheets, CSV files, images, workshop notes, or research reports, to Tosea AI and review the generated storyline before any slide is rendered. At the outline stage, assign each message a structure: a tree for the decision analysis, a process for the workshop sequence, a matrix for the scoring, or a comparison for the options. After rendering, layouts and diagrams remain adjustable. Layout Only changes visual structure without intentionally rewriting approved wording. Export the result as an editable PPTX for PowerPoint.
Use Data Studio when the evidence is trapped in a screenshot
Decision evidence often arrives as a pasted chart or a table inside a PDF. Tosea AI Data Studio recognizes values from charts and tables and also accepts Excel or CSV data. Verify the grid, change the mapping or chart type, adjust labels and axes, and save a reusable chart; the Data Studio guide walks through the workflow.
Recalculate weighted totals, probabilities, and expected values in a spreadsheet before export. Generated slides are a presentation layer, not a calculation engine, and the analyst stays accountable for the numbers.
Pre-Export Quality Checklist
Before a decision deck leaves your hands, confirm that:
- every slide title states a finding or a decision, not a topic;
- the framing page names one owner, one decision date, and the value at stake;
- brainstorming outputs are separated from selected options;
- Delphi pages show panel composition, rounds, stopping rule, and residual disagreement;
- options that failed a MUST are marked as eliminated, not merely low-scoring;
- weights total 100%, probabilities total 1 at each chance node, and every total reconciles with a spreadsheet;
- the break-even probability or weight is reported when the ranking is sensitive;
- adverse consequences for the recommendation carry mitigations and owners;
- the PPTX has been opened in the exact PowerPoint environment used for delivery.
Frequently Asked Questions
Is KT Decision Analysis the same as a knowledge tree?
No. In mainstream management practice, KT refers to Kepner-Tregoe. It separates MUST and WANT objectives, screens and scores alternatives, and reviews adverse consequences. A knowledge tree or objective hierarchy can organize goals and subgoals, but it should not be presented as the Kepner-Tregoe method.
Which framework should I use first?
Start with 5W2H unless the decision, owner, and date are already agreed in writing. Framing gaps are the most common reason a later scoring page gets challenged, and they are the cheapest to fix.
How many experts does a Delphi panel need?
There is no fixed number. Coverage of the relevant expertise and retention across rounds matter more than headcount. Report the panel size, composition, and attrition on the slide so readers can judge the result for themselves.
Should I show options that failed a MUST objective?
Yes, briefly. Showing why an option was eliminated heads off the "did you consider X?" question. Mark it clearly as screened out, and do not rank it alongside the surviving options.
Can Tosea AI redesign my existing PowerPoint without changing the content?
Yes. Export the PowerPoint as a PDF, upload it to Tosea AI, and request a redesign that keeps the original wording and sequence. Use Layout Only when the objective is to refresh structure without rewriting. Confirm every label, footnote, and figure before delivery.
Build a Bain-Style Consulting PowerPoint Around the Decision
A Bain-style consulting PowerPoint earns attention through a clear decision, traceable evidence, and disciplined visual hierarchy. The 10 frameworks in this guide are not decorations to rotate through. Frame first, diverge before converging, estimate what cannot yet be observed, and select with arithmetic that survives a spreadsheet check. Then end every page with an owner and a next step.
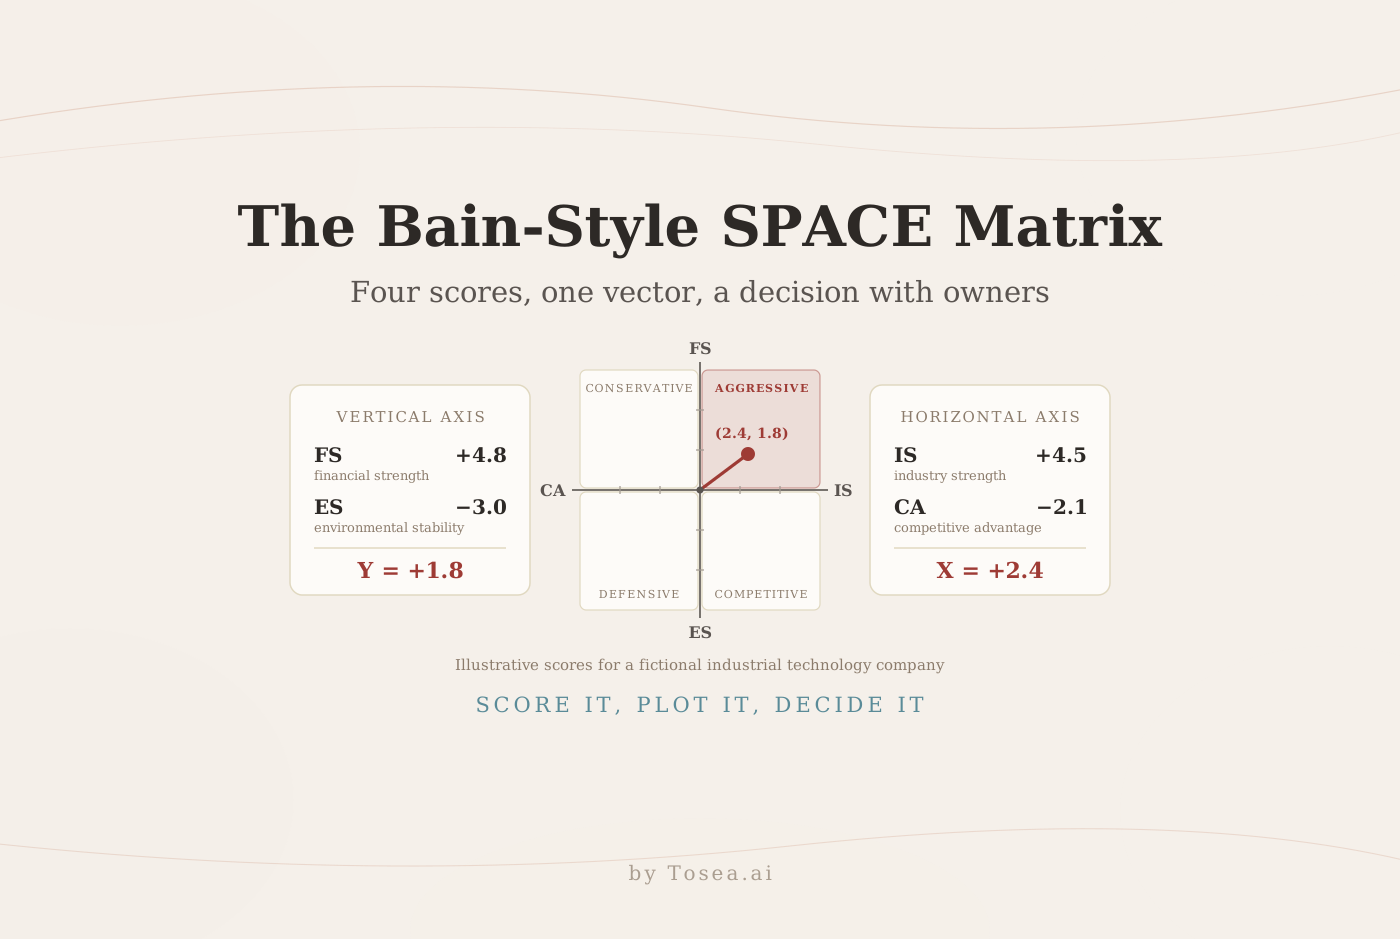
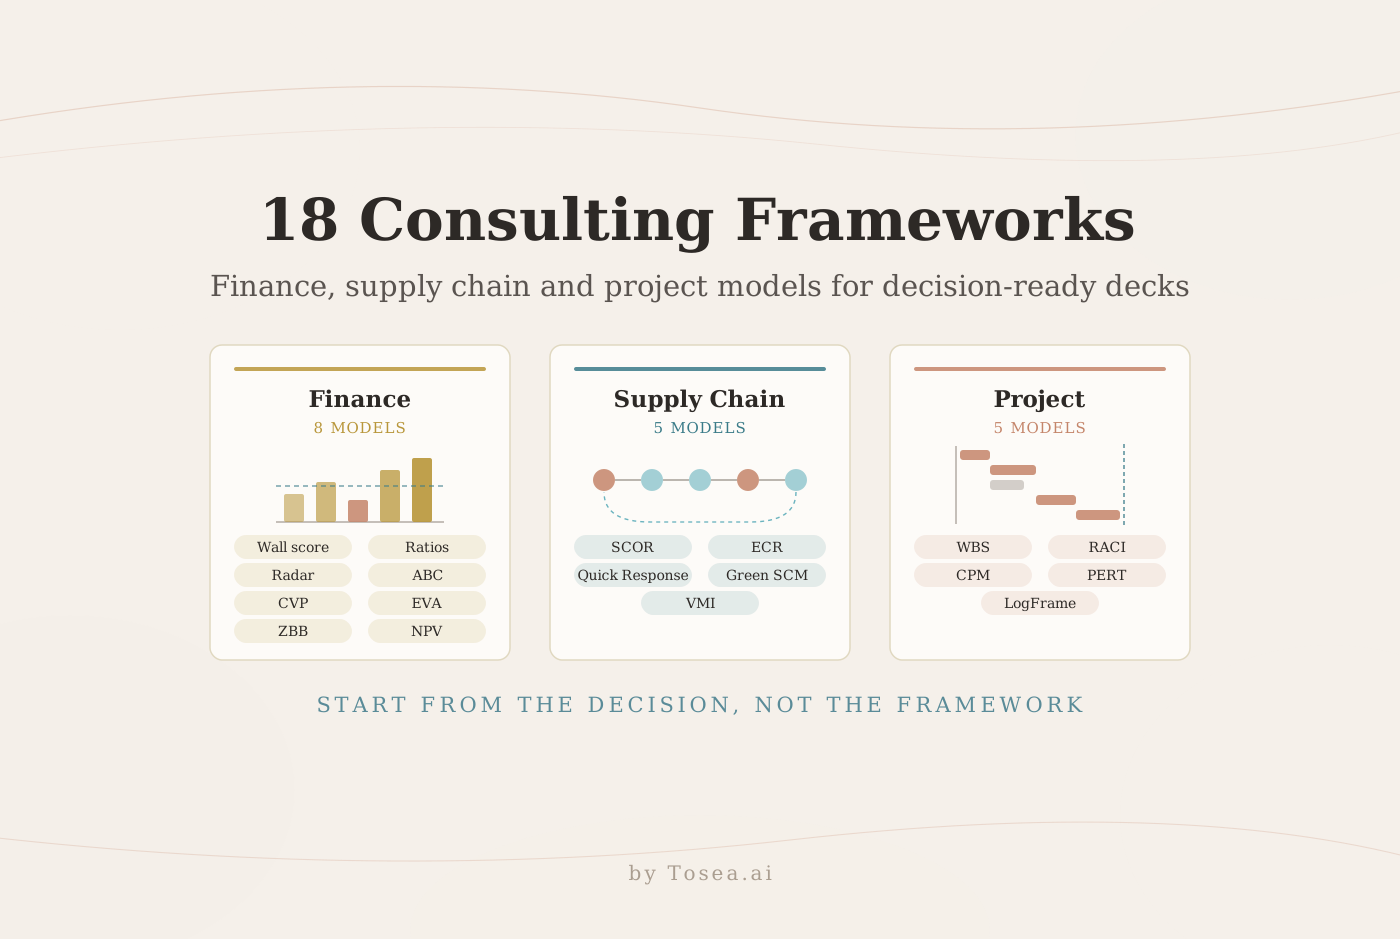
Tosea AI can move your source files into a reviewable outline, editable charts, controlled layouts, and an editable PPTX, while the judgment calls stay with you. For the frameworks that sit alongside these decision tools, see the companion guides on 18 finance, project, and supply chain frameworks and the SPACE Matrix; to connect decision pages into one argument, the BCG storyline guide covers chapter structure. Our PwC-style PowerPoint guide applies the same discipline to another firm's house style.
Sources
- A Garbage Can Model of Organizational Choice — Michael D. Cohen, James G. March, and Johan P. Olsen, Administrative Science Quarterly, 1972
- An Experimental Application of the Delphi Method to the Use of Experts — Norman Dalkey and Olaf Helmer, RAND, 1962
- Delphi Method — RAND
- Problem Solving & Decision Making (PSDM) — Kepner-Tregoe
- Decision Trees for Decision Making — John F. Magee, Harvard Business Review, July 1964
- Six Thinking Hats — The De Bono Group
- Productivity Loss in Brainstorming Groups: Toward the Solution of a Riddle — Michael Diehl and Wolfgang Stroebe, Journal of Personality and Social Psychology, 1987
- Our Story — Synecticsworld