New AI Trades: Navigating Sector Rotations with Strategic Presentations
How AI-driven sector rotations are reshaping markets and why financial professionals need specialized tools to communicate complex market intelligence.
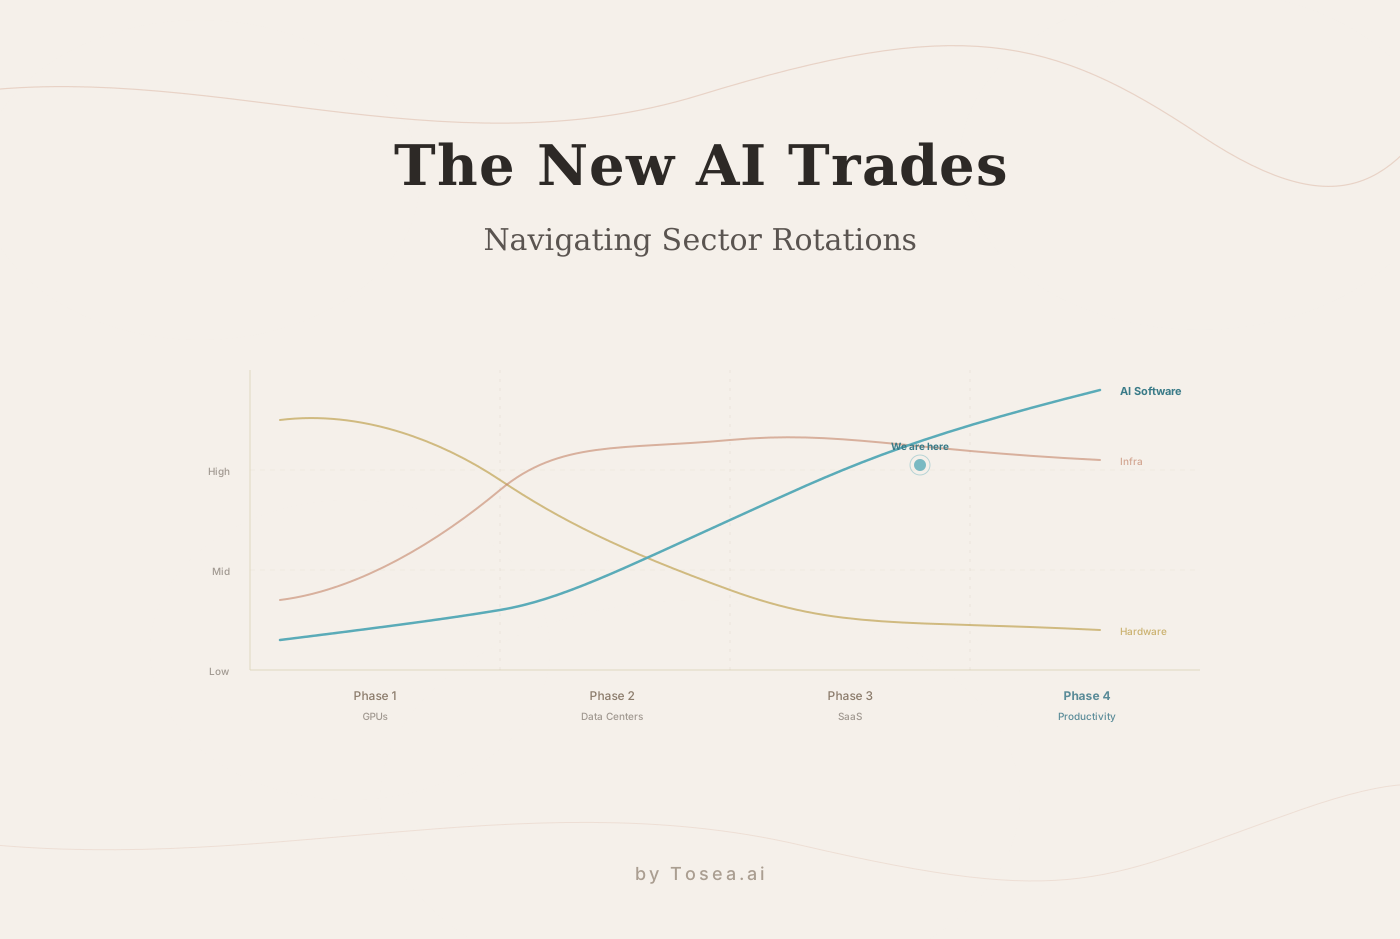
The global equity markets are witnessing a profound structural shift. As highlighted in the recent insights from Ryan Hammond of Goldman Sachs Research, the disruption caused by Artificial Intelligence is no longer a distant prophecy; it is the primary engine driving massive sector rotations across the financial landscape. While indices continue their upward trajectory, the underlying capital flow is migrating from initial hardware beneficiaries to a broader array of industries poised to harness AI for measurable productivity gains.
In this high-velocity environment, the ability to synthesize complex market intelligence and communicate it to stakeholders is a significant competitive edge. For financial analysts, fund managers, and corporate strategists, the bottleneck is often the time required to translate dense research into professional presentations. Tools like Tosea.ai, now integrating the flagship Nano Banana Pro model, are designed to bridge this gap — transforming lengthy sector research into authoritative presentation narratives in minutes rather than days.
Understanding the New AI Trade Phases
Goldman Sachs Research has consistently categorized the AI revolution into distinct phases. Understanding where we sit in this timeline is essential for creating relevant strategic presentations — and for knowing which sectors deserve the most attention in your next portfolio review.
Phase 1: The Infrastructure Enablers
This phase focused on the hardware backbone — semiconductors and GPU manufacturers such as NVIDIA, AMD, and TSMC. These were the primary beneficiaries of the initial AI investment wave. NVIDIA's data center revenue alone grew over 400% year-over-year during the peak of this phase, driven by demand for H100 and subsequent GPU architectures. For presentation purposes, Phase 1 data is now well-established and serves as the baseline for comparative analysis in any sector rotation deck.
Phase 2: The Infrastructure Scaling
The trade expanded to include the physical infrastructure required to sustain AI models at scale: power utilities, data center REITs, thermal management systems, and networking equipment providers. Companies like Vertiv, Eaton, and major utility providers in regions with cheap electricity saw significant re-ratings. This phase also introduced complexities around energy policy and sustainability that analysts must now account for when building long-term forecasts. According to the International Energy Agency, global data center electricity consumption is projected to more than double between 2022 and 2026, reaching over 1,000 TWh annually.
Phase 3: The Revenue Implementers
We are now entering the most consequential stage, where software companies and IT services firms are integrating AI to drive top-line growth. This is where the most significant sector rotations are occurring, as traditional industries — healthcare, financial services, logistics, and manufacturing — adopt AI to optimize margins and create new revenue streams. Companies demonstrating concrete AI-driven revenue acceleration, rather than speculative potential, are commanding premium valuations. The gap between "AI-ready" companies and "AI-deploying" companies has become a central theme in quarterly earnings calls across the S&P 500.
Phase 4: The Productivity Multipliers (Emerging)
A fourth phase is beginning to take shape. In this emerging stage, AI is not merely a product enhancement but a fundamental restructuring of how entire industries operate. Think of autonomous supply chains, AI-native drug discovery pipelines, and algorithmic decision-making embedded into corporate governance. This phase is still early, but forward-looking analysts are already building scenario models around it. The professionals who can articulate Phase 4 narratives clearly will have a meaningful advantage in stakeholder conversations over the next 12 to 18 months.
For professionals analyzing these phases, the challenge lies in the sheer volume of data. Converting a 200-page sectoral analysis into a 15-slide executive summary used to take days. With the right AI-powered presentation tools, that timeline drops to minutes, allowing analysts to maintain pace with market sentiment rather than lagging behind it.
Key Metrics for AI-Driven Sector Analysis
When building presentations around AI trades and sector rotations, the choice of metrics matters as much as the narrative. Here are the indicators that separate strong sector analysis from surface-level commentary.
Revenue Attribution Ratios
Track what percentage of a company's or sector's revenue growth is directly attributable to AI integration versus organic growth. This metric is still inconsistently reported across firms, which creates an opportunity for analysts who can triangulate it from earnings transcripts, capital expenditure disclosures, and management commentary.
AI Capital Expenditure as a Percentage of Total CapEx
Goldman Sachs estimates that hyperscaler AI-related CapEx exceeded $200 billion in 2025. For individual companies, the ratio of AI-specific CapEx to total capital spending reveals how seriously management is betting on AI transformation. A rising ratio combined with stable or improving margins is a strong positive signal.
Sector Rotation Velocity
Measure the speed at which capital is flowing between sectors. ETF flow data, options market positioning, and institutional 13F filings all provide proxies for this. Rapid rotation velocity often correlates with periods of high uncertainty, which means your presentations need to emphasize scenario analysis rather than point forecasts.
Margin Expansion from AI Deployment
The most compelling data point for any boardroom presentation is concrete evidence that AI adoption is expanding operating margins. Look for companies reporting reduced cost-per-transaction, faster cycle times, or headcount efficiency gains directly tied to AI tools. These data points make your sector rotation thesis tangible rather than theoretical.
Talent Migration Patterns
An underappreciated leading indicator is where AI talent is moving. LinkedIn data and job posting analytics can reveal which sectors are aggressively hiring AI engineers and data scientists, often 6 to 12 months before the financial results materialize. Including this in a presentation adds a forward-looking dimension that pure financial data cannot provide.
Capturing Sector Rotations: The Power of Deep Parsing
As market data suggests, the AI trade is creating winners and losers at a granular level. Investors are rotating out of overextended themes and moving into high-potential application layers. Communicating these shifts requires a presentation tool that understands document logic, not just text summaries.
Why Deep Parsing Matters
Standard AI tools often miss the nuances of financial reports. They might summarize a paragraph but fail to connect a footnote on interest rate sensitivity to a specific sectoral growth projection. A deep parsing pipeline that leverages layout intelligence reads the structure of your source files — whether PDF, Word, or Excel — preserving the relationships between data points that make analysis meaningful.
When you upload a research brief of the caliber provided by firms like Goldman Sachs, a well-designed parsing system identifies:
Macro Trends: The overarching market sentiment and federal policy impacts, including interest rate trajectories and fiscal stimulus programs that shape sector performance.
Micro Insights: Specific sector performance metrics and valuation gaps — for instance, the current P/E dispersion between Phase 1 hardware plays and Phase 3 software implementers.
Causal Relationships: Why certain sectors are rotating and the specific catalysts driving capital flow, such as earnings revisions, regulatory changes, or shifts in consumer adoption curves.
Nano Banana Pro: Elevating Financial Presentations
Tosea.ai's upcoming integration of the Nano Banana Pro model (built on the Gemini 3.1 architecture) represents a meaningful step forward for financial presentation workflows. Unlike lightweight models designed primarily for speed, the Pro version is built for high-consequence reasoning and sophisticated document interpretation — though it is worth noting that no AI model is a substitute for professional financial judgment.
Source Traceability: Reducing Hallucination Risk
In finance, an error in data can be catastrophic. Tosea.ai implements source traceability, meaning every slide generated by the Nano Banana Pro engine can be traced back to the specific source paragraph or data table in your research document. This significantly reduces hallucination risk and ensures that your pitch decks are grounded in the same rigor as the original research. That said, professionals should always verify critical figures before presenting them — AI traceability is a safeguard, not a guarantee.
The Consulting Aesthetic
High-stakes meetings require a specific visual language — one that conveys authority and clarity. Nano Banana Pro understands executive aesthetics. It avoids flashy, distracting designs in favor of the clean, grid-based, high-contrast layouts favored by top-tier consulting firms and investment banks. The result is output that looks like it was built by an experienced analyst, not generated by a chatbot.
Strategic Use Cases: From Market Intel to Actionable Decks
How do efficient teams use AI presentation tools to capitalize on the AI trade?
Scenario A: The Investment Committee Briefing
An asset manager receives an urgent update on sector rotations within the tech space. Instead of spending the night formatting slides, they upload the document to Tosea.ai. The AI extracts the core sector rotation logic and builds a 10-slide deck that highlights the rotation from hardware to software-as-a-service (SaaS) beneficiaries, complete with the original data tables and source citations.
Scenario B: Client Portfolio Reviews
Wealth advisors need to explain to clients why their portfolio allocation is shifting. Using an AI presentation tool, they transform complex macroeconomic data into clear, simple visuals that explain the AI scaling phase — making the strategy transparent and persuasive without requiring the client to read a 50-page research report.
Scenario C: Cross-Sector Thematic Research
A sell-side equity research team is preparing a thematic report that spans healthcare, industrials, and financial services — all sectors experiencing AI-driven margin expansion. The challenge is not just the volume of data but the need to maintain a consistent analytical framework across three very different industries. By uploading the individual sector reports into Tosea.ai, the team generates a unified presentation that maps each sector's AI adoption maturity against a common framework, enabling the audience to compare apples to apples across industries that are rarely analyzed together.
Limitations and Considerations
It is important to acknowledge the boundaries of AI in financial analysis and presentation generation.
Data Freshness. AI models work with the documents you provide. If your source material is outdated, the presentation will reflect outdated conclusions. Always verify that your inputs represent the most current available research.
Quantitative Precision. While AI parsing handles tables and charts well, complex multi-variable financial models with interdependent assumptions still benefit from human review. AI-generated presentations are strongest when used as a first draft that a knowledgeable analyst refines.
Regulatory Context. AI tools do not inherently understand the compliance requirements specific to your jurisdiction or firm. Any presentation destined for client-facing or regulatory use should pass through your standard review process regardless of how it was generated.
Market Uncertainty. Sector rotation analysis is inherently probabilistic. No tool, AI-powered or otherwise, can predict market movements with certainty. Presentations should frame AI trade themes as scenario-based analysis rather than deterministic forecasts.
Security and Professional Trust
In a professional environment, automation must be balanced with rigorous security. Any AI presentation tool handling financial data should ensure:
Data Isolation: Sensitive market research and proprietary trade ideas must be processed in a secure environment and never used to train public models. Tosea.ai maintains this standard as a baseline commitment.
Expertise in Structure: Models fine-tuned on professional document structures ensure the hierarchy of information is correct — the most important conclusions are elevated to the headline, supporting data appears in the right context, and appendix material stays where it belongs.
The Future of Strategic Communication
The AI trade is more than a market trend; it is a structural overhaul of how value is created and communicated. As sectors rotate and new winners emerge, the professionals who succeed will be those who can synthesize information and deliver it with speed and precision.
For financial professionals navigating these shifts, the combination of deep market intelligence and efficient presentation workflows is becoming essential. Whether you are preparing for an investment committee meeting or a client review, the ability to move from raw research to polished narrative quickly is what separates timely insight from stale analysis.
If you are looking for a tool purpose-built for this workflow, Tosea.ai offers a free tier to explore how AI-powered document-to-presentation conversion fits into your process.
FAQ: Navigating the Intersection of AI and Finance
Q: Can Tosea.ai process a 200-page investment prospectus?
A: Yes. The agentic engineering pipeline is designed specifically to handle long-context documents. It segments the file into logical parts, parses the data with Nano Banana Pro, and then re-synthesizes it into a cohesive, structurally sound presentation.
Q: Does the AI understand financial terminology and macro trends?
A: Yes. The models are trained on professional and financial document structures, enabling them to recognize concepts like sector rotation, EBITDA margins, and capital expenditures (CapEx) without losing context. That said, domain-specific jargon unique to your firm should be reviewed in the output.
Q: Is the generated output editable?
A: Yes. Tosea.ai exports to a fully editable .pptx format. While the AI creates the logical skeleton and professional design, you retain full control over the final polish and specific data points.
Q: How does Tosea.ai handle charts and financial tables?
A: The deep parsing pipeline recognizes tabular data, chart structures, and their associated labels. When generating slides, it preserves the original data relationships and presents them in clean, presentation-ready formats. Complex multi-sheet Excel models may require some manual adjustment after generation.
Q: What is the typical turnaround time for a financial presentation?
A: For a standard 50-page research document, the end-to-end process from upload to a polished draft deck typically takes under five minutes. Longer documents or those with extensive embedded charts may take slightly more time, but the output is still orders of magnitude faster than manual slide creation.
Q: Can I use Tosea.ai for compliance-sensitive presentations?
A: The tool generates presentations from your source material with source traceability, which supports compliance review. However, any presentation intended for regulatory submission or client-facing distribution should still go through your firm's standard compliance review process. AI-generated content is a starting point, not a final compliance-cleared deliverable.