


RFM analysis prompts for PowerPoint
Four Deloitte-style prompts for CRM, marketing and customer strategy teams. They explain recency, frequency and monetary value to executives, map all eight RFM segments to actions, design measurable treatments and show where RFM fits by industry.
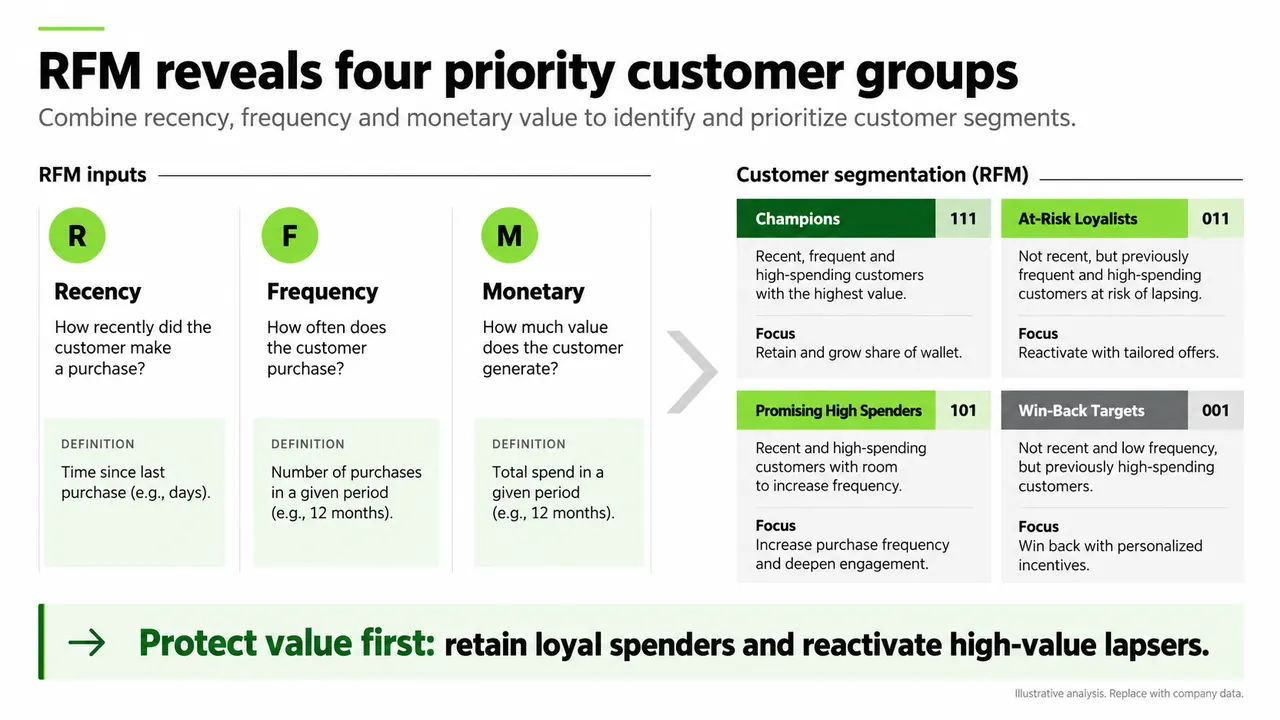
RFM analysis prompt
Pick a slide, fill in any highlighted fields, then copy or run it.
Create one 16:9 executive RFM analysis slide for a customer strategy review.

Show Recency, Frequency, and Monetary value with one plain-English definition and one calculation note for each. Present four priority segments: 111 Champions, 011 At-Risk Loyalists, 101 Promising High Spenders, and 001 Win-Back Targets. Add one action for every segment and finish with a conclusion-led recommendation.

Use a white background, black type, vivid green highlights, pale mint support areas, and a precise consulting grid. Do not use logos. Label every figure as actual, estimated, or illustrative. Do not invent missing data.
Build one 16:9 RFM customer action map using the eight binary combinations from 000 to 111.

For every cell, show segment name, behavioral description, recommended action, and owner. Use customer activity on the horizontal axis and customer value on the vertical axis. Read every code in R-F-M order, so all high-value codes (ending in 1) sit in the top row. Highlight 111 as the priority group. Add the scoring threshold, analysis period, observation date, and customer count in a source note.

Use a restrained green consulting palette and a conclusion-led title. Keep the original data and terminology. Flag any segment that lacks an agreed treatment.
Create one 16:9 CRM treatment slide for three RFM segments: Champions, At-Risk Loyalists, and Promising High Spenders.

For each segment, specify objective, treatment, channel, trigger timing, owner, and success metric. Add a measurement strip covering holdout group, incremental revenue, margin after incentive, unsubscribe rate, and test duration. Separate source facts from proposed actions.

Use a white background, dark green headers, lime emphasis, compact tables, and generous whitespace. Do not claim that a treatment works unless experimental results are provided.
Create one 16:9 industry applicability slide for the RFM model.

Compare beauty, grocery, quick-service restaurants, telecom, auto service, and industrial equipment. For each sector, show repeat purchase signal, typical RFM fit, required adjustment, and decision use. Rate fit as high, medium, or low only when the stated purchase logic supports the rating.

Use a simple consulting table with green emphasis and one takeaway banner. Mark the content as an application guide rather than empirical evidence.
Why these prompts work
Codes are read in one order
The action map prompt says to read every code in R-F-M order, so all high-value codes ending in 1 sit in the top row. Without that rule, segment grids get scrambled.
Source notes carry the method
It asks for the scoring threshold, analysis period, observation date and customer count in a source note. Those four details decide whether segments can be compared.
Treatments need a holdout
The treatment prompt adds a strip with holdout group, incremental revenue, margin after incentive, unsubscribe rate and test duration, and bans claiming a treatment works without results.
Fit ratings need a reason
The industry prompt rates fit as high, medium or low only when the stated purchase logic supports it, and labels the page an application guide rather than evidence.
Adapt it to your own deck
Score your own customer file
Attach the transaction export and add "Calculate binary R, F and M scores from the attached file, and state each threshold and the observation date."
Rename segments to match your CRM
If your team already has segment names, ask the model to keep them: "Use our segment names from the attached glossary and map them to the RFM codes."
Change the palette for your brand
The prompts ask for white, black type and vivid green highlights. Swap in your brand colors and keep a single highlight color for the priority segment.
RFM analysis FAQ
What is RFM analysis?
RFM analysis segments customers by recency (how recently they bought), frequency (how often) and monetary value (how much they spend). With a high or low score on each measure, you get eight segments, coded 000 to 111.
Is this an official Deloitte template?
No. Deloitte-style describes the clean consulting look these prompts request: white space, one green accent and conclusion-led titles. Tosea is not affiliated with Deloitte.
Can I use these prompts in ChatGPT, Claude or Gemini?
Yes. A chat assistant will return segment definitions, actions and an outline as text. In Tosea you attach your customer data with the prompt and get slides you can edit and export to PowerPoint.
Deloitte-style describes a common consulting framework. Tosea is not affiliated with Deloitte. Figures on the example slides are illustrative.
Prefer not to write a prompt?
Upload the document. Tosea drafts the deck, you edit and export.
Start for free