Critical success factors prompt
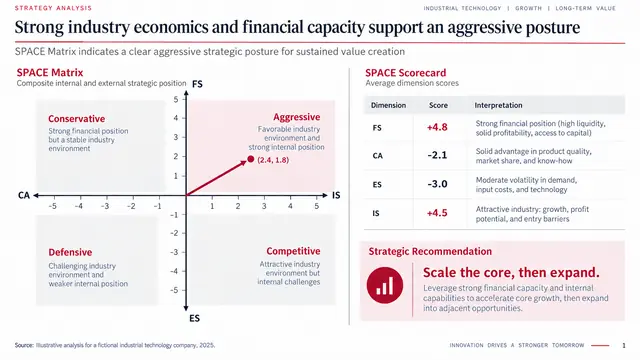
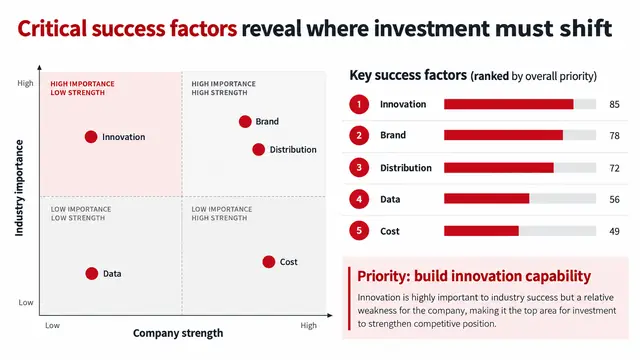
Scores industry importance against company strength and names the two capabilities that deserve more investment.
Consulting · Bain-style · Example slide
A free prompt library for PowerPoint and Google Slides. Copy-ready prompts for consulting frameworks, research talks, business reviews and investor decks, most shown with the slide they produced.
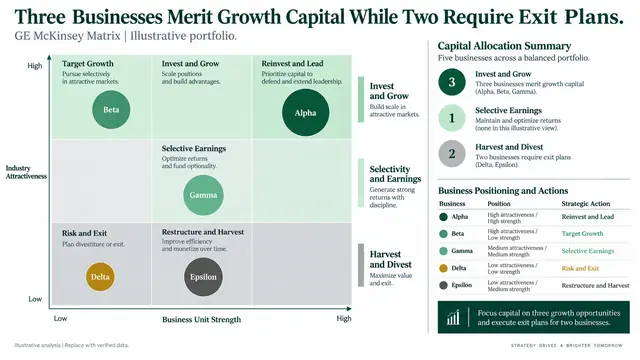
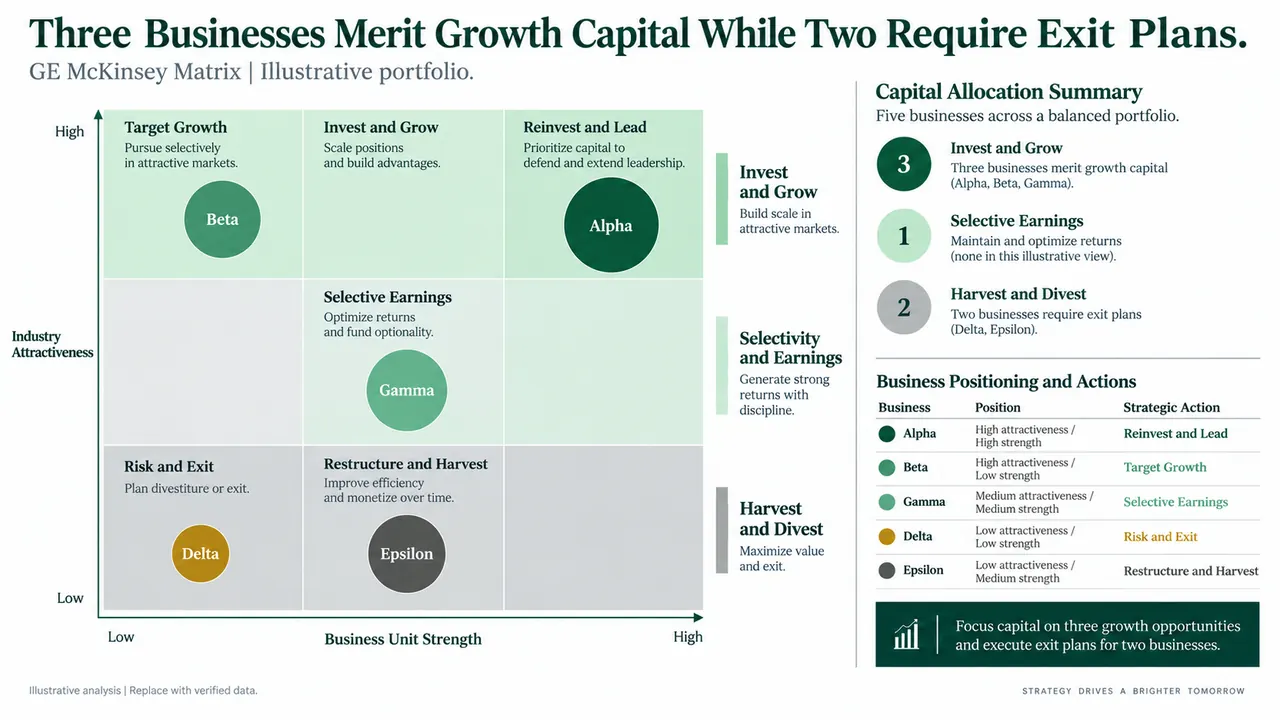
Create a 16:9 executive strategy slide titled Portfolio choices favor Digital Services and Specialty Solutions. Build a GE McKinsey nine-box matrix with industry attractiveness on the vertical axis and business unit strength on the horizontal axis. Plot five labeled bubbles sized by annual revenue. Use dark green for invest and grow, pale green for selective investment, and light gray for harvest or divest. Add a right-side panel with three portfolio recommendations, capital implications, and one key risk. Use a clean white background, precise alignment, restrained icons, small source notes, and editable chart elements. Do not add company logos.
State six things: what to build from, who will watch, what they must decide, how the deck is structured, what counts as evidence, and what file you need back. Every prompt in this library follows that pattern.
Create a 10-slide executive presentation from the attached report.
Audience: business unit leaders with five minutes to review before a meeting.
Goal: explain the decision, the evidence, the financial effect, and the next action.
Use takeaway titles, one main message per slide, and a restrained consulting style.
Rebuild simple charts as editable objects. Add source notes for every material number.
Export an editable PPTX. Check overflow, alignment, contrast, and font substitution.
McKinsey-, BCG- and Bain-style strategy frameworks.
Conference talks, defenses, journal clubs and lectures.
QBRs, board decisions, dashboards and reviews.
Pitch decks, investor updates and financial reviews.
Launch plans, campaign reviews and monthly reports.
Themes, chart styling and slide redesign.
Scores industry importance against company strength and names the two capabilities that deserve more investment.
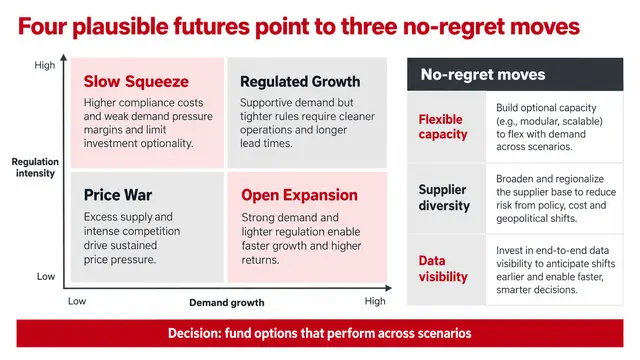
A Bain-style prompt for strategy and planning teams that builds one four-scenario slide.
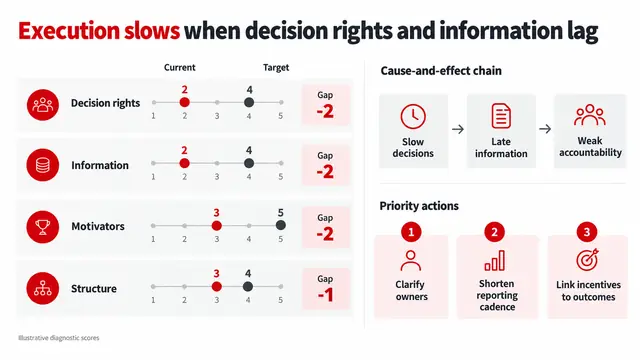
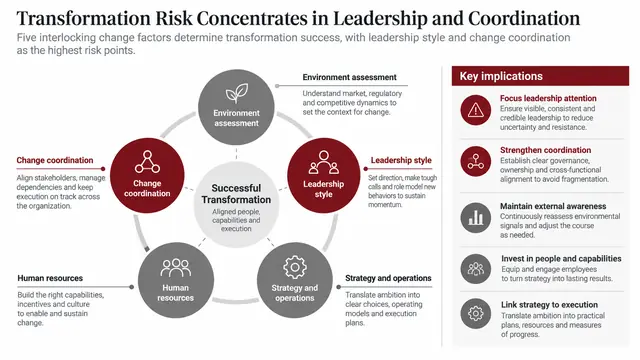
A Bain-style prompt for transformation leads, HR and strategy teams.
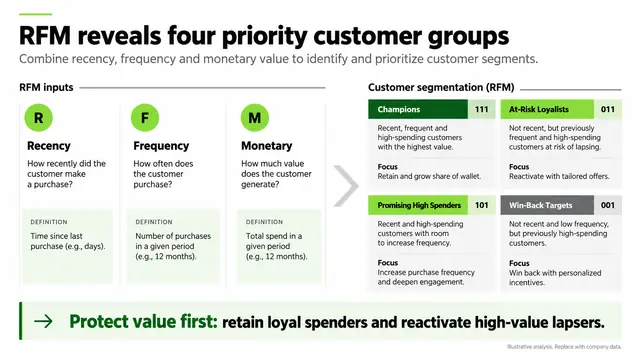
Four Deloitte-style prompts for CRM, marketing and customer strategy teams.
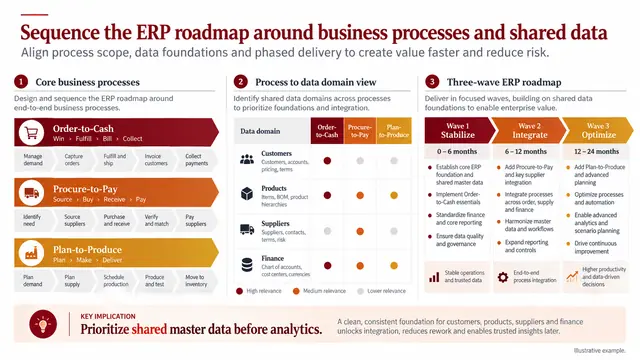
A PwC-style prompt for one information systems roadmap slide based on Business Systems Planning.
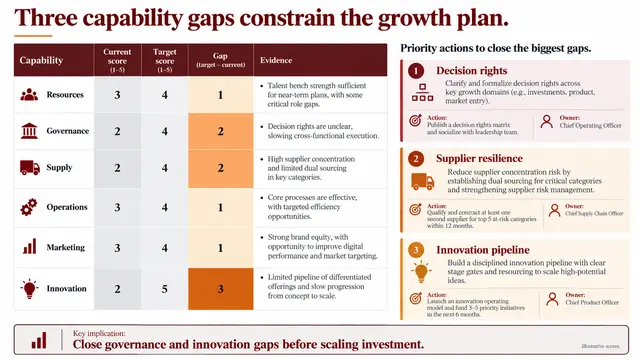
A PwC-style prompt for one capability gap slide built from interviews and operating data.
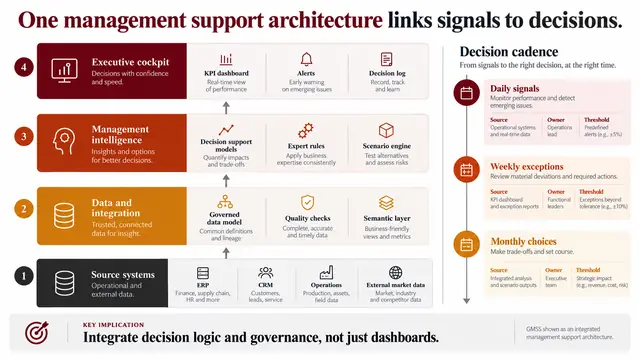
A PwC-style prompt for one slide describing an integrated management support system, sometimes labeled GMSS.
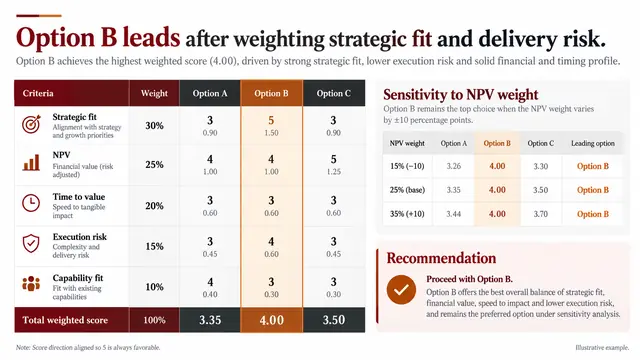
A PwC-style prompt for one option-selection slide.
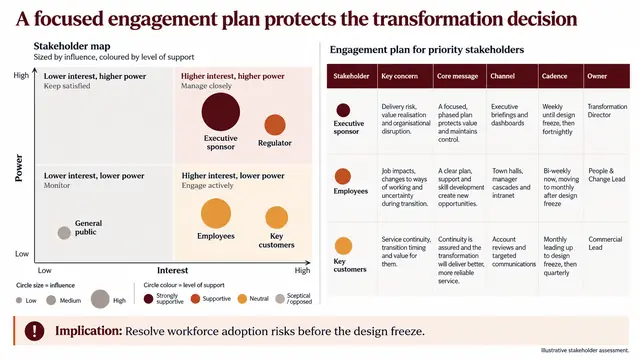
A PwC-style prompt for one stakeholder slide built from a transformation plan.
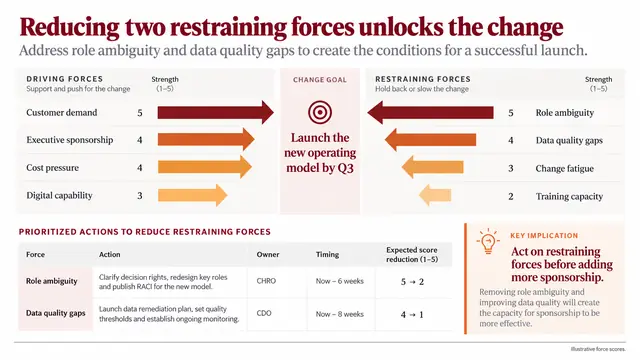
A PwC-style prompt for one force field slide built around a stated change goal.
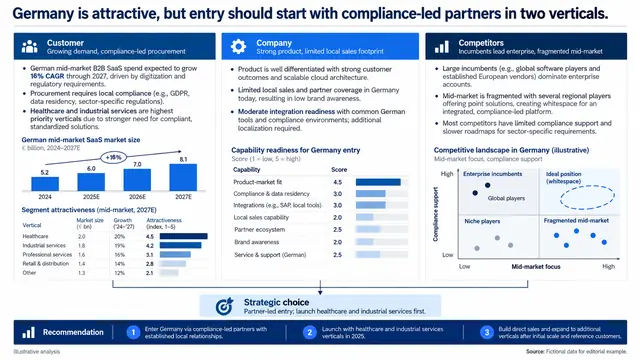
Organizes customer, company and competitor evidence around one market entry decision and ends in a route-to-market call.
Two McKinsey-style prompts for operations and transformation teams.
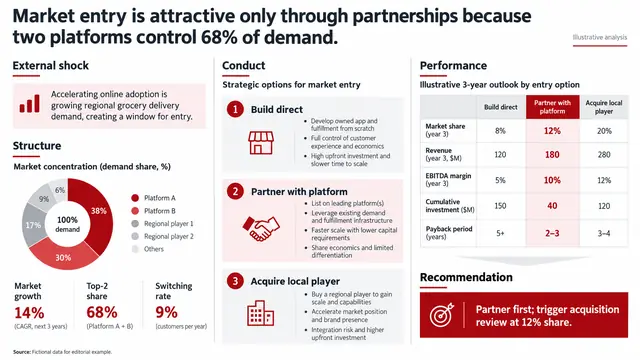
Links an external shock and market concentration to three entry options and a three-year performance view.
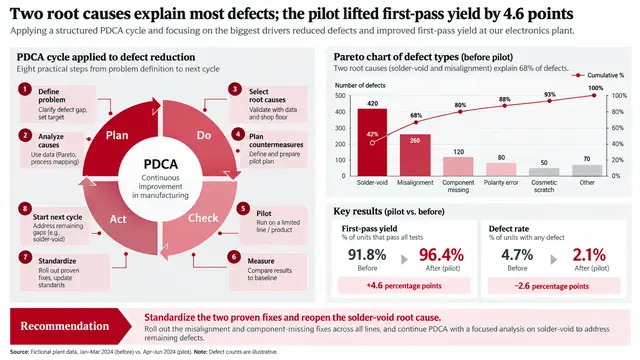
Four Bain-style prompts that turn a Plan-Do-Check-Act improvement effort into one executive slide each.
Three BCG-style prompts for structuring a consulting presentation.
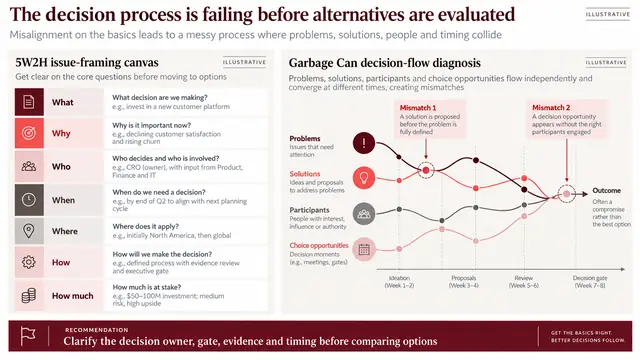
Frames a messy decision with a 5W2H canvas and maps where problems, solutions, people and timing fail to meet.
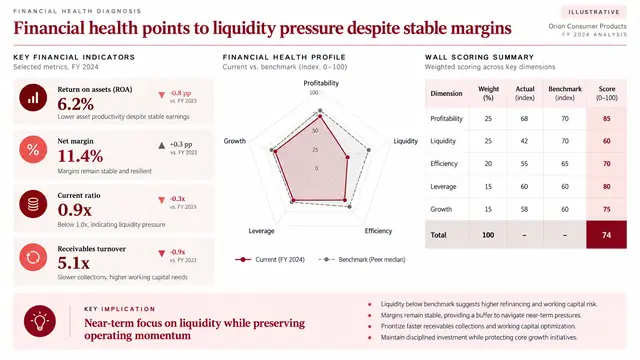
Combines ratio KPI cards, a benchmark radar chart and a weighted Wall scorecard, with formulas in the footnote.
Four Bain-style prompts for strategy teams that build one SPACE matrix slide per strategic posture.
Plots business units on a nine-box grid with revenue-sized bubbles and a capital allocation panel.
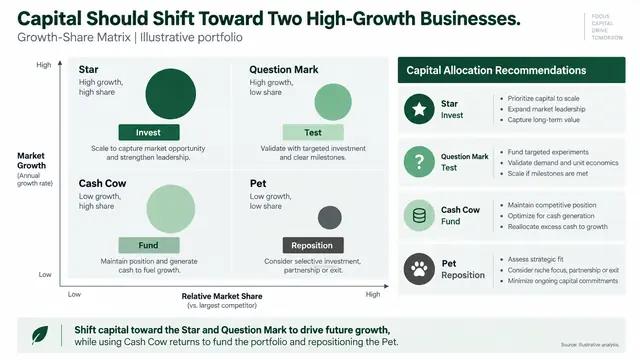
A BCG-style prompt for one executive portfolio slide.
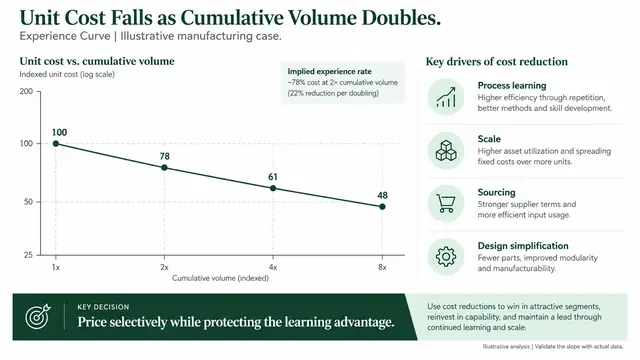
A BCG-style prompt for one slide that tests whether accumulated volume is lowering your costs.
A BCG-style prompt that turns a list of strategic options into one action matrix.
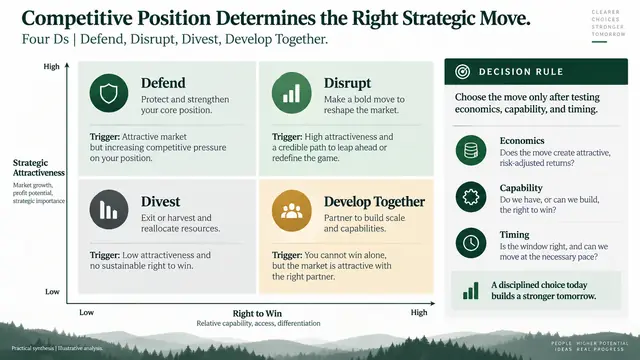
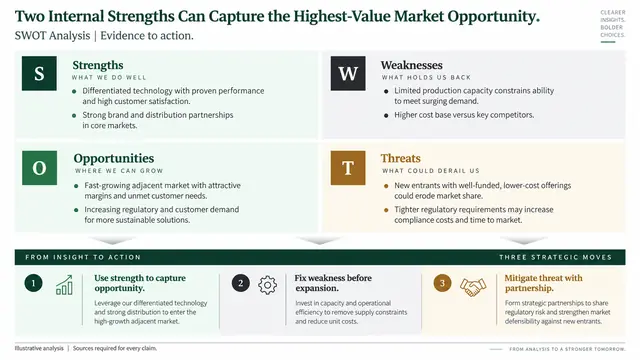
A BCG-style prompt for one SWOT slide that ends in action.
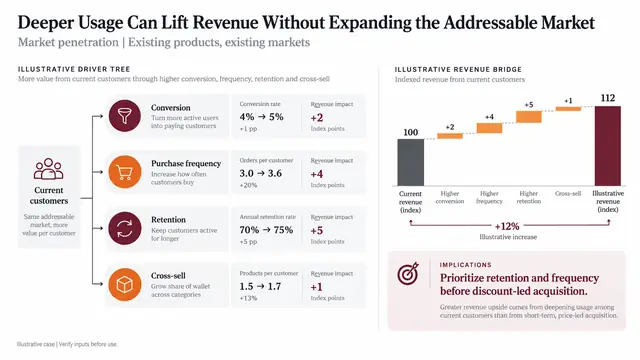
Four PwC-style prompts, one for each Ansoff growth route.
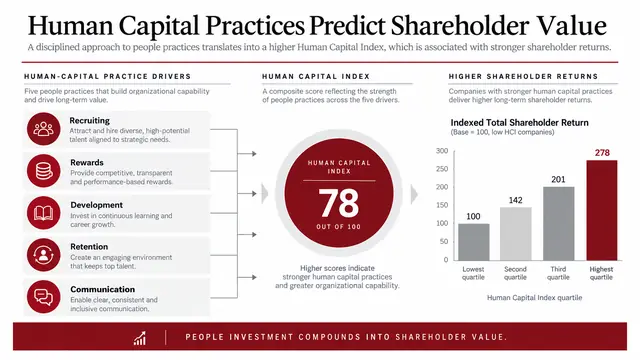
A PwC-style prompt for one HR strategy slide based on the Watson Wyatt Human Capital Index.
A PwC-style prompt for one change readiness slide.
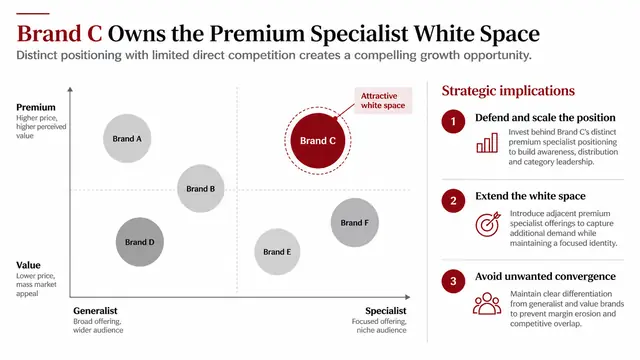
A PwC-style prompt for one brand positioning map built from customer data.
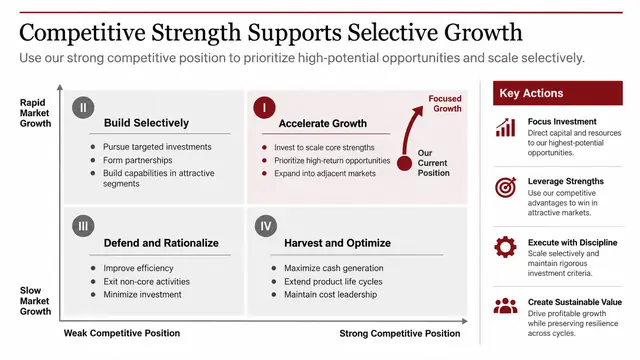
A PwC-style prompt for one Grand Strategy Matrix slide.
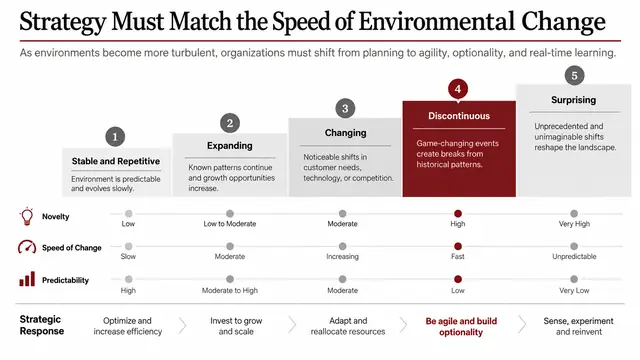
A PwC-style prompt for one strategy slide based on Ansoff's environmental turbulence model.
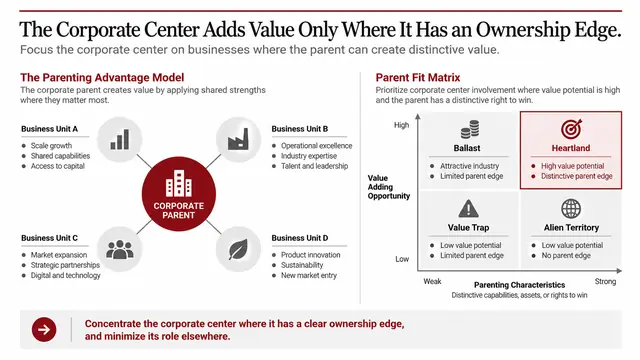
A PwC-style prompt for one corporate strategy slide on parenting advantage.
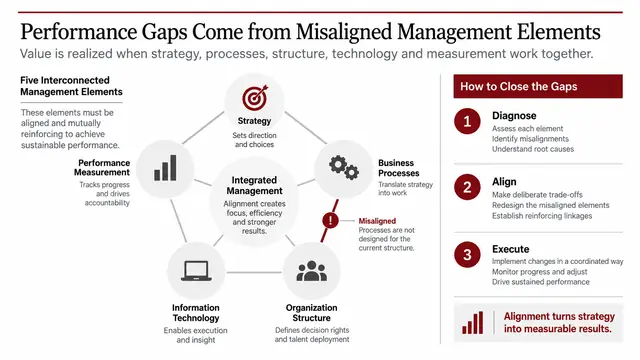
A PwC-style prompt for one diagnostic slide that checks whether strategy, processes, organization, technology and performance measurement support each other.
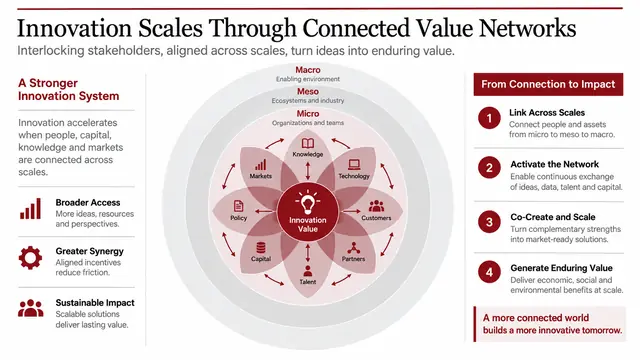
A PwC-style prompt for one innovation ecosystem slide drawn as a lotus.
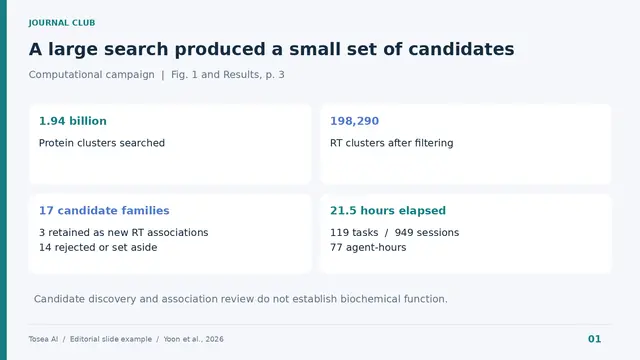
Shows the funnel from 1.94 billion clusters to 3 retained associations, with compute effort kept in separate units.
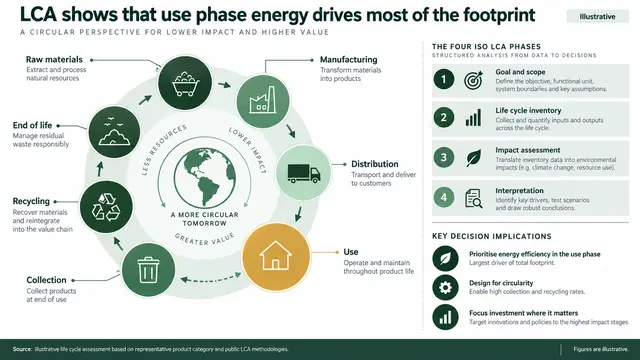
Links the product journey to the four ISO LCA phases under a verified action title, with implications and a limit.
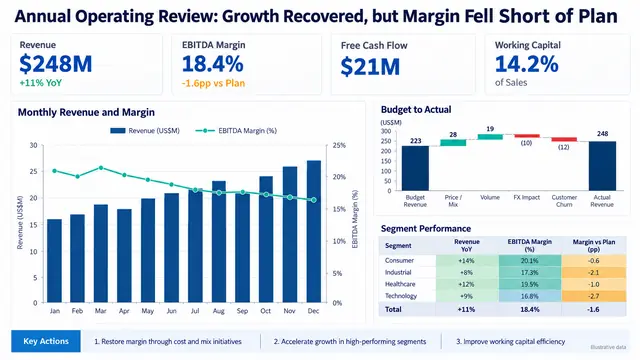
Turns an Excel workbook into a full-year review slide with KPI cards against plan, a budget waterfall and a segment heatmap.
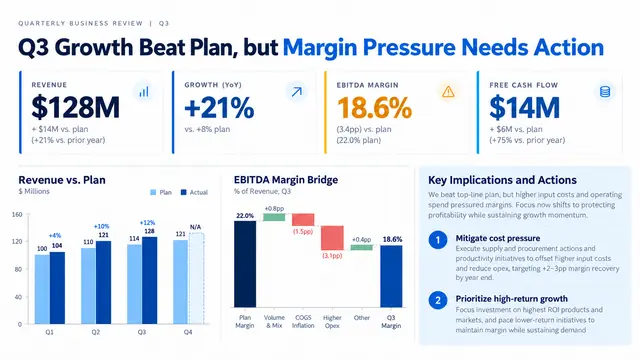
A prompt for a 10-slide quarterly business review aimed at an executive committee.
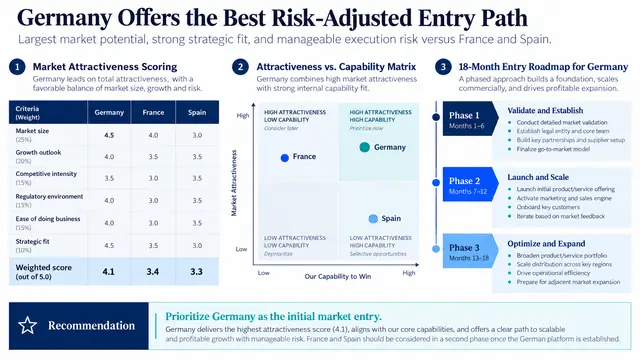
A prompt for a 12-slide market entry recommendation for a CEO and investment committee.
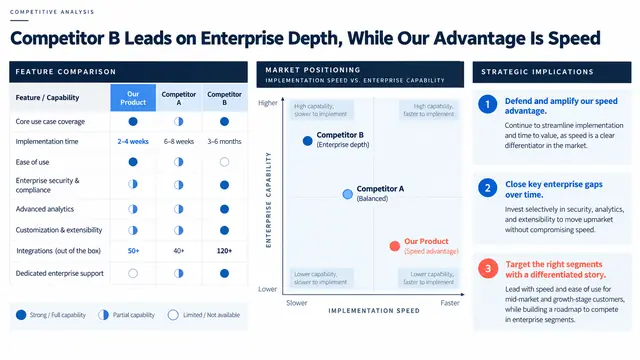
A prompt for an 8-slide competitive analysis that compares your product with two competitors for product and commercial leaders.
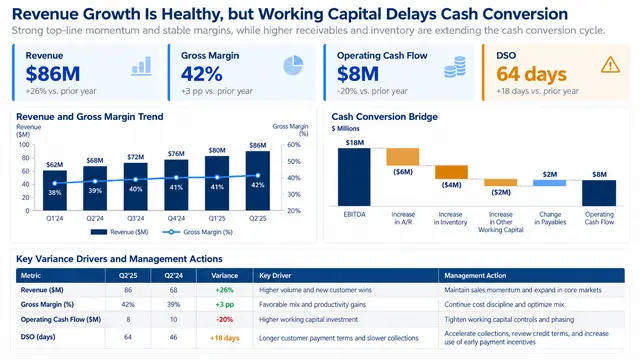
A prompt that turns management accounts into a 9-slide financial diagnosis for a CFO and business unit leaders.
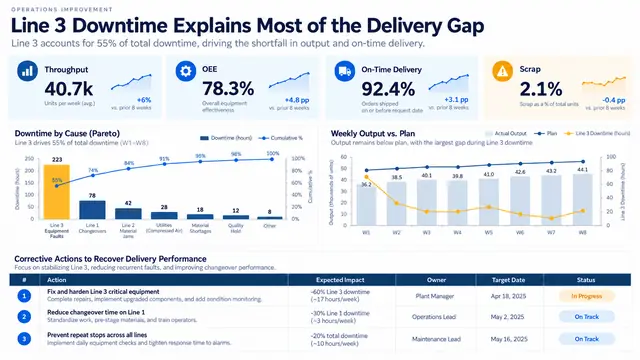
A prompt for a 10-slide operations review aimed at a COO, plant managers and supply chain leads.
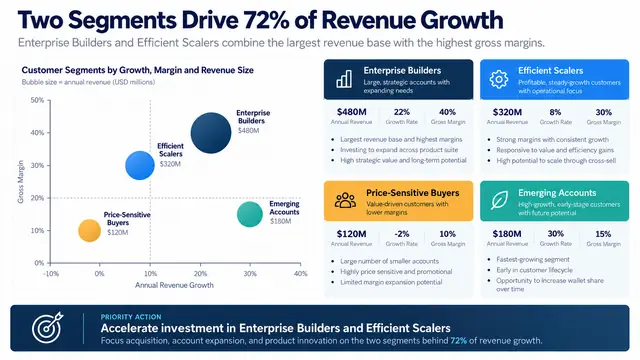
A prompt for a 9-slide customer segmentation deck for revenue and marketing leaders.
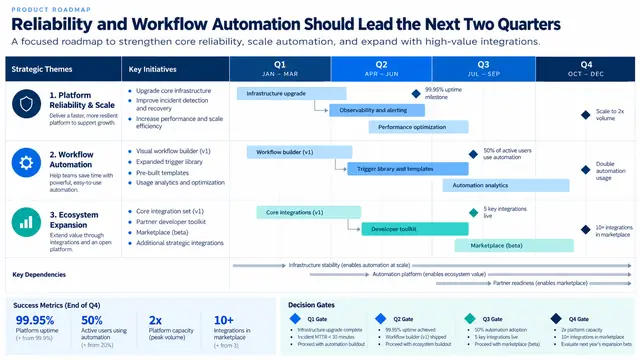
A prompt for an 11-slide, four-quarter product roadmap for executives, product, engineering and go-to-market leaders.
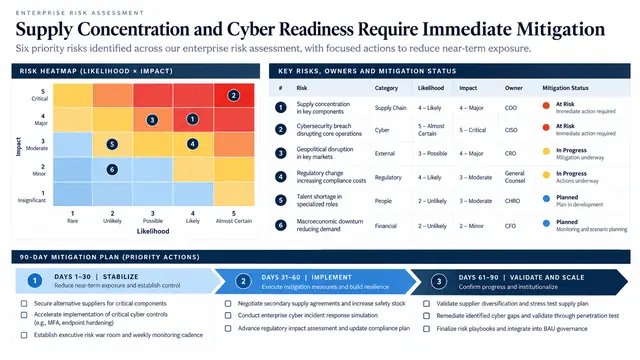
A prompt for an 8-slide enterprise risk assessment for an executive risk committee.
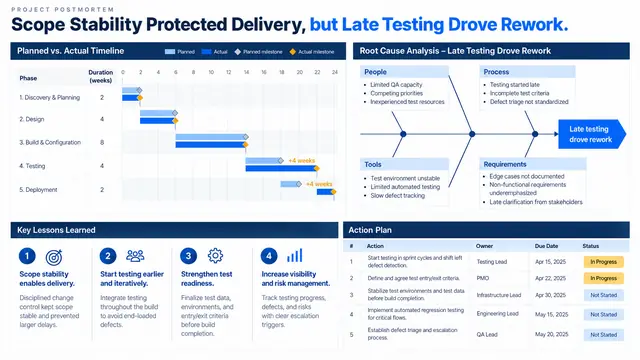
A prompt for a blameless 7-slide project postmortem for a steering committee and delivery team.
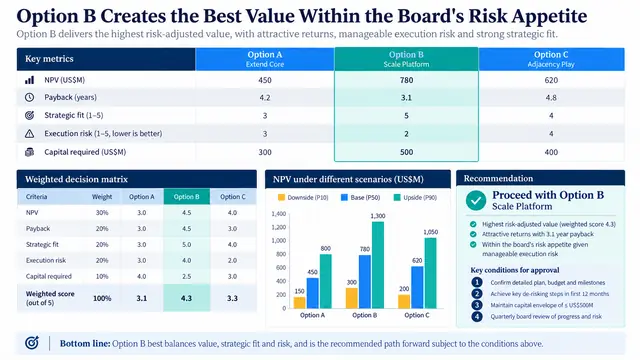
A prompt for a 10-slide board deck that compares three investment options on strategic fit, NPV, payback, capital and execution risk.
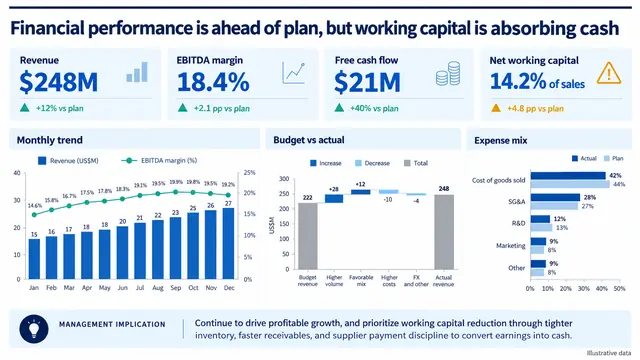
Builds a one-slide CFO dashboard tracking revenue, margin, cash and working capital, with waterfall steps that reconcile.
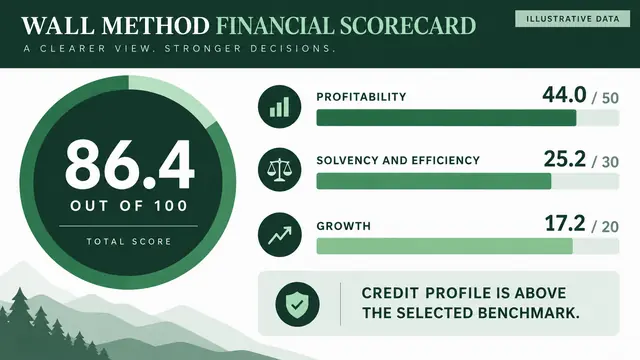
Shows a financial health score out of 100 with category contributions of 50, 30 and 20 under a decision title.
Builds a decision-led strategy deck after choosing one enterprise model, such as STRATPORT or V Matrix, and stating its limits.
Builds a 10-slide strategy deck that ends in a preferred option and first 90-day actions, with an outline for review first.
Builds a nine-slide 3C growth strategy deck with action titles and an appendix, after a reviewable outline step.
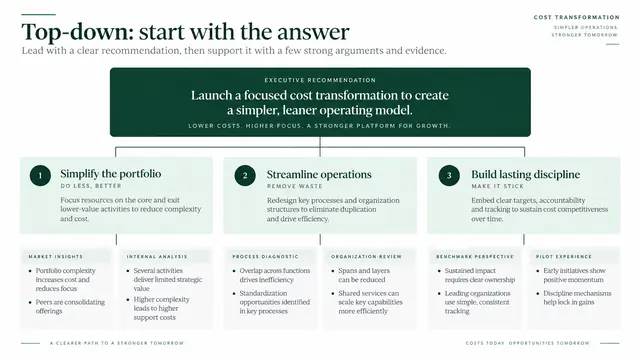
Turns attached material into a conclusion-first 16:9 deck with action titles, source notes and an outline approval step.
Outlines 10 slides on a paper's problem, prior work, intuition and method, tagging each claim by evidence type with page citations.
Builds 10 to 12 timed conference slides with conclusion titles, three points each, sourced visuals and speaker notes.
Maps a 30-minute defense by chapter with timing, transitions, backup slides and five likely committee questions.
Builds 9 appraisal slides plus discussion: design diagram, results visual from reported data and a strengths-and-limits table.
Turns a methods section into four slides with one running example and every equation symbol, unit and dimension defined.
Builds up to five results slides, each with one claim, one chart, one interpretation and one stated limitation.
Groups supplied papers by method or question, compares where they conflict and ends on the gap your study fills.
Builds an 8-slide briefing for adjacent-field specialists, defining shorthand while keeping every quantitative qualifier.
Compresses a study into question, method and result regions readable in 20 seconds, with exact copy and alt text.
Ranks likely reviewer questions by likelihood and consequence and drafts sourced answers for the top ten.
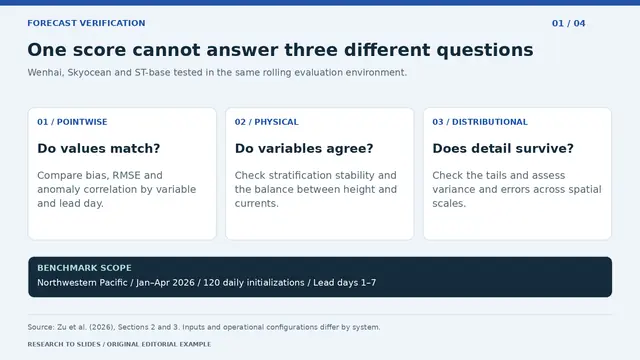
Frames an AI ocean forecast benchmark through three evaluation lenses instead of one accuracy ranking.
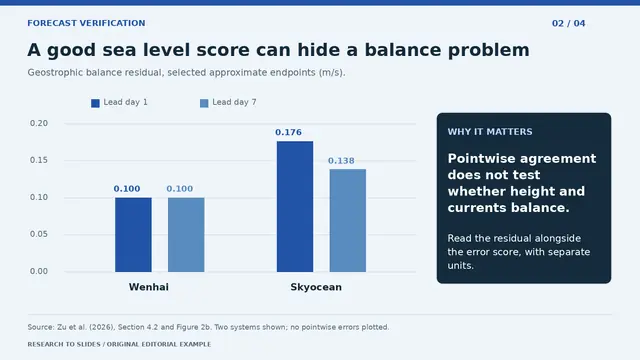
Plots balance residuals next to accuracy claims to show that low error does not prove physically coherent currents.
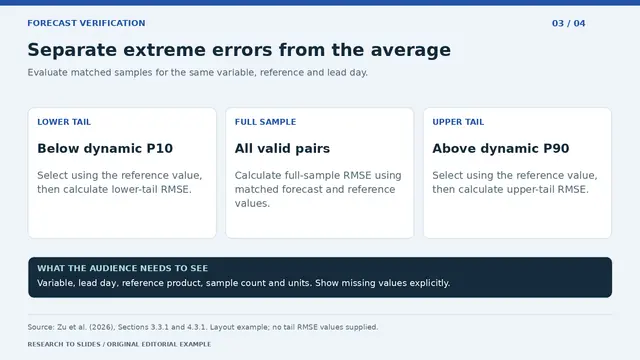
Compares error in the lower tail, all samples and upper tail, marking missing values as not supplied.
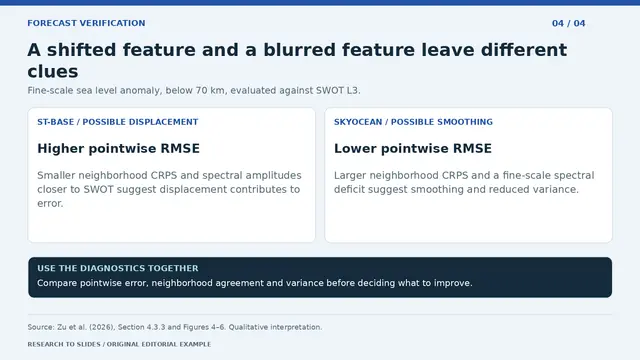
Uses RMSE, neighborhood CRPS and spectral variance to separate displaced features from smoothed ones.
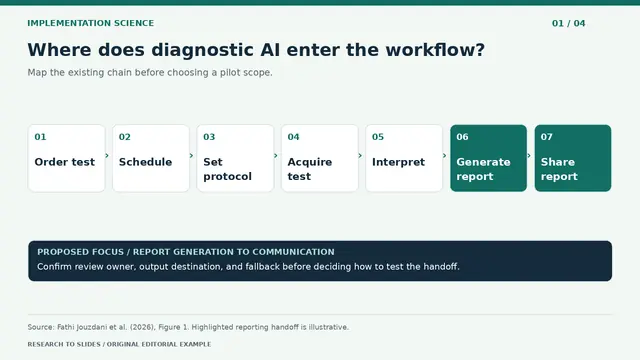
Draws a seven-stage diagnostic chain, highlights the pilot scope and adds review owner, output and fallback fields.
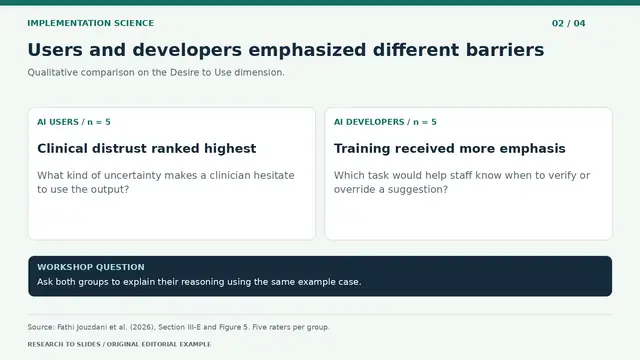
Sets AI user and developer barrier themes side by side, with one proposed follow-up question per group.
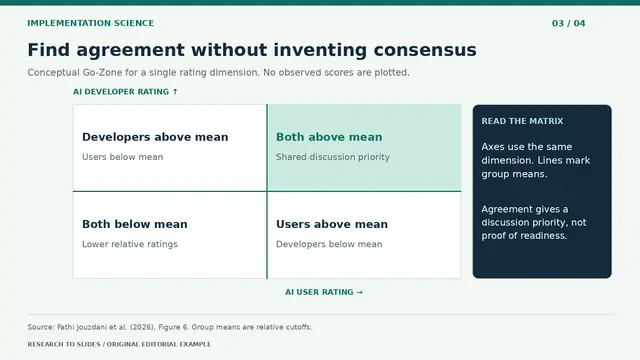
Builds a 2x2 grid of user and developer ratings split at group means, noting that agreement does not prove feasibility.
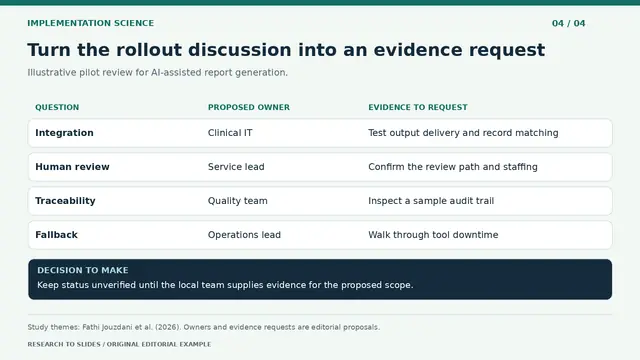
Turns barrier research into a pilot table for integration, human review, traceability and fallback, with owners.
Separates publication output from assessed understanding in a labeled conceptual model for a hiring committee.
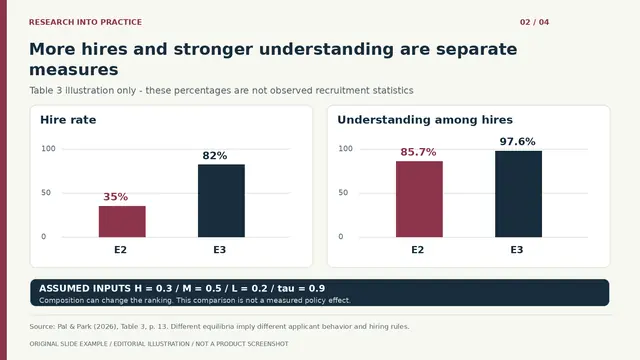
Compares hire rates and understanding across two equilibria, labeled as illustrative model output with assumptions shown.
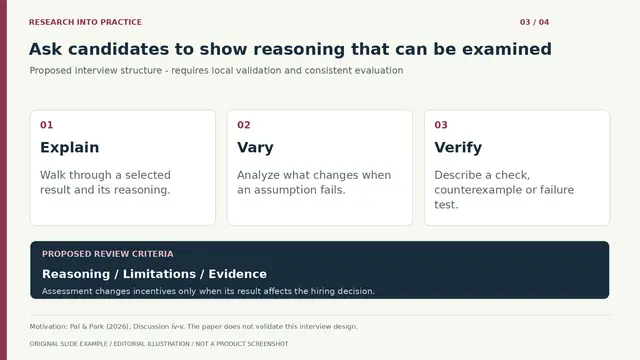
Proposes a three-stage interview (explain, change an assumption, verify) with blank criteria marked unvalidated.
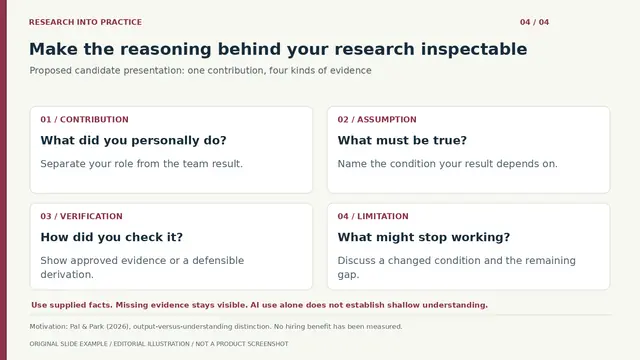
Structures a candidate talk slide around contribution, assumption, verification and limitation from your own notes.
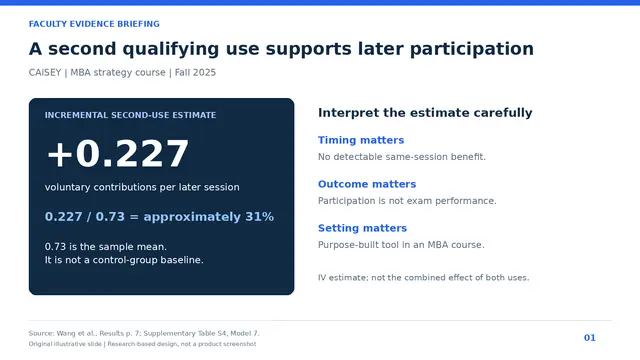
Explains an education study's effect estimate, its baseline and three stated limits without overselling the result.
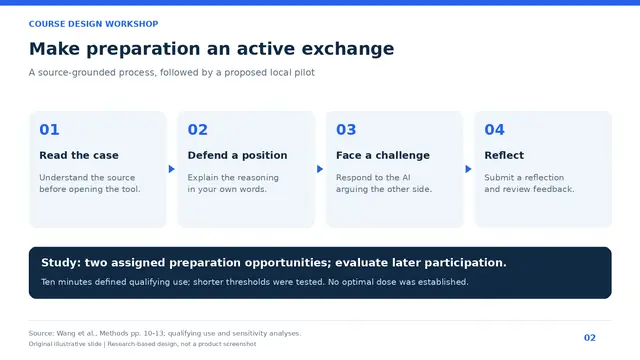
Maps a four-stage AI voice practice sequence and labels any local rollout as an adaptation of the study.
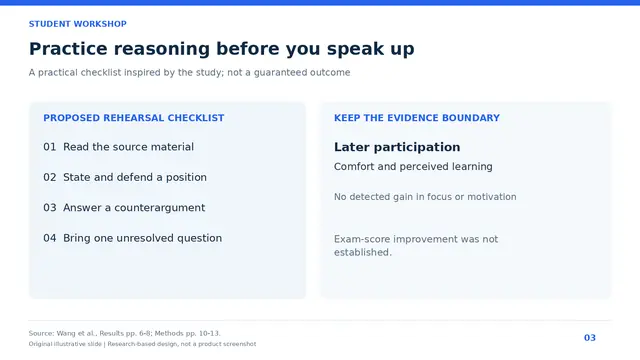
Pairs a rehearsal checklist with a clear split between outcomes the study found and outcomes it did not show.
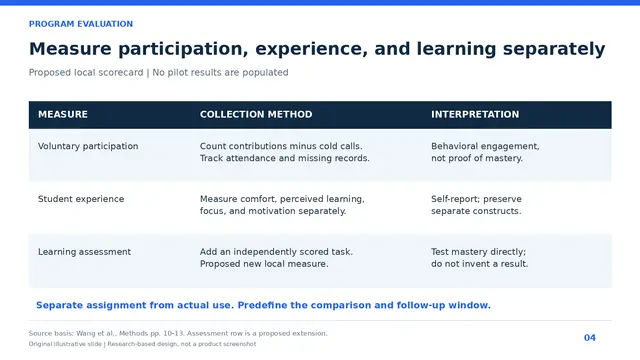
Sets participation, experience and learning measures for a classroom AI pilot, left empty of invented results.
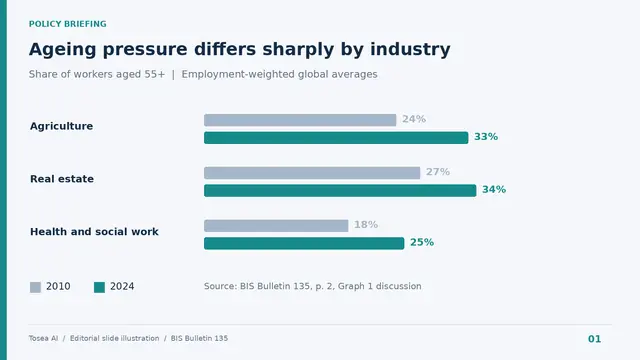
Compares 2010 and 2024 shares of workers aged 55+ in three sectors with paired bars and a conditional takeaway.
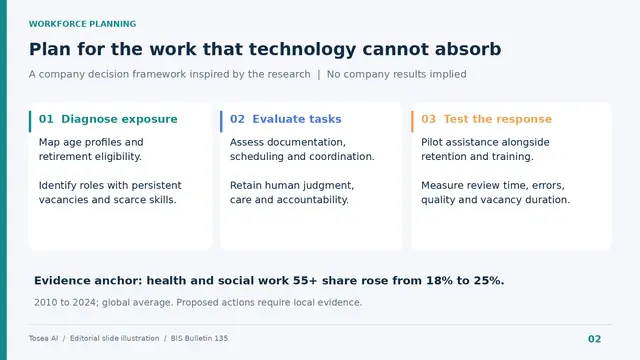
Lays out diagnose, assess and test stages for task pilots and lists required inputs where company data is missing.
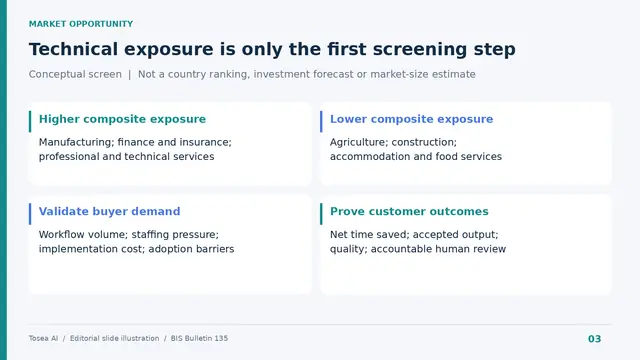
Splits sectors by AI and robot exposure and adds a demand validation panel, labeling commercial ideas as hypotheses.
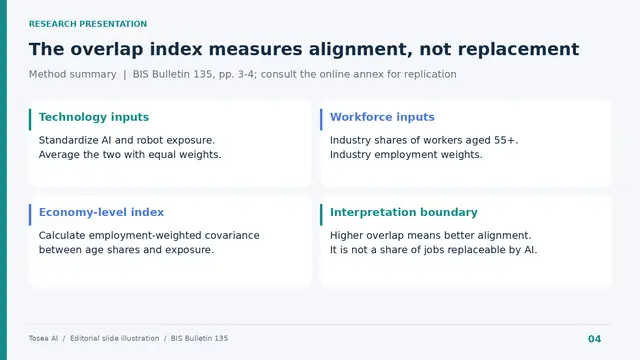
Explains how an employment-weighted overlap index is built and what it does not measure, before any conclusion.
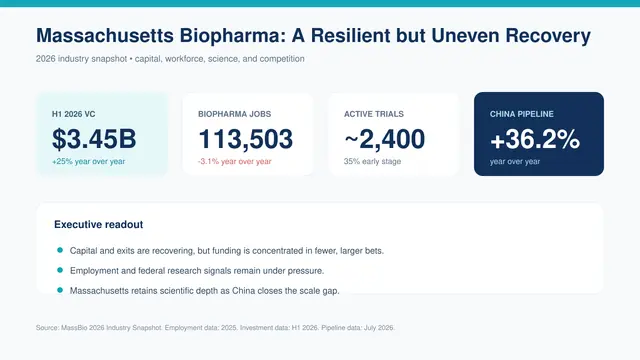
Four metric cards with reporting periods and three conclusions that summarize a regional biopharma sector report.
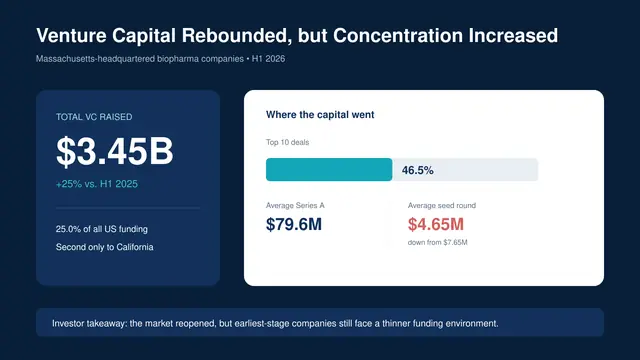
Shows a funding rebound next to top-10 deal concentration and the Series A versus seed gap, all source-linked.
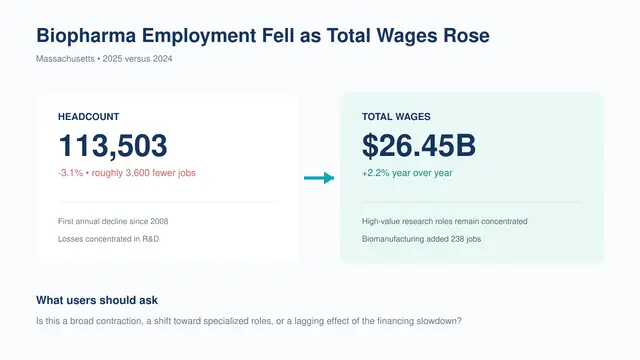
Contrasts falling jobs with rising total wages and adds a discussion question instead of a forced explanation.
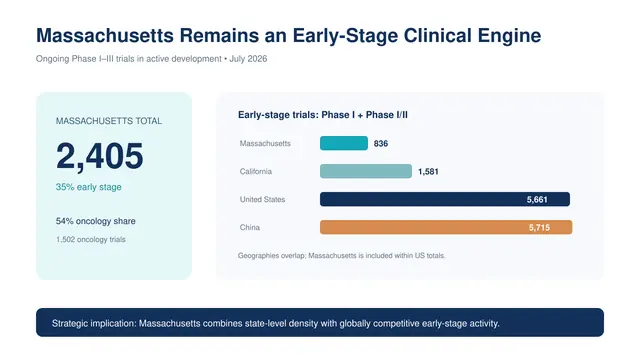
Compares early-stage trial counts across regions with a footnote that overlapping geographies cannot be summed.
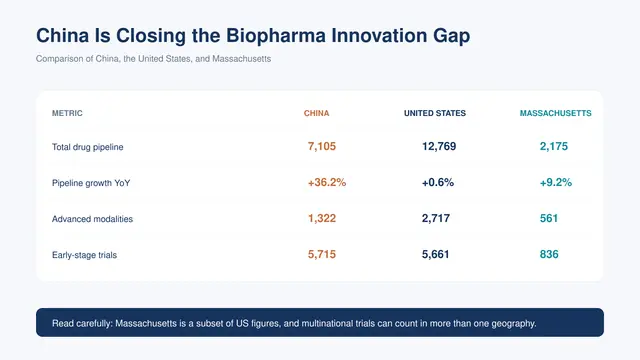
Benchmarks China, the US and Massachusetts on pipeline size, growth, advanced modalities and early-stage trials.
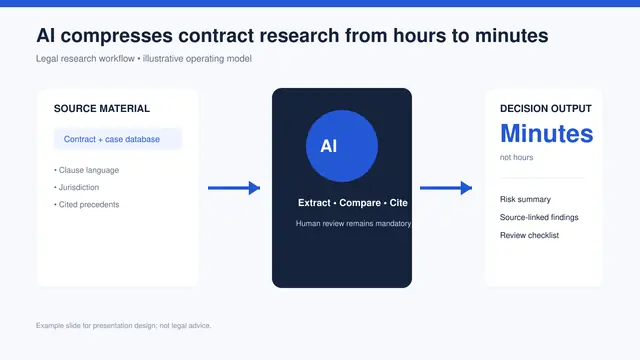
Maps source material, AI analysis and decision output for contract research, ending with required human approval.
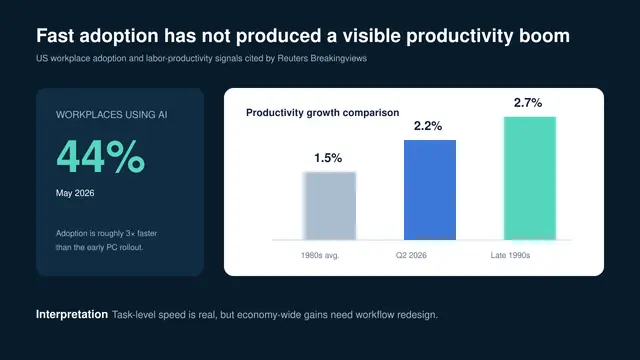
Places a 44 percent adoption figure beside three productivity growth bars, each labeled with its measurement basis.
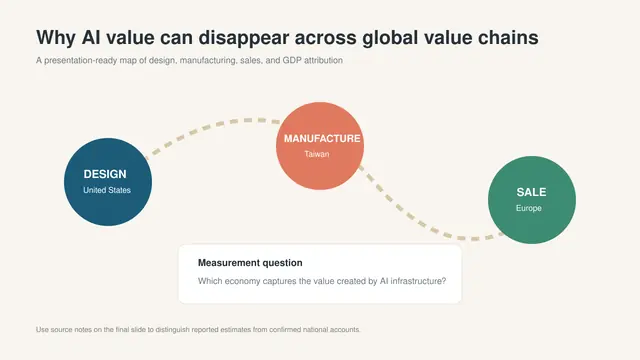
Traces AI chip design, manufacturing and deployment across three regions and asks which economy captures the value.
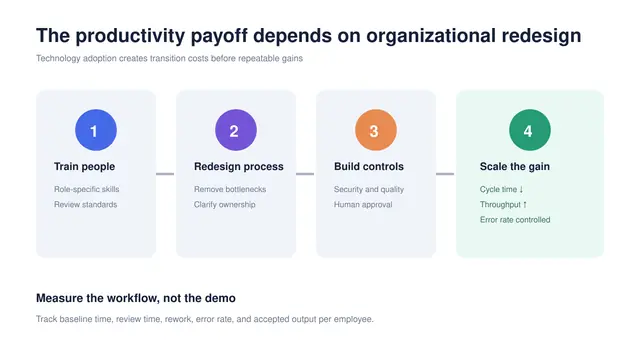
Four sequential stage cards with two actions each and a measurement row for cycle time, rework and error rate.
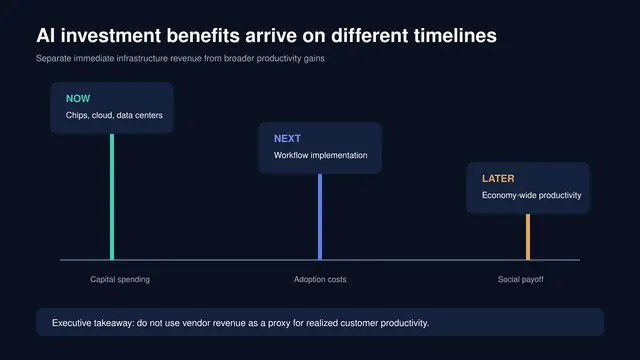
Splits AI benefits into now, next and later milestones and warns against using infrastructure revenue as a productivity proxy.
Builds a 12-slide seminar from a review paper with speaker notes and a source page for every claim, outline first.
Structures a talk from background to conclusion and keeps each figure tied to the claim it supports.
Sets an ML-conference look: blue and white, one idea per slide, architecture diagrams, benchmark and ablation tables.
Figure-first life science slides with colorblind-safe palettes, scale bars, heatmaps and statistics on every plot.
Grand rounds style slides with CONSORT flow, Kaplan-Meier curves, forest plots and finding-first titles.
Investment-research deck with an executive summary first, standard valuation tables and sourced, editable charts.
Climate research slides with map conventions, diverging anomaly scales and uncertainty ranges on every projection.
Management research slides with conceptual models, numbered hypotheses, regression and SEM tables and coded quotes.
Technical talk slides with units on every axis, error bars, numbered equations and grayscale-safe colors.
Accessible slides for interdisciplinary venues with WCAG-safe colors, bias audit tables and fairness trade-off plots.
Merges three research PDFs, shows where their data agree and conflict, and highlights knowledge gaps for a committee.
Turns a full dissertation into 18 to 22 defense slides with a clear method progression and a limitations slide.
Builds a 20-slide talk from introduction to conclusion with citation placeholders and data-heavy results slides.
Allocates 14 slides by section, one per major finding, with the paper's own figure as each result's main visual.
Structures a medical conference talk from clinical need through endpoints, adverse events and comparative effectiveness.
Converts a paper into 15 standard-structure slides, emphasizing results figures and capping text at 30 words per slide.
Turns a report into a 10-slide executive deck with takeaway titles, a source note for every material number and an editable PPTX.
Compares local power expansion with computation-transfer siting on one slide, with a cost callout and stated exclusions.
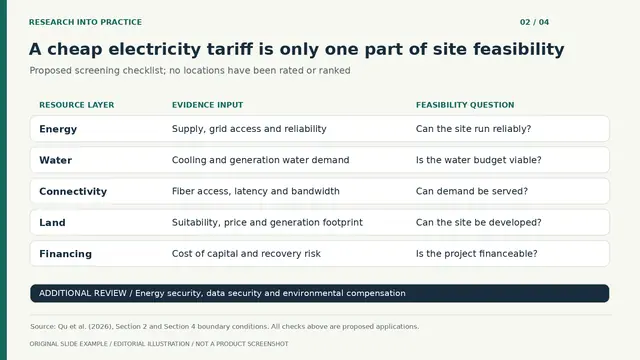
Builds a five-row screening table for energy, water, connectivity, land and financing, labeled as proposed checks.
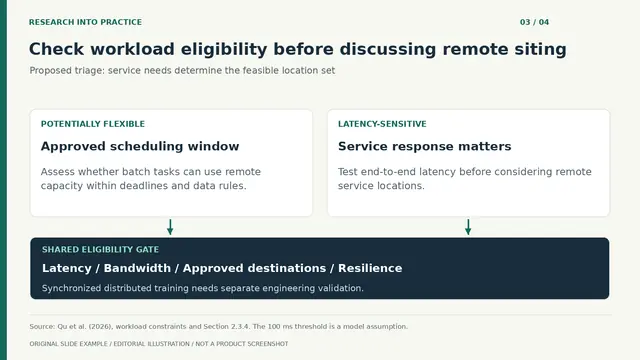
Separates movable workloads from latency-sensitive services with a shared eligibility gate and a modeled 100 ms threshold.
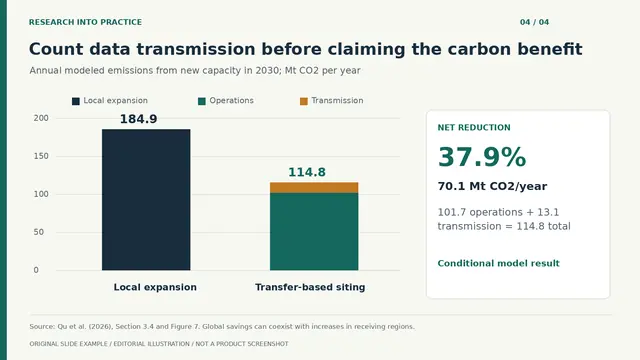
Charts modeled emissions on a zero-based axis and keeps data transmission emissions inside the net reduction.
Builds an eight-slide interview portfolio that maps your real evidence to the role's top five requirements through two case studies.
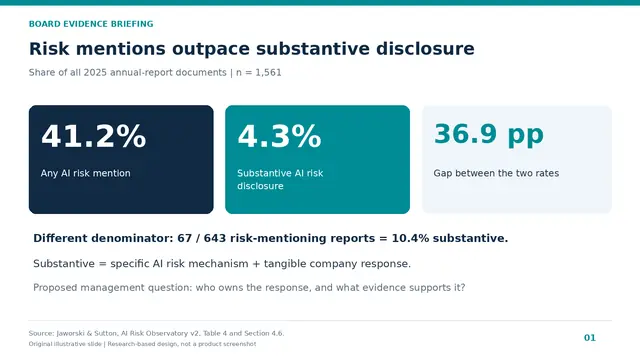
Contrasts AI risk mentions with substantive disclosure on one slide, showing a percentage-point gap and its denominator.
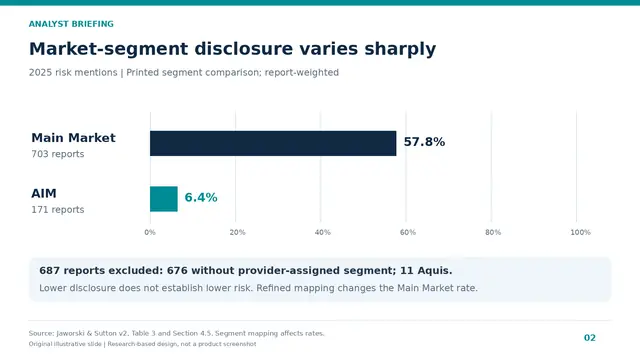
Plots disclosure rates for two market segments on a shared zero-based scale, with sample sizes and an exclusions caveat.
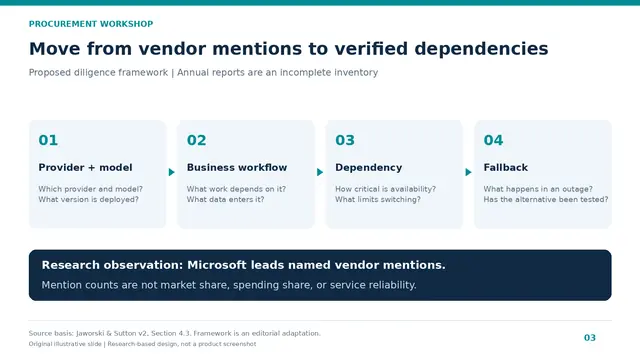
Turns vendor mentions into four linked cards of procurement questions, labeled as a proposed diligence framework.
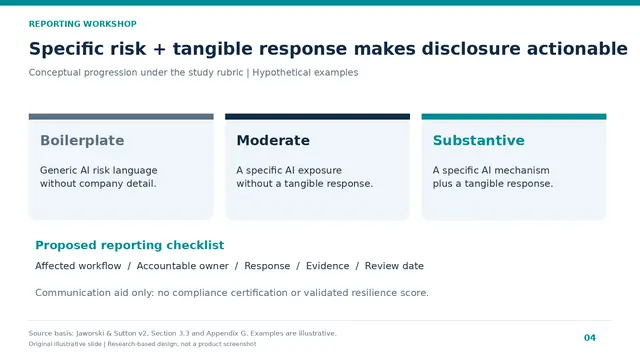
Explains a three-level boilerplate-to-substantive rubric with labeled illustrative examples and a review checklist.
Turns a report and spreadsheet into an executive deck, choosing bar, line, scatter, heatmap or waterfall by the question asked.
Builds a nine-slide answer-first return-offer review with a STAR case, measurable contribution and a 90-day plan.
Turns an engineering whitepaper into a 10-slide value proposition deck for a marketing team, with minimal jargon.
Groups audit non-conformities by severity in a table layout, citing the source clause or section for every finding.
Builds one slide each for best, base and worst case outcomes from a forecast's data tables, plus a comparison summary.
Turns a quarterly operations report into a 10-slide board briefing that leads with the three most critical metrics.
Converts a handbook into a 25-slide onboarding deck with one section per policy area and a quiz slide after each.
Adds a rule to use only the source document and leave a placeholder wherever a figure is missing.
Tells the model to show both values and both sources when two reports disagree on the same metric.
Outlines a 12-slide C-suite briefing on generative AI in logistics around ROI, risk and a 24-month roadmap.
Writes 3-4 sentence speaker notes for a range of slides, each ending with a transition and avoiding the bullet text.
Sets a 15-slide board deck style: one takeaway per title, four bullets at most, navy and white with gold accents.
Sets up a 25-slide training deck with numbered steps, definition callouts and a knowledge check every five slides.
Shows four workstreams with progress bars, RAG budget status and next-milestone callouts on one grid slide.
Converts a status report into 10 set slides: RAG summary, milestones, burn chart, workstreams, risks and decisions.
Turns a weekly status report into five slides: wins, blockers, priorities by owner, metrics and open questions.
Answers three questions on one slide: the current situation, the recommendation and the action required.
Lists four numbered agenda items with one-line descriptions, time estimates and icons for a 45-minute talk.
Ends a deck with three numbered takeaways, one clear next step and a call-to-action element in the brand color.
Covers current metrics, 12-month themes, a quarterly timeline, the top three initiatives, dependencies and success metrics.
Builds a client update with safety metrics, work completed, a two-week lookahead, RFI status, budget curve and open actions.
Turns a preliminary S-1 into an investor deck ordered by investor decisions, with period-safe financial charts and filing sources.
Builds a slide-by-slide financial deck with conclusion titles, three-bullet limits, chart picks, speaker notes and verification flags.
Structures a fundraising deck as hook, conflict, stakes, journey, insight, transformation and ask, flagging every market-size claim.
Explains each financial concept in plain English with a business analogy and defines terms like EBITDA or IRR on the same slide.
Builds an analysis deck with methodology, sensitivity analysis and a source appendix, and marks any missing figure instead of inventing it.
Fixes an eight-slide board briefing from executive summary to decisions required, with no more than six figures on the metrics slide.
Reviews existing financial slides and recommends the right chart, text cuts, layout and a sharper conclusion headline for each.
Writes opening lines, talking points and transitions for each slide, plus the 10 hardest audience questions with direct answers.
Pulls the top five financial risks and three growth opportunities from a long annual report and cites the PDF page on every slide.
Condenses a prospectus's business model and competitive landscape into 15 minimalist slides that favor visual metaphors over bullets.
Draws base, optimistic and conservative revenue lines over three years and shades the range between the upper and lower cases.
Turns a business plan into a standard 12-slide pitch deck from problem to use of funds, each slide titled with one message.
Builds a thesis deck with a TAM/SAM breakdown, three evidence-backed arguments, risks, model assumptions and bull, base and bear returns.
Creates a 10-slide launch deck from a brief, pain-point notes and screenshots, ending with a go-to-market timeline and call to action.
Builds an 8-slide demo deck with one product moment per slide, large readable screenshots and a short presenter note on each.
Compares your product with three competitors in a table, positioning map and strengths list, then proposes objective sales messaging.
Covers buyer personas, discovery questions, objection handling, competitor talk tracks and demo guidance, with speaker notes per slide.
Reads an existing brand deck and lists its slide size, type styles, palette, logo placement, chart style and spacing rules first.
Asks for each slide's title, core message, evidence, visual and presenter note, and holds the PPTX until you approve the outline.
Keeps approved claims word for word and marks missing evidence as needs verification instead of inventing quotes, prices or metrics.
Requires real PowerPoint text and native bar, line and pie charts, and forbids turning whole slides into images.
Sets one SaaS-style illustration style and B2B tone for the deck and saves the image notes so later slides can match.
Renders every slide to an image and fixes clipped text, overlap, uneven spacing, font substitution and layout drift before saving.
Sorts customer feedback transcripts into the top three pain points with quotes and maps each one to a possible product improvement.
Sets an 11-slide monthly report from executive summary to recommendations, with slide counts per section and two brand hex colors.
Builds a 12-slide marketing pitch with bold type, high-contrast color and full-bleed image placeholders, each slide opening on an emotional hook.
Compares your product with three competitors on five dimensions in a horizontal bar chart, your bars in brand color and theirs in gray.
Converts a monthly marketing report into an eight-slide client update with one slide per channel and a budget reconciliation.
Redesigns hierarchy, spacing and typography while keeping every word, number, chart, citation and the slide order exactly as they were.
Turns a report into a 12-slide strategy review deck with restrained color, clear section pages and evidence-first charts.
Extracts the argument, data, risks and actions from a document, gets an outline approved, then builds an editable deck.
Turns a paper into a conference talk that keeps the research question, method, setup, key figures, results and limitations.
Converts a financial report into an investment committee style deck that keeps key tables, ratios, risks and management commentary.
Refines hierarchy, cuts text density, smooths section transitions and sharpens titles while keeping source-backed numbers intact.
Cuts every shape, icon, chart and image on a slide into a clean transparent PNG at its original size and position, without layout text.
Places extracted PNG assets back in their original positions and adds real text boxes, producing a .pptx that opens in Office and WPS.
Asks for five fully composed 16:9 slide concepts that share one palette, type hierarchy and grid, favoring structure over ornament.
Exports each background panel, container, border and separator as its own transparent PNG at its exact position, with no text baked in.
Puts each layer back at its original coordinates and adds editable text boxes so every element can be selected in PowerPoint.
Tells the model to discard a draft with uneven spacing and unclear hierarchy and rebuild the layout on a tighter grid.
Builds a 10-slide SaaS demo deck on a dark background with one accent color, icons instead of photos and a problem-to-CTA flow.
Assigns the primary color to headers and callouts, secondary to backgrounds and dividers, and the accent to one key element per slide.
Sets a white or light gray base, one accent for highlights, single-hue sequential chart colors and red reserved for risk only.
Specifies a charcoal background, white body text, teal or blue headers and high-contrast chart colors that stay legible on dark.
Gives three-color palettes for finance, healthcare, technology and sustainability decks, such as navy, forest green and white for finance.
Plots four years of quarterly revenue as a shaded line, labels the highest and lowest points, and titles the slide with the insight.
Shows TAM, SAM and SOM as nested circles or a funnel with dollar sizes, percentages and color that deepens toward SOM.
Puts baseline and post-change metrics side by side with large numbers, direction arrows and a highlighted percentage-change badge.
Places the logo top left, a large bold title centered vertically, a smaller subtitle and presenter details bottom right on brand color.
Or press Run in Tosea to open it in a new chat, already filled in.
Add the PDF, Word file, spreadsheet or notes, and replace any bracketed fields.
Review the outline, generate the slides, then export to PowerPoint.
A good prompt names the source file, the audience and the decision they need to make, the number of slides, the structure, the evidence rules and the output format. The strongest prompts also ask for action titles and a source note on every number.
Yes. Every prompt is plain English. Chat assistants return an outline and slide text. Tosea returns finished slides that you can edit and export to PowerPoint.
Press Run in Tosea, attach your file, generate the deck and export it as a .pptx file.
No. The names describe well-known consulting frameworks and slide conventions. Tosea is not affiliated with McKinsey & Company, BCG, Bain & Company, PwC or Deloitte.
Most were. Slides marked Generated in Tosea were made in Tosea with the prompt shown next to them and sample data. The others are illustrative examples from the original guides. Figures on all example slides are illustrative.
Yes. You can copy them and use them in any tool, including for commercial work.
Upload the document. Tosea drafts the deck, you edit and export.
Start for free