Journal club presentation prompts
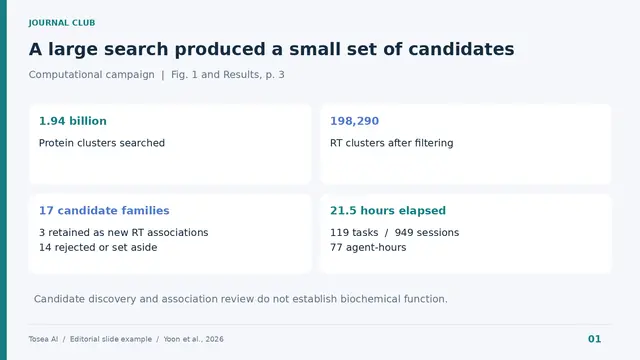
Shows the funnel from 1.94 billion clusters to 3 retained associations, with compute effort kept in separate units.
Research · 4 prompts
Prompts for turning papers and research data into talks people can follow: conference presentations, thesis defenses, journal clubs, lab meetings and briefings for non-specialists. They ask the model to cite pages and figures, separate evidence from inference, and leave gaps marked instead of filled.
Shows the funnel from 1.94 billion clusters to 3 retained associations, with compute effort kept in separate units.
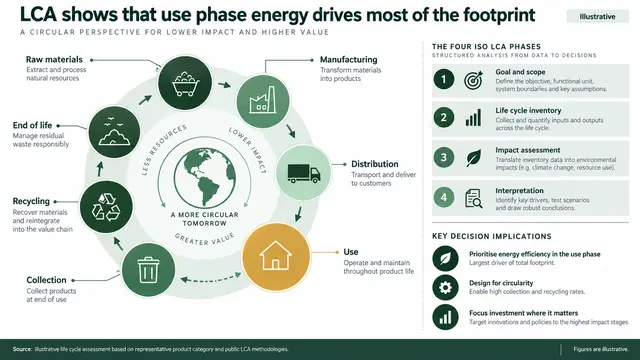
Links the product journey to the four ISO LCA phases under a verified action title, with implications and a limit.
Every prompt below is shown in full. Copy it, or run it in Tosea with your own file.
Outlines 10 slides on a paper's problem, prior work, intuition and method, tagging each claim by evidence type with page citations.
Act as a rigorous peer reviewer. Analyze the attached paper for a research presentation.

Explain four sections: research problem, prior work, core intuition, and method. For the method, trace one concrete example from input through processing to output. Define every symbol in every equation and explain its mathematical intuition.

Label each statement as one of four evidence classes: stated by the paper, supported by cited literature, evidence-based inference, or unresolved uncertainty. Cite the page, section, figure, or table for every important claim. Do not invent missing experimental details.

Output a 10-slide outline with an action title, evidence, proposed visual, source reference, and speaker note for each slide.
Builds 10 to 12 timed conference slides with conclusion titles, three points each, sourced visuals and speaker notes.
Create a research conference presentation from the attached paper for a 15-minute talk and 5-minute Q&A. Audience: researchers in the field who do not know this project.

Allocate time by section. Open with the practical or scientific problem, establish the gap, explain one core idea, show only the methods needed to trust the results, present two to three decisive findings, then close with limitations and the main takeaway.

Return 10 to 12 slides. For each slide provide one conclusion-style title, no more than three supporting points, one recommended visual, its source, and speaker notes. Do not change reported values or imply causality beyond the study design.
Maps a 30-minute defense by chapter with timing, transitions, backup slides and five likely committee questions.
Build a thesis defense storyline for a 30-minute presentation using the dissertation and committee requirements.

Identify the central research question, why it matters, the thesis-level contribution, and how each study chapter supports that contribution. Separate shared methods from chapter-specific methods. Show how evidence accumulates across chapters and where findings remain uncertain.

Produce a slide map with section timing, transition sentences, candidate visuals, backup slides, and five likely committee questions. Preserve terminology and citations from the dissertation. Flag claims that are broader than the evidence.
Builds 9 appraisal slides plus discussion: design diagram, results visual from reported data and a strengths-and-limits table.
Prepare a journal club presentation for graduate researchers using the attached article and reporting guideline relevant to its study design.

Cover the research question, design, population, exposure or intervention, comparator, outcomes, statistical approach, main effect estimates, uncertainty, bias, generalizability, and reproducibility. Distinguish statistical significance from practical importance.

Create 9 slides plus a discussion slide. Include a study-design diagram, one reconstructed results visual using only reported data, a strengths-and-limitations table, and three discussion questions. Cite exact locations in the paper. Mark unreported items as not reported.
Turns a methods section into four slides with one running example and every equation symbol, unit and dimension defined.
Convert the method section into a technically accurate presentation sequence.

Identify inputs, preprocessing, model or experimental stages, decision points, outputs, assumptions, and failure modes. Use one realistic running example throughout. For every equation, define all symbols, subscripts, superscripts, operators, units, and dimensions.

Return four slides: end-to-end pipeline, one worked example, computational or experimental detail, and validation. Recommend a flowchart, annotated schematic, equation-to-geometry view, or timeline where appropriate. Never add a processing step that is absent from the source.
Builds up to five results slides, each with one claim, one chart, one interpretation and one stated limitation.
Design the results section from the attached tables, figures, and analysis outputs.

First identify the minimum evidence needed to support each claim. Preserve sample size, denominator, units, baseline, effect estimate, uncertainty interval, model adjustment, and comparison period. Recommend the correct chart for each claim and explain why.

Create no more than five results slides. Each slide must contain one claim, one visual, one interpretation, and one limitation. Recalculate displayed differences where possible and report any inconsistency. Do not infer significance, causality, or subgroup effects that the source does not establish.
Groups supplied papers by method or question, compares where they conflict and ends on the gap your study fills.
Synthesize the attached literature into a research-gap presentation. Use only the supplied papers and bibliography metadata.

Group prior work by mechanism, method, population, or unresolved question rather than listing papers chronologically. Compare what each cluster establishes, where results conflict, and which limitation motivates the present study.

Return six slides: field map, major approaches, strongest established evidence, disagreement, unresolved gap, and how the new study addresses it. Include a comparison matrix with citations. Do not claim novelty until the supplied literature supports it.
Builds an 8-slide briefing for adjacent-field specialists, defining shorthand while keeping every quantitative qualifier.
Translate the attached research for an audience of specialists from adjacent fields.

Identify which concepts the audience already knows, which terms need definition, and which technical details are essential for evaluating the contribution. Keep scientific precision while replacing field-specific shorthand with short explanations.

Create an 8-slide briefing with a shared problem, conceptual model, method, decisive evidence, limitations, and collaboration opportunities. Add a glossary only for terms used more than once. Preserve all quantitative qualifiers and uncertainty.
Compresses a study into question, method and result regions readable in 20 seconds, with exact copy and alt text.
Turn the attached study into one graphical abstract slide for a research seminar.

Use three regions: question and population, method and evidence, result and implication. Select one primary outcome and one necessary uncertainty measure. Propose a left-to-right visual path with labels that can be understood in 20 seconds.

Provide exact slide copy, layout instructions, figure sources, and alt text. Exclude secondary findings, decorative icons, unsupported mechanisms, and conclusions beyond the study population.
Ranks likely reviewer questions by likelihood and consequence and drafts sourced answers for the top ten.
Act as a skeptical domain reviewer. Audit the proposed research presentation and prepare the Q&A appendix.

Generate questions about design validity, assumptions, confounding, measurement, missing data, power, model specification, robustness, external validity, ethics, and reproducibility. Rank each question by likelihood and consequence.

For the top ten questions, draft a concise evidence-based answer and identify the exact source. Propose backup slides only when a figure, table, sensitivity analysis, or definition materially improves the answer. Mark questions that the available evidence cannot resolve.
Frames an AI ocean forecast benchmark through three evaluation lenses instead of one accuracy ranking.
Create one 16:9 benchmark overview using Sections 2 and 3. Show Wenhai, Skyocean, and ST-base, 120 daily initializations, January to April 2026, northwestern Pacific, and lead days 1 to 7. Use three columns: pointwise accuracy, physical consistency, and distributional consistency. State that inputs and configurations differ. Do not compute an aggregate ranking or invent scores.
Plots balance residuals next to accuracy claims to show that low error does not prove physically coherent currents.
Create a one-slide physics check from Section 4.2. Plot approximate geostrophic balance residuals for Wenhai near 0.100 at days 1 and 7 and Skyocean 0.176 and 0.138. Start at zero and label units m/s. Note that these are selected endpoints and that ST-base ranged from about 0.107 to 0.118. Explain why low sea level anomaly error does not establish height-current coherence. Cite Figure 2b.
Compares error in the lower tail, all samples and upper tail, marking missing values as not supplied.
Design a tail-error slide from Sections 3.3.1 and 4.3.1. Compare lower tail below the dynamic 10th percentile, all valid samples, and upper tail above the dynamic 90th percentile. Define tails using reference values. Include fields for variable, lead day, reference, sample count, and RMSE. Mark missing values as not supplied. Cite Figure 3 and avoid invented warning thresholds.
Uses RMSE, neighborhood CRPS and spectral variance to separate displaced features from smoothed ones.
Create one 16:9 diagnostic slide for sea level anomaly against SWOT L3 at Scale C, below 70 km. Summarize the relative patterns for ST-base and Skyocean in RMSE, neighborhood CRPS, and spectral variance from Section 4.3.3. Label displacement and smoothing as suggested explanations. Add a reminder that reference resolution and sampling matter. Cite Figures 4 to 6; do not digitize or invent chart values.
Draws a seven-stage diagnostic chain, highlights the pilot scope and adds review owner, output and fallback fields.
Create one 16:9 slide for a diagnostic service steering committee. Draw the seven-stage chain from Figure 1 of the uploaded preprint. Highlight report generation and the handoff to communication as an illustrative pilot scope. Add fields for review owner, output destination, and fallback. Use only approved local inputs or mark them to confirm. Cite the preprint and do not claim measured time savings or improved diagnosis.
Sets AI user and developer barrier themes side by side, with one proposed follow-up question per group.
Design a two-column stakeholder slide for a joint clinical and development workshop. Use Section III-E and Figure 5 to summarize the qualitative contrast under Desire to Use only. Show five raters per group. Use barrier names instead of cluster numbers, omit unverified scores, and add one follow-up question per group. Label workshop questions as proposed, not findings.
Builds a 2x2 grid of user and developer ratings split at group means, noting that agreement does not prove feasibility.
Create a 2-by-2 Go-Zone explainer. Label the horizontal axis AI user rating and the vertical axis AI developer rating for the same selected dimension. Divide each axis at its group mean. Highlight the quadrant above both means. Use no points or fabricated values. Add one line explaining why agreement does not establish feasibility. Cite Figure 6.
Turns barrier research into a pilot table for integration, human review, traceability and fallback, with owners.
Create a one-slide pilot review table for an illustrative report-generation workflow. Include integration, human review, traceability, and fallback. For each row show proposed owner role and evidence to request. Leave status unverified unless the supplied records support it. Separate source themes from proposed actions. Do not invent patient information, institutional approvals, validation thresholds, or clinical benefits.
Separates publication output from assessed understanding in a labeled conceptual model for a hiring committee.
Using the uploaded Pal and Park paper, create one 16:9 committee briefing slide distinguishing publication output from an assessment of understanding. Show two observable signals feeding a conditional judgment, with study choice and true understanding explicitly marked as unobserved. Add a note that AI-assisted learning is excluded by the model. Use burgundy, ivory, and navy. Cite Sections 2-3. Do not claim that prolific applicants lack expertise or assign real candidates to theoretical types. Label the diagram as a conceptual model.
Compares hire rates and understanding across two equilibria, labeled as illustrative model output with assumptions shown.
Create one 16:9 methods slide using Table 3. Label every value illustrative model output. Use assumed shares H=0.3, M=0.5, L=0.2 and tau=0.9. In two zero-based 0-100% panels, compare E2 versus E3: hire rates 35% versus 82% (computed from the Table 3 formulas), and understanding among hires approximately 85.7% versus 97.6%. Explain that applicant behavior differs across equilibria and rankings depend on pool composition. Do not describe the difference as an experimentally measured policy effect. Include the assumptions visibly and cite Table 3, page 13.
Proposes a three-stage interview (explain, change an assumption, verify) with blank criteria marked unvalidated.
Create one 16:9 slide proposing an understanding-focused research interview. Use three stages: explain a selected result, analyze a changed assumption, and describe a verification or failure-checking step. Add review criteria for reasoning, limitations, and evidence, leaving scores blank. State that this rubric is proposed and unvalidated. Include the paper's point that assessment matters only when hiring decisions use its result. Cite Discussion items iv-v. Avoid candidate rankings, psychological labels, and any assertion that AI use proves a lack of understanding.
Structures a candidate talk slide around contribution, assumption, verification and limitation from your own notes.
Create one 16:9 candidate research-talk slide from my approved project notes. Structure it around contribution, key assumption, verification, and limitation. Include one changed-condition question that I must answer from my own work. Distinguish my contribution from the team's and report tool assistance only from supplied facts. Label missing evidence as not supplied. Cite the uploaded hiring paper only as conceptual motivation, not proof that this slide improves hiring chances. Use four evidence cards and a concise conclusion. Invent no publications, outcomes, or personal experience.
Explains an education study's effect estimate, its baseline and three stated limits without overselling the result.
Read the uploaded CAiSEY paper. Create one 16:9 faculty briefing slide in navy, blue, and white. Headline: A second qualifying use supports later participation. Show +0.227 voluntary contributions per later session as the incremental second-use IV estimate and explain that 0.227 / 0.73 is approximately 31%. State that 0.73 is the sample mean, not a control-group mean. Add three limits: no detectable same-session benefit, no demonstrated exam-score gain, and a purpose-built MBA setting. Cite Results, page 7, and Supplementary Table S4, Model 7. Do not invent a before-and-after comparison.
Maps a four-stage AI voice practice sequence and labels any local rollout as an adaptation of the study.
Using only the uploaded study, make a 16:9 course design slide with four stages: read the case, defend a position aloud, respond to the opposing AI argument, and reflect on feedback. Use concise labels and directional connectors. Below the process, explain that the study assigned two preparation opportunities and evaluated later voluntary participation. Label any suggested local rollout as an adaptation. Put the ten-minute qualifying-use definition in a footnote, and note that sensitivity analyses also tested shorter thresholds. Do not claim ten minutes is an optimal dose.
Pairs a rehearsal checklist with a clear split between outcomes the study found and outcomes it did not show.
Create a student-facing workshop slide based on the CAiSEY paper. Use two panels. The first gives a proposed rehearsal checklist: read the source, state a position, answer a counterargument, and identify one unresolved question. The second distinguishes study findings: later voluntary participation, comfort speaking up, and perceived learning, from outcomes not shown to improve: focus, motivation, and exam scores. State that exam scores were not established as improved, rather than labeling them a null result. Mark the checklist as practical guidance inspired by the study. Include a source footer.
Sets participation, experience and learning measures for a classroom AI pilot, left empty of invented results.
Build a 16:9 evaluation scorecard for a proposed voice-AI preparation pilot. Use three rows: voluntary participation, student experience, and learning assessment. For participation, count contributions separately from cold calls. For experience, collect comfort, perceived learning, focus, and motivation separately. For learning assessment, propose an independently scored task and clearly label it as a new local measure. Add columns for collection method and interpretation. Distinguish randomized assignment from actual use, show attendance and missing-data checks, and do not fill the scorecard with invented results.
Compares 2010 and 2024 shares of workers aged 55+ in three sectors with paired bars and a conditional takeaway.
Using the uploaded BIS Bulletin 135, create a policy briefing slide comparing workers aged 55+ in 2010 and 2024: agriculture 24% and 33%, real estate 27% and 34%, health and social work 18% and 25%. Use paired horizontal bars, label percentages and years, and cite printed page 2. State that these are employment-weighted global averages. Add a conditional policy takeaway without inventing country rankings or causal effects.
Lays out diagnose, assess and test stages for task pilots and lists required inputs where company data is missing.
Create a workforce planning slide using the uploaded bulletin and any internal workforce files supplied. Show three stages: diagnose age and vacancy exposure, assess tasks for assistance, and test interventions. Use the health and social work finding as context. Propose retention, training, and task-level pilots while separating suggestions from measured results. If company data is missing, list required inputs. Include review time, error rates, service quality, and vacancy duration as proposed metrics.
Splits sectors by AI and robot exposure and adds a demand validation panel, labeling commercial ideas as hypotheses.
Build a market opportunity slide grounded in BIS Bulletin 135. Separate sectors with higher composite AI-robot exposure from those with lower exposure, using the paper's classifications. Add a validation panel for customer demand, workflow volume, deployment cost, and adoption barriers. Explain that exposure does not establish market size or revenue potential. Label all commercial recommendations as hypotheses and include no unsupported TAM, ROI, or growth forecast.
Explains how an employment-weighted overlap index is built and what it does not measure, before any conclusion.
Create a research-method slide from the uploaded bulletin. Explain standardized AI and robot exposure, their equally weighted composite, industry shares of workers aged 55+, and employment weights. Describe the overlap index as employment-weighted covariance. State that higher overlap indicates better alignment, not a replaceable-job percentage. Cite printed pages 3–4 and identify the online annex as necessary for replication. Separate methodological limitations from proposed sensitivity tests.
Four metric cards with reporting periods and three conclusions that summarize a regional biopharma sector report.
Create one executive dashboard slide titled Massachusetts Biopharma: A Resilient but Uneven Recovery. Use four metric cards: 3.45 billion dollars in H1 2026 venture capital, 113,503 biopharma jobs in 2025, approximately 2,400 active clinical trials, and 36.2 percent year-over-year growth in China's drug pipeline. Add three conclusions: capital and exits are recovering, employment and federal research remain under pressure, and Massachusetts retains scientific depth while China closes the scale gap. Place reporting periods beneath each metric. Use a clean life-sciences palette with navy, teal, white, and light blue.
Shows a funding rebound next to top-10 deal concentration and the Series A versus seed gap, all source-linked.
Design one investor presentation slide titled Venture Capital Rebounded, but Concentration Increased. Show 3.45 billion dollars raised in H1 2026, up 25 percent year over year and equal to 25 percent of US funding. Add a horizontal bar showing that the top 10 deals received 46.5 percent of Massachusetts capital. Compare the 79.6 million dollar average Series A with the 4.65 million dollar average seed round, down from 7.65 million. End with the implication that the market reopened while earliest-stage companies still face a thinner funding environment. Keep all numbers source-linked and editable.
Contrasts falling jobs with rising total wages and adds a discussion question instead of a forced explanation.
Build one analytical slide titled Biopharma Employment Fell as Total Wages Rose. Compare 113,503 jobs, down 3.1 percent, with 26.45 billion dollars in total wages, up 2.2 percent. Note that this was the first annual employment decline in the more than two decades MassBio has tracked the data, that losses were concentrated in R&D, and that biomanufacturing added jobs. Add a discussion question asking whether the pattern reflects broad contraction, greater specialization, or a lagging effect of the financing slowdown. Do not calculate average compensation unless the methodology is explained.
Compares early-stage trial counts across regions with a footnote that overlapping geographies cannot be summed.
Create one clinical-development slide titled Massachusetts Remains an Early-Stage Clinical Engine. Show 2,405 ongoing Phase I to Phase III trials, 836 early-stage trials, a 35 percent early-stage share, and a 54 percent oncology share. Compare early-stage counts for Massachusetts at 836, California at 1,581, the United States at 5,661, and China at 5,715. Add a footnote that Massachusetts is included within US totals and that trial geographies can overlap. Use proportional bars without implying that the categories can be summed.
Benchmarks China, the US and Massachusetts on pipeline size, growth, advanced modalities and early-stage trials.
Create one strategy slide titled China Is Closing the Biopharma Innovation Gap. Build a table comparing China, the United States, and Massachusetts across total drug pipeline, year-over-year pipeline growth, advanced-modality programs, and early-stage trials. Use these values: 7,105, 12,769, and 2,175 for total pipeline; 36.2 percent, 0.6 percent, and 9.2 percent for growth; 1,322, 2,717, and 561 for advanced modalities; and 5,715, 5,661, and 836 for early-stage trials. State that Massachusetts is a subset of the US figures. Avoid geopolitical language that is not supported by the source.
Maps source material, AI analysis and decision output for contract research, ending with required human approval.
Create one executive presentation slide titled AI compresses contract research from hours to minutes. Show a left-to-right workflow with three stages: source material, AI analysis, and decision output. Under source material include contract clauses, jurisdiction, and cited precedents. Under AI analysis include extraction, comparison, and source-linked citations. Under decision output include risk summary, review checklist, and final human approval. Use a clean legal-technology style with navy, white, and blue. Do not imply that AI provides legal advice. Add a footer stating that all findings require qualified human review.
Places a 44 percent adoption figure beside three productivity growth bars, each labeled with its measurement basis.
Design one board-ready slide titled Fast adoption has not produced a visible productivity boom. Place a large 44 percent AI workplace adoption statistic on the left. On the right, create a three-bar comparison showing 1.5 percent for the 1980s average, 2.2 percent for US labor productivity in Q2 2026 measured year over year, and 2.7 percent for the late 1990s. Label the measurement basis under each bar. State that the values are reported in Reuters Breakingviews and should be checked against current BLS data. End with the takeaway that task-level speed is real, while aggregate productivity depends on workflow redesign. Use an analytical finance style and avoid decorative charts.
Traces AI chip design, manufacturing and deployment across three regions and asks which economy captures the value.
Create one presentation slide titled Why AI value can disappear across global value chains. Visualize a three-stage flow: AI chip design in the United States, manufacturing in Taiwan, and sale or deployment in Europe. Connect the stages with a curved route. Add a central question asking which economy captures the value created by AI infrastructure. Use restrained colors, large geographic labels, and a source note. Do not invent trade values or market shares. Distinguish confirmed locations from analytical interpretation.
Four sequential stage cards with two actions each and a measurement row for cycle time, rework and error rate.
Build one strategy slide titled The productivity payoff depends on organizational redesign. Show four sequential stages: train people, redesign the process, build controls, and scale the gain. Under each stage include two concrete actions. Add a measurement row containing baseline cycle time, AI-assisted cycle time, human review time, rework rate, accepted output, and error rate. Use a modern consulting layout with four equal cards. Make the final stage green to indicate realized value. Keep all text editable and include no unsupported ROI claim.
Splits AI benefits into now, next and later milestones and warns against using infrastructure revenue as a productivity proxy.
Create one executive timeline slide titled AI investment benefits arrive on different timelines. Use three milestones: Now for chips, cloud, and data centers; Next for workflow implementation and adoption costs; Later for economy-wide productivity. Add the takeaway that infrastructure revenue should not be used as a proxy for realized customer productivity. Use a dark technology theme with green, blue, and amber milestones. Avoid forecasting a date unless a source provides one.
Builds a 12-slide seminar from a review paper with speaker notes and a source page for every claim, outline first.
Create a 12-slide graduate immunology seminar presentation from this review.
Explain the canonical dsDNA-cGAS-cGAMP-STING signaling sequence, nuclear cGAS
regulation, endogenous DNA sources, STING trafficking, transcriptional and
non-transcriptional effector functions, disease implications, and therapeutic
strategies. Preserve the review's context-dependent interpretation of tumor and
inflammatory biology. Use original figures only when their labels remain readable.
Do not convert preclinical evidence into clinical efficacy claims.
Add speaker notes and include the source page for every slide claim.
Show me the outline before generating slides.
Structures a talk from background to conclusion and keeps each figure tied to the claim it supports.
I have a research paper, generated scientific figures, and research notes.

Create a presentation structure for a conference talk.
Preserve the research logic: background, research gap, method, data, results, limitations, and conclusion.
Keep each figure connected to the claim it supports.
Output the final deck as editable PPTX.
Sets an ML-conference look: blue and white, one idea per slide, architecture diagrams, benchmark and ablation tables.
You are a professional academic presentation designer for computer science and STEM research.
Generate a modern academic-style presentation for a research paper or conference talk. The presentation should feel like a NeurIPS or CVPR submission — clean, precise, and visually authoritative.
Visual style: minimalist, white or light blue-gray background, primary color palette of white and blue. Use blue for titles, key metrics, architecture diagrams, arrows, and highlighted concepts. Secondary use of light gray and cyan only.
Layout: one core idea per slide, conclusion-oriented titles, large safe margins, generous whitespace. Prioritize architecture figures, benchmark tables, and ablation study charts. Never use paragraph-heavy slides.
Technical content rules: code blocks use light gray or deep blue backgrounds styled like modern code editors. Equations are centered with ample whitespace, important symbols highlighted in blue. Benchmark comparison tables use blue headers, light gray row separators, best results highlighted in blue.
Diagrams: clean flat vector style, thin lines, light blue grids, horizontal process flows, data flow arrows. System architecture figures should be horizontal and editable.
Typography: Inter or Helvetica for Latin text. Relaxed line spacing. Title weight slightly heavier than body.
Export: editable PPTX, speaker notes on every slide, all text and shapes editable.
Figure-first life science slides with colorblind-safe palettes, scale bars, heatmaps and statistics on every plot.
You are an academic presentation designer specializing in life sciences research.
Generate a professional biology research presentation suitable for a biology conference, lab seminar, or journal club presentation. The aesthetic should resemble Cell, Nature Methods, or PLOS Biology figure style.
Visual style: clean white background, primary accent color emerald green or teal, secondary gray. Use color to indicate experimental groups, biological pathways, and statistical significance markers. Avoid color schemes that fail colorblindness accessibility standards.
Layout: figures and data visualization take priority over text. Each results slide centers on one key finding. Method slides use clear flowcharts or schematic diagrams. Use comparison panels where experimental versus control data appears side by side.
Biology-specific content: microscopy images should be accompanied by scale bars noted in captions. Phylogenetic trees and pathway diagrams use thin lines and clean node labels. Gene expression data should appear as clean heatmaps or volcano plots, not data tables. Statistical annotations (p-values, n values, error bars) should appear on all quantitative figures.
Tables: use for sample characteristics or experimental conditions only, not for results data that could be visualized. Light borders, generous spacing.
Typography: clean sans-serif font throughout. Figure labels in consistent size, bold for panel identifiers (A, B, C).
Output: editable PPTX, speaker notes per slide, all figures and labels editable.
Grand rounds style slides with CONSORT flow, Kaplan-Meier curves, forest plots and finding-first titles.
You are an academic presentation designer for clinical and medical research.
Generate a professional medical presentation suitable for a clinical conference, grand rounds, or health policy briefing. The presentation should meet the visual standards of NEJM or JAMA figures and clinical conference presentations.
Visual style: clean white background, primary blue-gray palette, conservative and authoritative. No decorative elements. Every visual element must serve data communication.
Clinical content rules: CONSORT flowcharts for clinical trial participant flow use standardized box-and-arrow format. Kaplan-Meier survival curves use clean line formatting with confidence intervals shown. Forest plots for meta-analyses use standard academic formatting with correct axis labels. Safety data (adverse events, tolerability) should be presented in clear tables with statistical context.
Patient data slides: subgroup analyses use small multiples or forest plot format. Baseline characteristics tables use standard clinical format — continuous variables with mean and SD or median and IQR, categorical variables with n and percentage.
Risk of bias and GRADE evidence quality should appear on methodology slides when reporting systematic reviews.
Color conventions: blue for intervention groups, gray for control groups, red only for critical safety findings requiring attention.
Tables: dense clinical tables acceptable when data requires it, but use generous row spacing and column alignment. Headers in bold, statistical footnotes below table.
Typography: clean, highly readable, optimized for projection in large auditoriums. Titles should summarize the clinical finding, not label the data.
Output: editable PPTX, speaker notes per slide, all data elements editable.
Investment-research deck with an executive summary first, standard valuation tables and sourced, editable charts.
You are a professional financial presentation designer specializing in investment research and corporate finance.
Generate a financial research presentation with the visual authority and precision of a
Goldman Sachs
or
McKinsey
financial deck. The aesthetic should match top-tier investment banking or consulting presentation standards.
Visual style: white or very light gray background, navy blue and slate gray as primary colors, gold or warm amber as accent for key callouts. No consumer-facing design conventions. Clean, dense where necessary, authoritative throughout.
Layout: executive summary slide first with the key recommendation in one sentence. Each subsequent slide addresses one analytical argument. Financial model output slides can be denser than academic slides — investors expect data-rich layouts. Use clear visual hierarchy: title states the conclusion, body provides supporting evidence.
Financial content rules: income statements, balance sheets, and cash flow statements use standard financial table format with clear period labels. Valuation tables (DCF, comparable company analysis, precedent transactions) use standard investment-banking formatting. All figures must be sourced — every data point traces to a specific source in the underlying analysis.
Charts: line charts for time-series financial data, bar charts for period comparisons, waterfall charts for bridge analysis, scatter plots for regression and correlation analysis. No pie charts for financial data. All axes labeled, all data sourced.
Color conventions: blue for primary metrics, green for positive performance, red for negative performance or risk, gray for benchmarks and secondary data.
Tables: financial tables can use smaller type than other disciplines when necessary for completeness. Row and column alignment must be precise. Highlight key cells in light blue or bold.
Typography: clean serif or sans-serif, consistent sizing. Financial figures right-aligned in tables. Percentages and basis points formatted consistently throughout.
Output: editable PPTX, speaker notes per slide, all numbers and charts editable.
Climate research slides with map conventions, diverging anomaly scales and uncertainty ranges on every projection.
You are an academic presentation designer for environmental and climate science research.
Generate a research presentation suitable for an environmental science conference or climate policy briefing. The visual style should resemble IPCC summary reports and Nature Climate Change figure standards.
Visual style: white background, earthy green and ocean blue as primary palette, warm amber and red reserved for warning indicators and temperature anomalies. The overall feel should be data-serious and accessible to interdisciplinary audiences.
Layout: maps and spatial data visualizations take priority on relevant slides. Time-series plots of climate variables use clean axis formatting with clear baseline references. Uncertainty ranges must be shown on all projection data.
Environmental content rules: geographic maps should include scale bars and north arrows. Temperature anomaly maps use standard diverging color scales (blue-white-red). Sea level rise, emissions trajectory, and other time-series data should show historical observations and future projections on the same axis where possible, with scenario labels.
Policy implication slides: use simple framework diagrams to show pathway from finding to recommendation. Avoid dense text. Each policy slide states one actionable conclusion.
Tables: summary comparison tables for emission scenarios, species data, or policy option analysis. Light formatting, clear column headers.
Typography: accessible, readable at projection scale. Label all figure axes and legends in a consistent style.
Output: editable PPTX, speaker notes per slide, all maps and charts editable.
Management research slides with conceptual models, numbered hypotheses, regression and SEM tables and coded quotes.
You are an academic presentation designer for social science and management research.
Generate a research presentation suitable for an Academy of Management conference, business school faculty seminar, or management consulting deliverable. The visual style should balance academic rigor with business communication clarity.
Visual style: white background, slate blue and charcoal as primary colors, warm accent color for key frameworks and highlights. Professional but approachable. The feel should resemble Harvard Business Review graphics combined with top consulting firm slide conventions.
Layout: theoretical framework slides use clean box-and-arrow diagrams. Conceptual model diagrams should be simple, legible, and visually distinguish constructs from relationships. Hypotheses should be presented with numbered labels that correspond to figure annotations.
Research design slides: sample description uses simple summary tables. Measurement items can be listed in compact format with scale source noted. Regression or SEM results use standard academic table format.
Qualitative research slides: for grounded theory or case study work, use clean coding hierarchy diagrams or case comparison tables. Quotes from interviews appear in styled text blocks with source attribution.
Framework slides: use clean rectangular or circular framework diagrams. Avoid overly decorative models. Boxes should have thin borders, rounded corners, and readable labels.
Statistical results: regression tables use standard social science formatting (coefficients, standard errors, significance stars). SEM path diagrams use standardized coefficient notation. Effect sizes and confidence intervals should appear alongside significance values.
Output: editable PPTX, speaker notes per slide, all framework diagrams and tables editable.
Technical talk slides with units on every axis, error bars, numbered equations and grayscale-safe colors.
You are an academic presentation designer for physics and engineering research.
Generate a technical research presentation suitable for an IEEE, APS, or ACS conference talk. The visual style should resemble high-quality physics and engineering journal figures — precise, clean, technically rigorous.
Visual style: white background, dark blue and orange-red as primary accent colors following IEEE and Nature Physics figure conventions. Secondary use of gray and teal. All colors should remain distinguishable in both color and grayscale projection.
Layout: experimental apparatus diagrams take priority on methodology slides. Results slides center on one key measurement or finding. Comparative plots showing material properties, performance metrics, or simulation versus experimental data use clear legend labeling.
Technical content rules: all axes labeled with units in parentheses. Error bars shown on all experimental data. Simulation and experimental data distinguished by line style and color. Phase diagrams and material structure figures use standard scientific notation.
Equations: centered, numbered, with variable definitions provided. Important variables highlighted. Derivation steps, if needed, presented one logical step per slide.
Schematic diagrams: experimental setups drawn in clean engineering style. Cross-sections and exploded views labeled clearly. Flow diagrams for processes use standard engineering flowchart conventions.
Charts: line plots for time-series or spectral data, scatter plots for correlations, contour plots for 2D parameter sweeps. All figures publication-ready in terms of resolution and formatting.
Output: editable PPTX, speaker notes per slide, all diagrams and plots editable.
Accessible slides for interdisciplinary venues with WCAG-safe colors, bias audit tables and fairness trade-off plots.
You are an academic presentation designer for AI ethics and data science research.
Generate a research presentation suitable for a FAccT, AIES, or CHI conference talk. The visual style should be accessible, inclusive, and align with the interdisciplinary audience of these venues.
Visual style: white or warm off-white background, accessible color palette that passes WCAG contrast requirements, avoiding red-green combinations. Primary colors should include accessible blue and a warm accent color. The overall feel should be precise but approachable to interdisciplinary audiences.
Layout: case study evidence is as important as quantitative findings at these venues. Each slide presents one argument or finding. Qualitative and quantitative evidence are given equal visual weight. User interface screenshots or system diagrams should appear clearly labeled with the specific aspect under discussion.
AI ethics content rules: bias evaluation results use standardized metric tables with clear group definitions. Algorithmic decision audits show the comparison between groups with statistical context. Fairness metric trade-off visualizations use clear multi-metric plots. Participatory design process documentation uses timeline or co-design process diagrams.
Tables: bias audit tables include demographic group labels, sample sizes, and metric values with confidence intervals. Use color only to indicate significant disparities, not as decoration.
Diagram conventions: decision tree diagrams and model explanation figures (SHAP, LIME, attention visualizations) use clean formats with clear legend. Human-in-the-loop system diagrams show human and AI components with distinct visual treatment.
Output: editable PPTX, speaker notes per slide, all figures and tables editable.
Merges three research PDFs, shows where their data agree and conflict, and highlights knowledge gaps for a committee.
Merge the key insights from these three separate research PDFs. Identify where the data points agree and where they conflict. Structure the final PPT to highlight these 'Knowledge Gaps' for a research steering committee.
Turns a full dissertation into 18 to 22 defense slides with a clear method progression and a limitations slide.
Turn my 50,000-word dissertation into a 20-minute defense deck (approximately 18-22 slides). Ensure the methodology slides clearly show the logical progression from research question to data collection to analysis. Include a limitations slide.
Builds a 20-slide talk from introduction to conclusion with citation placeholders and data-heavy results slides.
Generate a 20-slide academic presentation for a conference paper on [topic]. Structure it as Introduction, Literature Review, Methodology, Results, Discussion, and Conclusion. Use a formal layout with clear section headers, citation placeholders, and data-heavy slides for the Results section. Font should be clean and readable from the back of a lecture hall.
Allocates 14 slides by section, one per major finding, with the paper's own figure as each result's main visual.
Convert this academic paper into a 20-minute conference presentation. Allocate slides as follows: 2 slides for background and motivation, 3 slides for methodology, 5 slides for results (one per major finding), 2 slides for discussion and limitations, 1 slide for conclusions, 1 slide for references. Each results slide should foreground the finding in the title and use the supporting figure or table from the paper as the primary visual.
Structures a medical conference talk from clinical need through endpoints, adverse events and comparative effectiveness.
Build a clinical research results presentation for a medical conference. Use a formal academic structure: Background and clinical need, Study design and patient population, Primary endpoint results with statistical significance indicators, Secondary endpoint summary, Adverse events table, Comparative effectiveness against standard of care, Clinical implications, and Limitations and future research directions.
Converts a paper into 15 standard-structure slides, emphasizing results figures and capping text at 30 words per slide.
Convert this research paper into a 15-slide conference presentation. Follow the standard academic structure: background, methodology, results, discussion, conclusion. Emphasize the figures from the Results section. Limit text to 30 words per slide.
Attach the paper, state the audience and time limit, and ask for one claim per slide with the figure or table that supports it. The prompts here also ask the model to cite the page or section for each claim, which makes the slides easy to check.
It can. That is why most of these prompts tell it to use only the attached paper, label inferences, and mark gaps instead of filling them. Check every number against the source before you present.
Start with the thesis defense storyline prompt to plan the talk, then use a methods or results prompt for the slides that carry the most weight. Committees remember the contribution, so build the talk around it.
Company, journal and conference names in some prompts describe a style to imitate. Tosea is not affiliated with any of them.
McKinsey-, BCG- and Bain-style strategy frameworks.
Conference talks, defenses, journal clubs and lectures.
QBRs, board decisions, dashboards and reviews.
Pitch decks, investor updates and financial reviews.
Launch plans, campaign reviews and monthly reports.
Themes, chart styling and slide redesign.
Upload the document. Tosea drafts the deck, you edit and export.
Start for free