


Life cycle assessment prompts for PowerPoint
Five consulting-style prompts that build a life cycle assessment review in the order of the four ISO LCA phases: an executive overview, goal and scope, inventory with data quality, impact hotspots, and an interpretation slide that ties results to a decision.
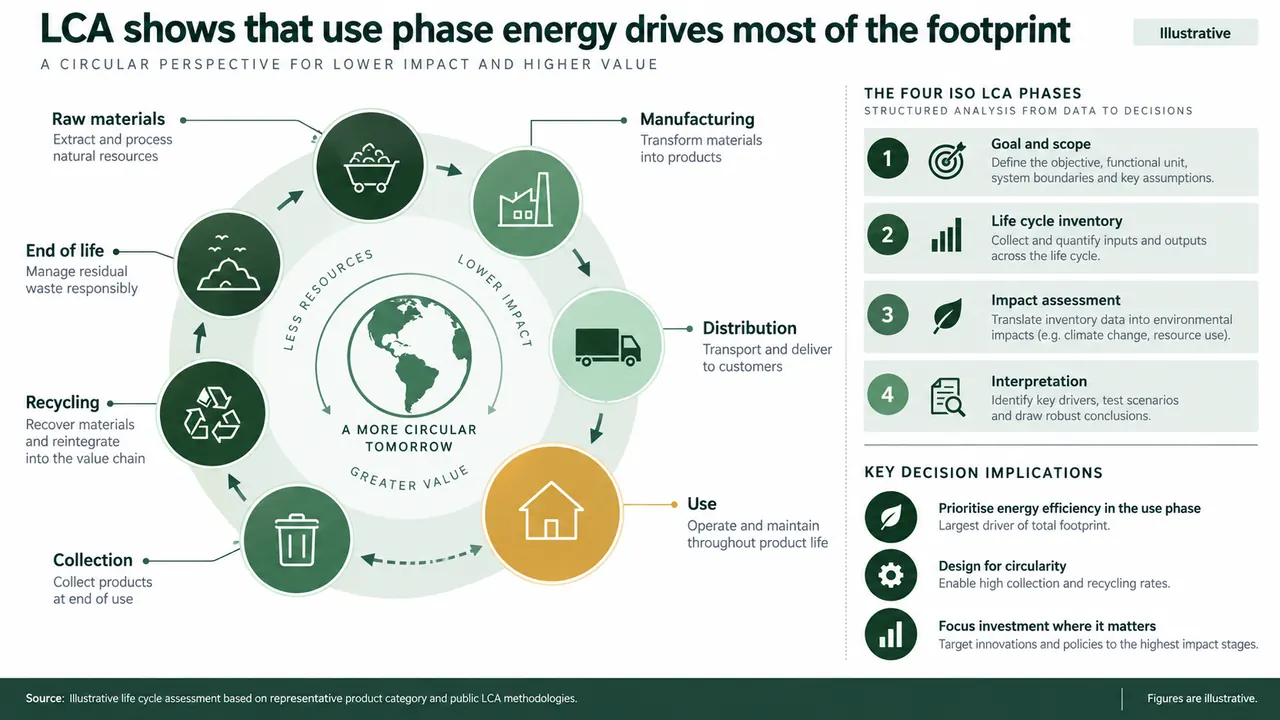
Life cycle assessment prompt
Pick a slide, fill in any highlighted fields, then copy or run it.
Create one 16:9 Life Cycle Assessment PowerPoint slide for an executive review.
Decision: identify where management should focus reduction investment.
Show the product life cycle from raw materials through manufacturing, distribution, use, collection, recycling, and end of life.
Connect the journey to the four LCA phases: goal and scope, inventory, impact assessment, and interpretation.
Use this verified finding as the action title: [insert finding].
Add three implications and one limitation.
Use an original forest-green consulting layout with a source footer.
Mark unverified values as illustrative and do not invent missing data.Create one 16:9 goal and scope slide for an LCA comparison. Decision context: [insert decision]. Functional unit: [insert quantified function]. System boundary: [insert included stages and processes]. Also show intended use, audience, geography, time period, allocation method, data quality requirements, cut-off rules, and justified exclusions. Draw the system boundary as a process diagram and place the scope choices in a compact table. Use a restrained green and white consulting design with editable elements and a source note. Do not imply that excluded processes have zero impact.
Create one 16:9 life cycle inventory slide.
Functional unit: [insert unit].
Stages: raw materials, production, distribution, use, and end of life.
Verified flows: [paste materials, energy, water, transport, emissions, and waste data with units and sources].
Draw a left-to-right process map and a data-quality heatmap.
Distinguish primary data, secondary data, estimates, and missing data.
Use an action title that states the largest data issue.
Add the reporting period, geography, allocation rule, and source footer.
Do not calculate or fill missing values unless a stated assumption supports them.
Create one 16:9 life cycle impact assessment slide comparing Alternative A and Alternative B.
Functional unit: [insert unit].
Impact results: [paste verified category values, units, stages, and sources].
Use small stacked bars for climate change, water use, acidification, and resource use.
Identify the largest stage-level hotspot in each category.
State whether results are absolute or normalized.
Write an action title that describes the trade-off without declaring an unsupported winner.
Add one recommendation and one burden-shifting risk.
Use an original green consulting page system with an explicit illustrative label where needed.
Create one 16:9 LCA interpretation slide for a management decision.
Options: redesign, supplier switch, and circular recovery.
Verified environmental results: [paste results].
Business-case inputs: [paste cost, NPV, timing, and risk data].
Show a tornado sensitivity chart, uncertainty ranges, and a scenario scorecard.
Recommend one option only if it remains preferred under the tested assumptions.
List the assumption most likely to reverse the decision and the next approval gate.
Use a board-ready green consulting layout with editable charts, source notes, and an illustrative label for sample values.
Why these prompts work
Placeholders demand verified inputs
Slots like [insert finding], [insert quantified function] and [paste verified category values] sit next to "Mark unverified values as illustrative." The deck carries your numbers, not plausible-looking ones.
Exclusions are not zeros
The goal and scope prompt asks for cut-off rules and justified exclusions and says "Do not imply that excluded processes have zero impact," which keeps the boundary honest when two products are compared.
Data quality is on the slide
The inventory prompt splits primary data, secondary data, estimates and missing data in a heatmap, and the action title must state the largest data issue rather than hide it.
No unsupported winner
The impact prompt asks for a trade-off title plus one burden-shifting risk. The interpretation prompt recommends an option only if it holds under tested assumptions and names the assumption most likely to reverse it.
Adapt it to your own deck
Use your own LCA results
Fill the bracketed fields from your LCA report or software export, with units and sources. Attach the report and add: "Use only values from the attached file and cite the table for each figure."
Change the comparison
The impact prompt compares Alternative A and B on four categories. Rename the alternatives and swap categories to match your method, for example "Show eutrophication and land use instead of acidification and resource use."
Fit the audience and brand
For a thesis or journal audience, cut the NPV and business-case inputs and ask for "sensitivity and uncertainty results only." For a company review, pick your own template and add "Use the template colors instead of forest green."
Life cycle assessment FAQ
What is a life cycle assessment (LCA)?
A method for estimating the environmental impacts of a product or service across its life, from raw material extraction through production, use and end of life. ISO 14040 and 14044 organize it in four phases: goal and scope, inventory analysis, impact assessment and interpretation.
What should an LCA presentation include?
At minimum the functional unit, system boundary, data sources and their quality, results by impact category and life cycle stage, and the study's limits. These prompts give each phase one slide, so the deck follows the same order as the study.
Can I use these prompts in ChatGPT, Claude or Gemini?
Yes. A chat assistant returns slide text and an outline you then lay out yourself. In Tosea you attach your LCA report with the prompt, pick a template and get slides you can edit and export to PowerPoint (.pptx).
Will the prompts fill in missing LCA data?
No. They tell the model not to invent or calculate missing values unless a stated assumption supports them, and to label sample values as illustrative. The example slides use illustrative figures, so replace them with your own results.
Figures on the example slides are illustrative.
Prefer not to write a prompt?
Upload the document. Tosea drafts the deck, you edit and export.
Start for free