How to Create a BCG-Style Life Cycle Assessment PowerPoint with AI
Turn the four ISO 14040 LCA phases into a five-slide decision deck: functional unit, system boundary, inventory quality, hotspot comparison, and sensitivity-tested recommendation.
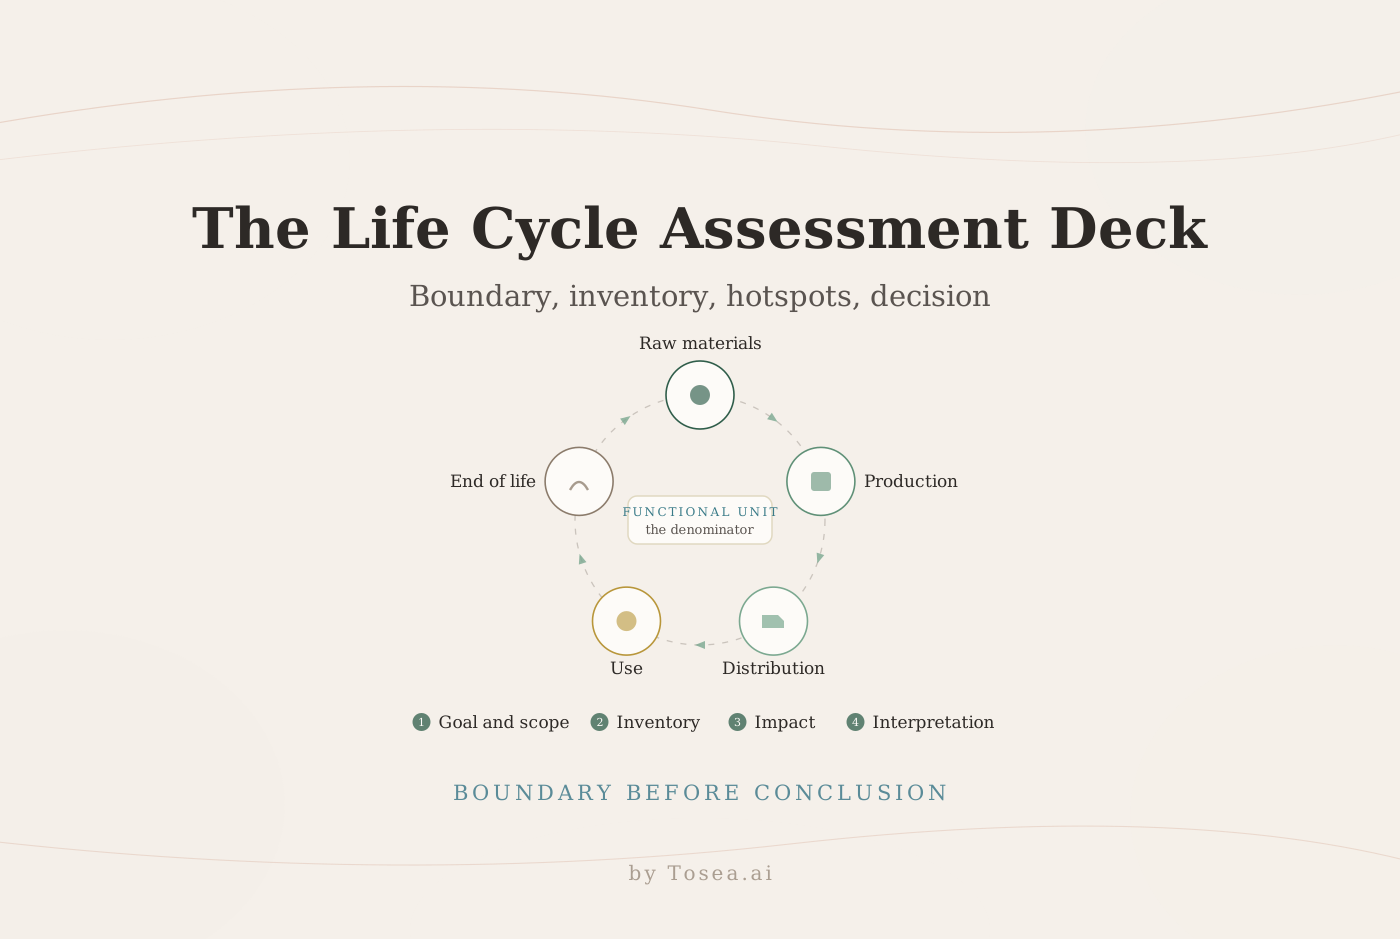
A useful Life Cycle Assessment PowerPoint does more than show a circular product journey. It explains what was studied, where the boundary sits, which data supports the model, where environmental burdens concentrate, and what management should do next. This guide turns the four LCA phases into a decision-led deck, with original consulting-style examples and prompts that analysts can reuse.
Quick answer: Build the deck around five pages: an executive life cycle overview, a goal and scope page, a life cycle inventory page, an impact hotspot comparison, and an interpretation page with sensitivity analysis and a recommendation.
The LCA method is standardized through ISO 14040 and ISO 14044. The green consulting treatment in this article is an original visual system inspired by the discipline of top strategy decks. It does not reproduce BCG templates or imply affiliation with BCG.
Contents
- What life cycle assessment covers
- Which study type the deck is reporting
- How to structure an LCA consulting deck
- Getting the functional unit right
- Five slide use cases with reusable AI prompts
- Why LCA decks fail review
- Building and revising the deck in Tosea AI
- LCA slide quality checklist
- Frequently asked questions
What Life Cycle Assessment Covers
Life cycle assessment evaluates the potential environmental impacts of a product, process, or service across its life cycle. A cradle-to-grave study can cover raw materials, manufacturing, distribution, use, recycling, and disposal. Disclose any narrower boundary.
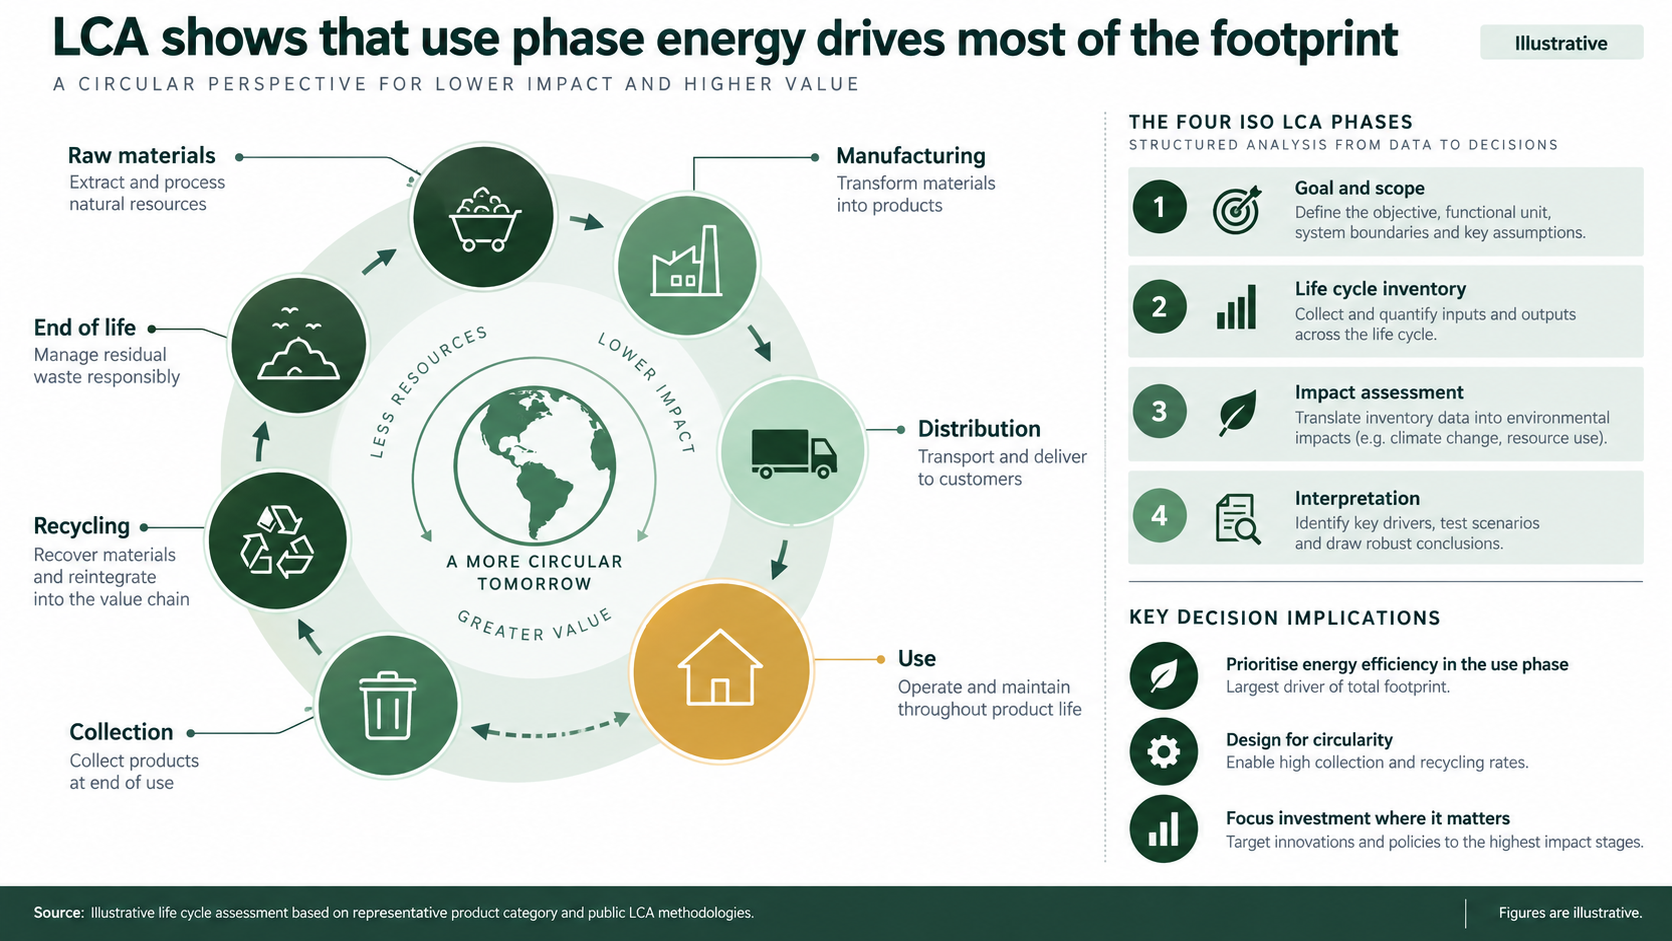
ISO 14040 describes four interrelated phases:
- Goal and scope definition
- Life cycle inventory analysis, usually shortened to LCI
- Life cycle impact assessment, usually shortened to LCIA
- Life cycle interpretation
ISO 14044 provides requirements and guidance for the study. The phases are iterative. Data gaps may force a boundary change, while interpretation may require another sensitivity test. That iteration is worth showing in the deck rather than hiding, because a study that never revised its boundary usually means nobody stress-tested it.
An LCA is broader than a product carbon footprint. Carbon is one category. Depending on the method, LCA may also assess water, acidification, land use, resource depletion, toxicity, and other categories. The European Commission Product Environmental Footprint method is a harmonized approach based on LCA.
Which Study Type the Deck Is Reporting
Before the first slide is drawn, the deck needs to declare what kind of study it summarizes. Audiences routinely conflate three different things, and the confusion surfaces during Q&A rather than during review.
| Study type | Question it answers | Typical use in a deck |
|---|---|---|
| Cradle-to-gate | What burden does the product carry when it leaves our facility? | Supplier comparison, procurement decisions |
| Cradle-to-grave | What is the burden across the full life, including use and disposal? | Product redesign, portfolio claims |
| Cradle-to-cradle | What changes when materials re-enter a new life cycle? | Circularity and recovery programs |
A second distinction matters just as much. An attributional study describes the burdens of an existing system as it operates today. A consequential study estimates how burdens would change if a decision were made. They frequently produce different answers for the same product, and a deck that mixes them will recommend an action the model never tested. State which one applies in the goal and scope slide, in plain language.
How to Structure an LCA Consulting Deck
Start with the decision. The deck may support a supplier choice, material comparison, or hotspot reduction plan. Make that decision visible on page one.
Then apply five rules.
- Use action titles that state the finding.
- Keep the functional unit and system boundary visible wherever alternatives are compared.
- Separate measured primary data from secondary database values and estimates.
- Show units, periods, geography, allocation rules, and material exclusions.
- End with a recommendation, uncertainty, and a next decision gate.
Allocation deserves particular attention, because it is where two honest analysts most often diverge. ISO 14044 sets a hierarchy: avoid allocation where possible by subdividing the process or expanding the system, then allocate on an underlying physical relationship, and only then fall back to another relationship such as economic value. Whichever step the study reached, the slide should name it. A recommendation that depends on economic allocation is a different kind of claim from one that survives physical allocation.
Getting the Functional Unit Right
The functional unit is essential. Two packages are not comparable if they deliver different volumes or protection. The functional unit defines the quantified service and creates a common denominator for results.
A workable functional unit has four parts: the function, the quantity, the duration or lifetime, and the quality level. "One beverage container" is not a functional unit. "Delivery of 1,000 litres of beverage to the consumer over a 12-month distribution cycle, with a shelf-life of at least nine months" is.
| Weak functional unit | Why it fails | Stronger version |
|---|---|---|
| One packaging unit | Ignores different volumes | Packaging needed to deliver 1,000 L of product |
| One square metre of coating | Ignores service life | 1 m² protected for 15 years, including recoating |
| One laptop | Ignores duty cycle and lifetime | One laptop supporting 8 hours daily use for 5 years |
When the functional unit changes, the ranking of alternatives can change with it. That sensitivity belongs on the interpretation slide, not in a footnote.
Use Case 1: Executive Life Cycle Overview
Use the overview page for executives. Show the product journey, four LCA phases, largest hotspot, and main implications. Keep detailed flows in later pages.
The evidence this page must carry: the boundary in one line, the single largest hotspot, and three implications. The failure mode: a decorative circular diagram with no finding attached, which turns the flagship page into an illustration.
Reusable AI prompt
Create one 16:9 Life Cycle Assessment PowerPoint slide for an executive review.
Decision: identify where management should focus reduction investment.
Show the product life cycle from raw materials through manufacturing, distribution, use, collection, recycling, and end of life.
Connect the journey to the four LCA phases: goal and scope, inventory, impact assessment, and interpretation.
Use this verified finding as the action title: [insert finding].
Add three implications and one limitation.
Use an original forest-green consulting layout with a source footer.
Mark unverified values as illustrative and do not invent missing data.
Use Case 2: Goal and Scope Definition
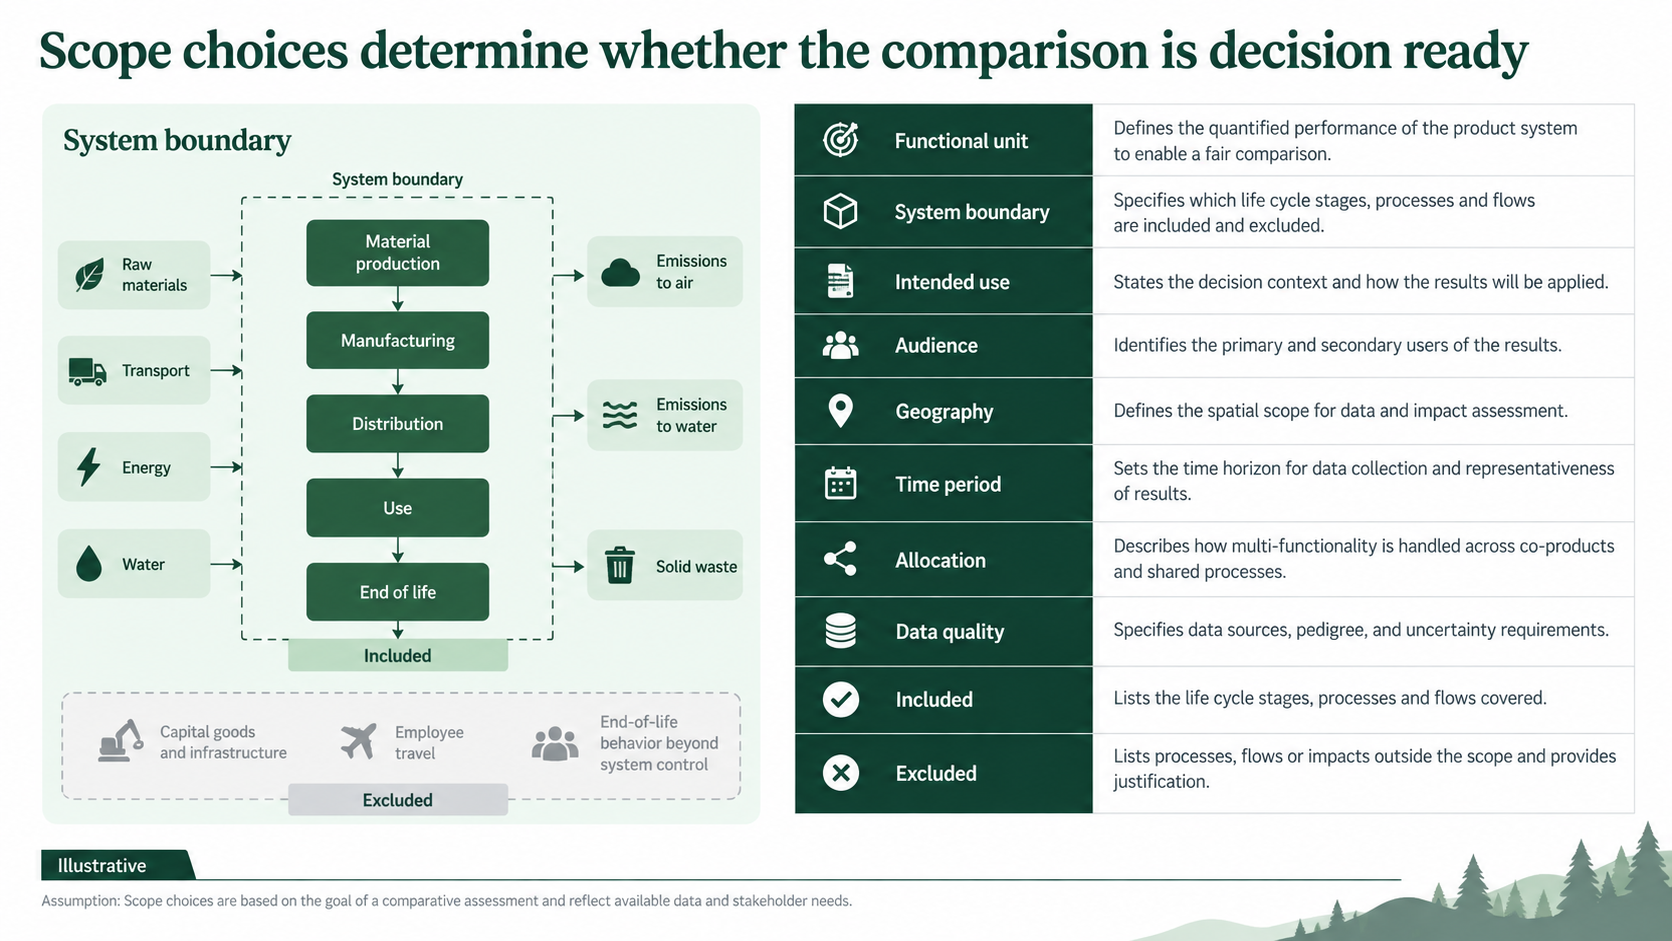
The goal and scope page determines whether the comparison is fit for its intended use. Show the application, audience, functional unit, boundary, geography, time period, data requirements, allocation, and exclusions.
Four fields deserve visual priority: intended application, intended audience, scope, and system boundary. Keep the remaining assumptions in an appendix. A slide is not a substitute for a complete study record.
The evidence this page must carry: functional unit, boundary diagram, allocation rule, and cut-off criteria. The failure mode: exclusions listed without justification, which invites the reviewer to assume the excluded stage was inconvenient rather than immaterial.
Reusable AI prompt
Create one 16:9 goal and scope slide for an LCA comparison.
Decision context: [insert decision].
Functional unit: [insert quantified function].
System boundary: [insert included stages and processes].
Also show intended use, audience, geography, time period, allocation method, data quality requirements, cut-off rules, and justified exclusions.
Draw the system boundary as a process diagram and place the scope choices in a compact table.
Use a restrained green and white consulting design with editable elements and a source note.
Do not imply that excluded processes have zero impact.
Use Case 3: Life Cycle Inventory Analysis
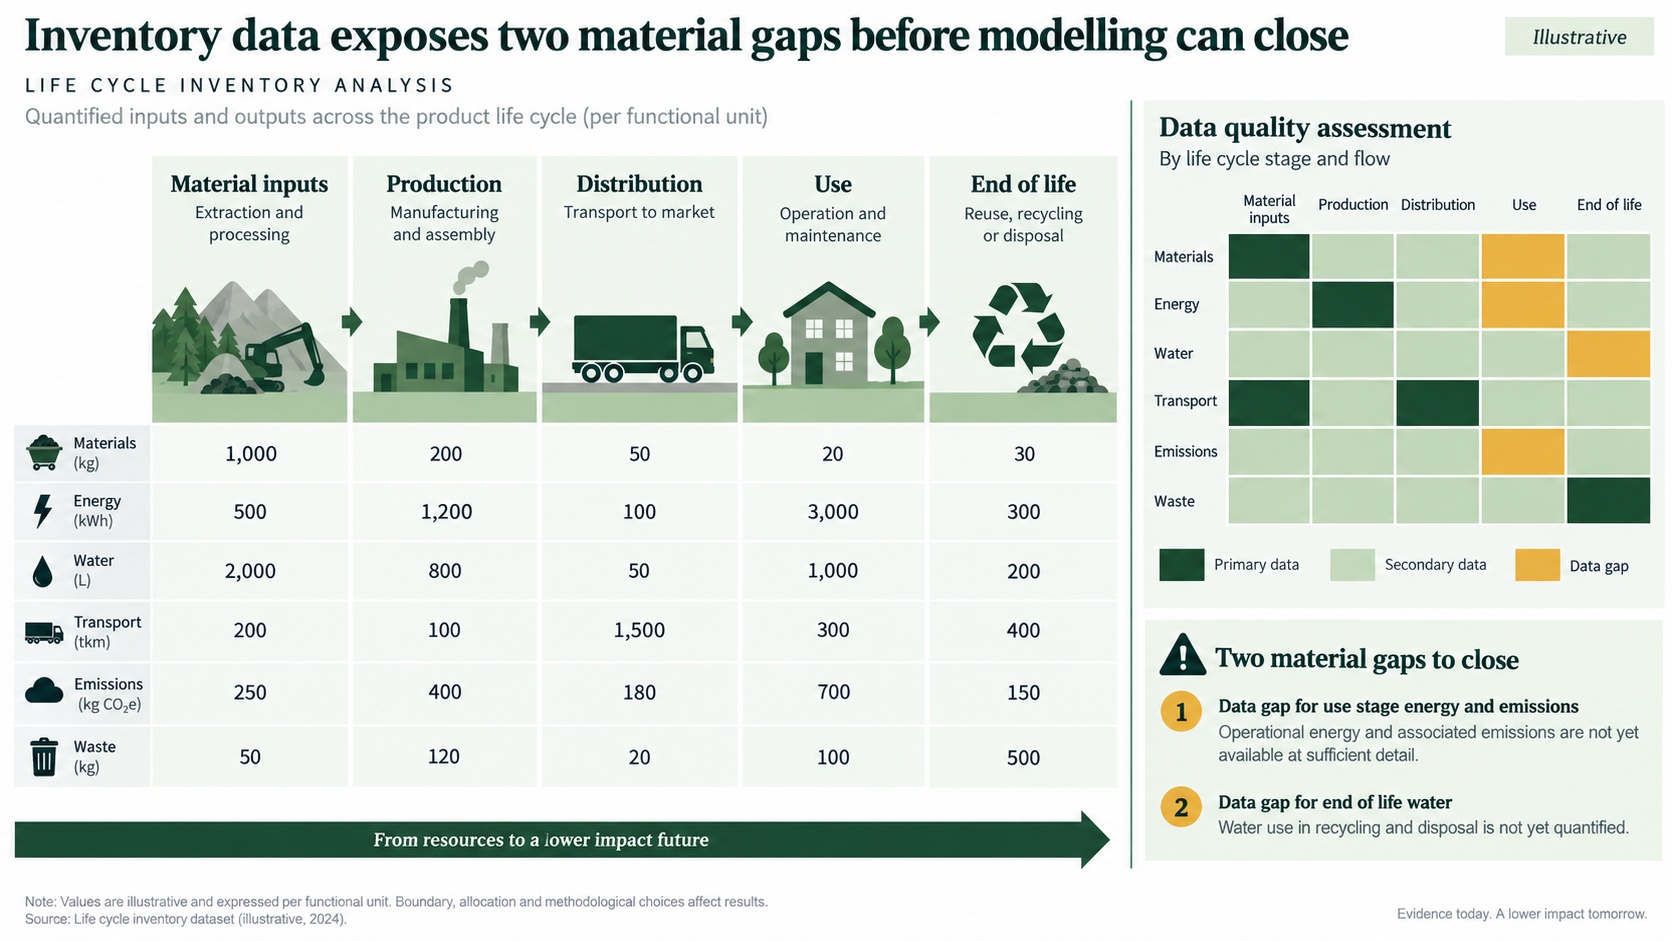
LCI converts the boundary into quantified flows. Inputs include materials, energy, water, and transport. Outputs include products, co-products, emissions, and waste. Relate every flow to the functional unit.
For PowerPoint, pair a process map with a data-quality heatmap. Distinguish primary data, secondary data, and gaps so reviewers can see which findings depend on assumptions. Most LCA methods score data quality along familiar axes — how recent the data is, how well it matches the technology, and how well it matches the geography — and a three-color heatmap communicates that faster than a paragraph.
The US EPA LCA guidance covers energy, water, materials, and environmental releases. Keep the full inventory in the appendix.
The evidence this page must carry: flows per functional unit, data source class for each flow, and the reporting period. The failure mode: a dense flow table with no quality marking, where a measured value and a database proxy look identical.
Reusable AI prompt
Create one 16:9 life cycle inventory slide.
Functional unit: [insert unit].
Stages: raw materials, production, distribution, use, and end of life.
Verified flows: [paste materials, energy, water, transport, emissions, and waste data with units and sources].
Draw a left-to-right process map and a data-quality heatmap.
Distinguish primary data, secondary data, estimates, and missing data.
Use an action title that states the largest data issue.
Add the reporting period, geography, allocation rule, and source footer.
Do not calculate or fill missing values unless a stated assumption supports them.
Use Case 4: Impact Assessment and Hotspot Comparison
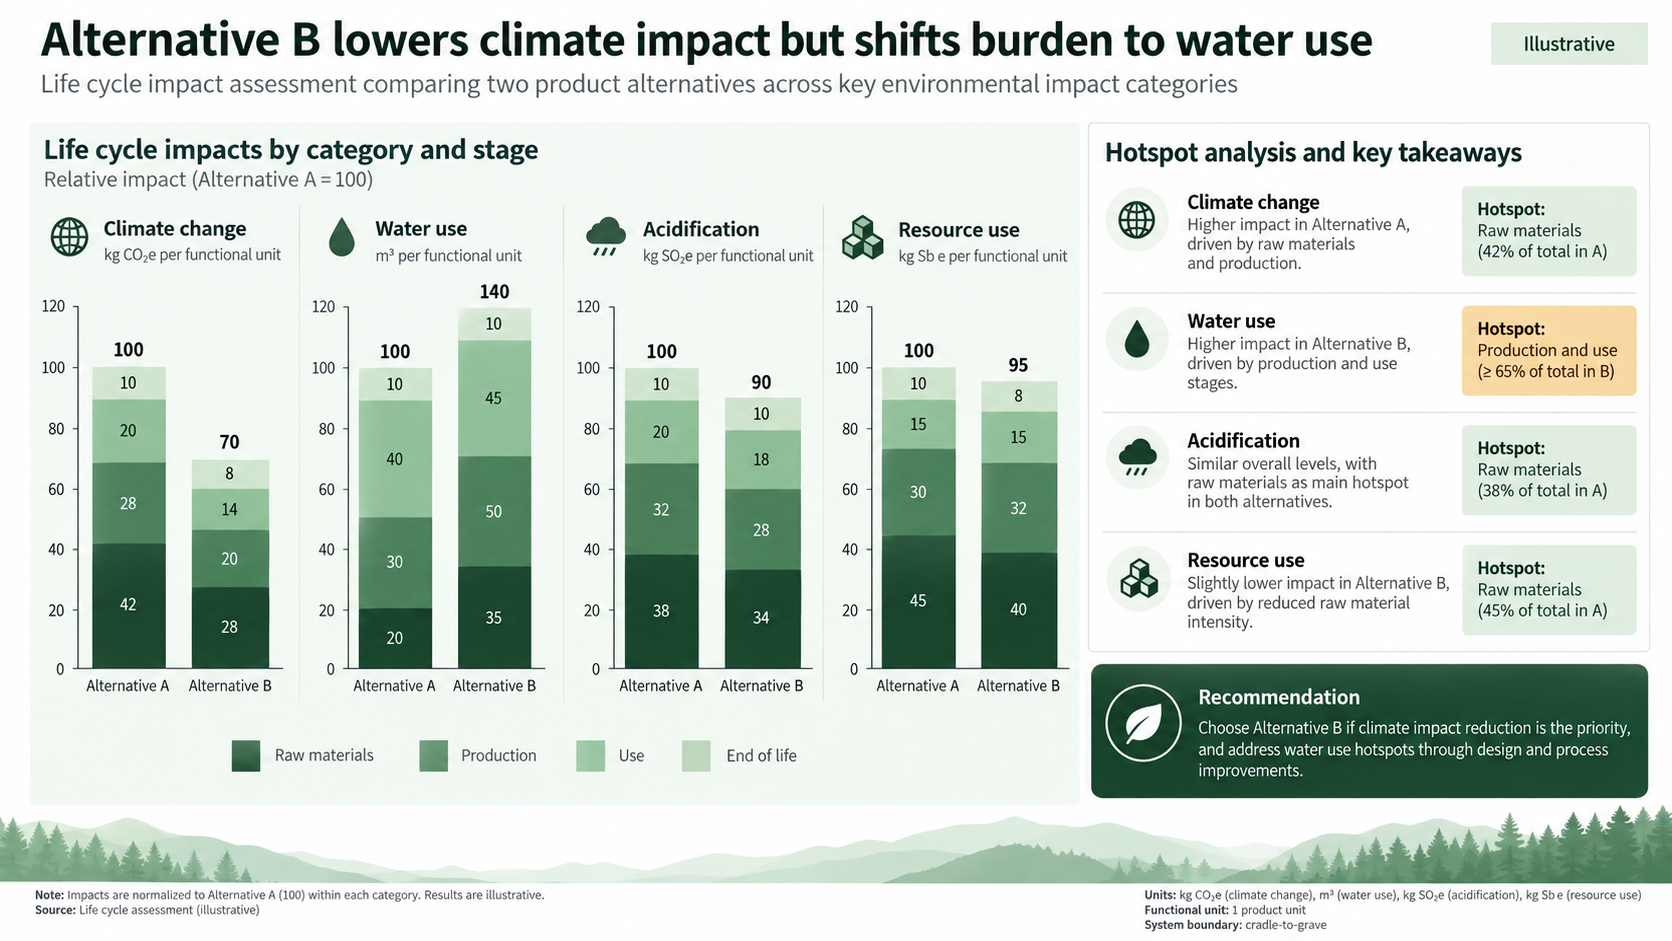
LCIA connects inventory flows to impact categories. Preserve category units and disclose any normalization or weighting. Expose burden shifting, such as lower climate impact paired with higher water use.
Use small multiples or stacked bars to compare alternatives by category and stage. Label the functional unit, method, geography, period, and normalization. Keep underlying categories available for review.
The example below shows why this page carries the argument. Indexed to Alternative A at 100, Alternative B cuts climate impact to 70 and resource use to 95, holds acidification at 90 — and raises water use to 140. Presented as a single "greener option" claim, that trade-off disappears. Presented as four category panels with stage-level splits, the deck gives the committee the one thing it needs: the knowledge that choosing B means owning a water program.
The evidence this page must carry: category units, the baseline for any indexing, and stage-level contribution. The failure mode: declaring a winner across categories that use different units, which is not a finding but an opinion.
Reusable AI prompt
Create one 16:9 life cycle impact assessment slide comparing Alternative A and Alternative B.
Functional unit: [insert unit].
Impact results: [paste verified category values, units, stages, and sources].
Use small stacked bars for climate change, water use, acidification, and resource use.
Identify the largest stage-level hotspot in each category.
State whether results are absolute or normalized.
Write an action title that describes the trade-off without declaring an unsupported winner.
Add one recommendation and one burden-shifting risk.
Use an original green consulting page system with an explicit illustrative label where needed.
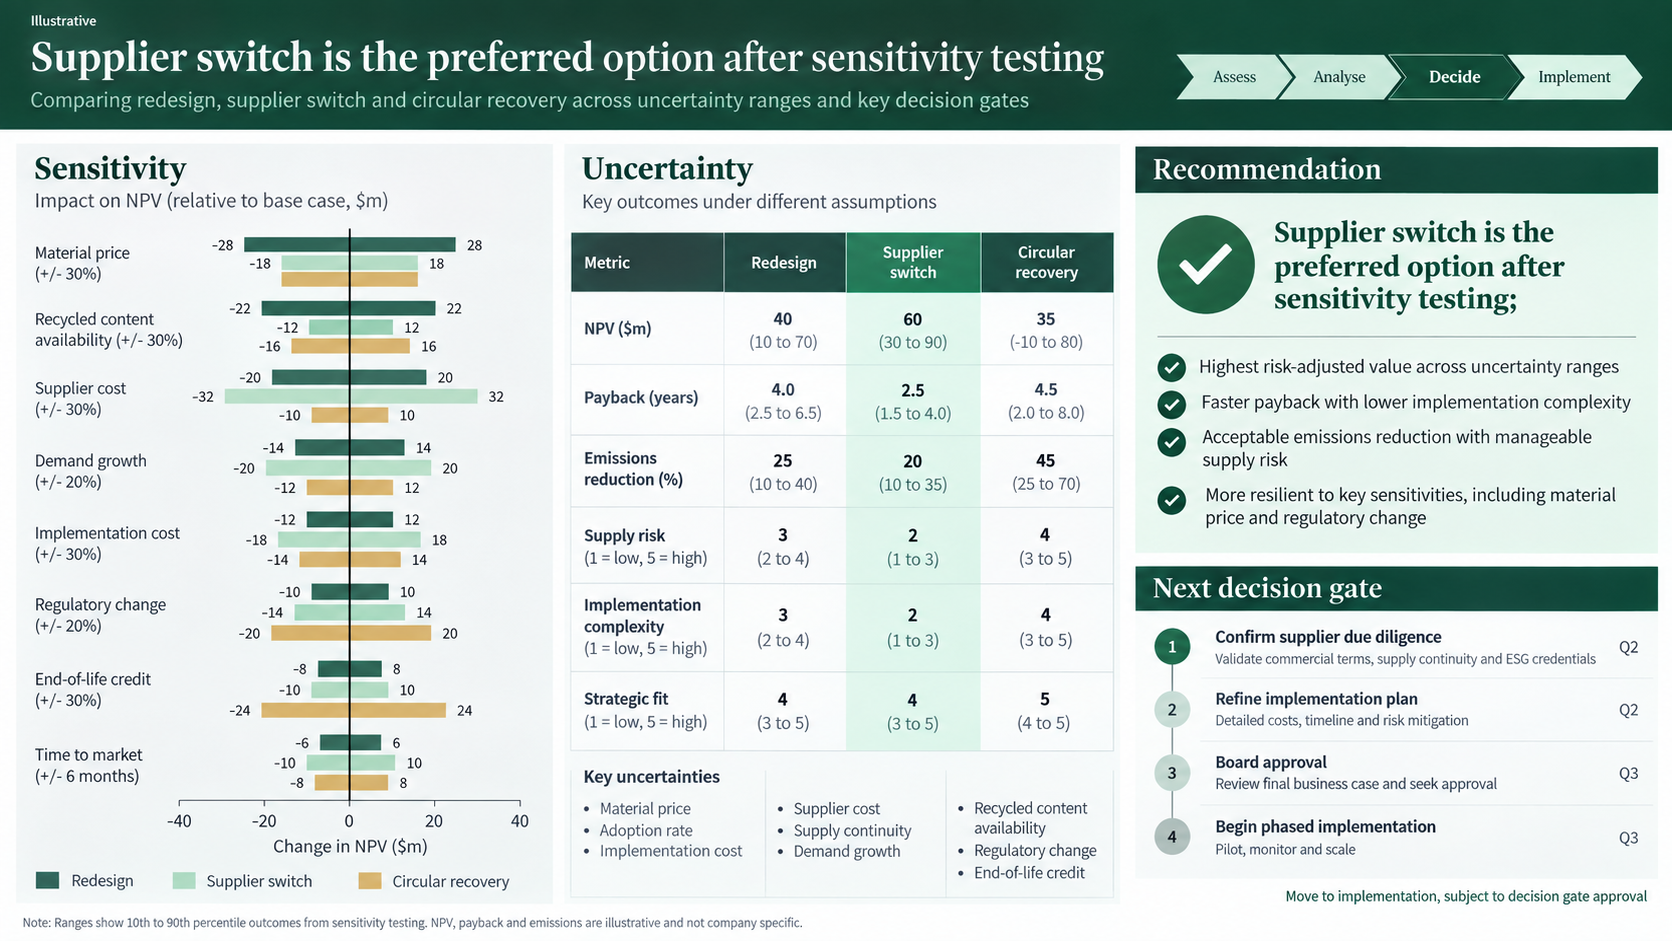
Use Case 5: Interpretation and Scenario Decision
Interpretation turns the model into a choice. Test completeness, consistency, sensitivity, and uncertainty. Show whether the preferred option survives changes in material prices, energy mix, allocation, or end-of-life credits.
A tornado chart, uncertainty ranges, and an option scorecard support approval. Keep environmental and financial metrics separate unless the method connects them. State what would reverse the recommendation.
The evidence this page must carry: the ranked sensitivity of the decision to each assumption, and the threshold at which the ranking flips. The failure mode: a recommendation with an uncertainty band wide enough to contain the alternative, presented as if it were settled.
Reusable AI prompt
Create one 16:9 LCA interpretation slide for a management decision.
Options: redesign, supplier switch, and circular recovery.
Verified environmental results: [paste results].
Business-case inputs: [paste cost, NPV, timing, and risk data].
Show a tornado sensitivity chart, uncertainty ranges, and a scenario scorecard.
Recommend one option only if it remains preferred under the tested assumptions.
List the assumption most likely to reverse the decision and the next approval gate.
Use a board-ready green consulting layout with editable charts, source notes, and an illustrative label for sample values.
Why LCA Decks Fail Review
Sustainability teams tend to lose review cycles on the same five points, and none of them are about chart styling.
The comparison is not like-for-like. Two alternatives modeled with different boundaries or different functional units cannot be compared, however clean the bar chart looks. Put both boundaries on the comparison page.
Normalization is applied silently. Indexing to a baseline of 100 is useful, but if the slide does not say what the baseline is, a reader will assume the numbers are absolute and quote them externally.
The claim outruns the study. ISO 14044 sets additional requirements for comparative assertions disclosed to the public, including critical review by interested parties. A deck intended for a marketing launch and a deck intended for an internal engineering decision are not the same artifact, and the goal and scope page should say which one it is.
End-of-life credits do the heavy lifting. When recycling credits drive the result, the recommendation depends on a collection rate the company may not control. Show the result with and without the credit.
Uncertainty is reported once and then ignored. If the executive summary states a clean conclusion that the appendix qualifies, the appendix will lose. Carry the qualification into the action title.
Build and Revise the Deck in Tosea AI
Tosea AI lets analysts choose the visual logic before rendering. At the outline stage, assign a life cycle diagram, system boundary, process flow, comparison chart, sensitivity chart, or decision table to each page.
After rendering, replace a layout or diagram without rebuilding the deck. Use Layout Only for approved wording, then review labels, functional units, footnotes, citations, and exclusions.
A practical workflow is simple:
- Upload the study, source PDFs, or an existing deck.
- Ask for a decision-led outline based on the four LCA phases.
- Choose the diagram for each slide at outline stage.
- Generate an original consulting theme.
- Change weak layouts after rendering and use Layout Only for approved wording.
- Export an editable PPTX and test it in the delivery environment.
One caution specific to this discipline: generated figures are illustrative until an analyst replaces them with study output. For LCA work that will be disclosed externally, treat every number on the slide as needing a manual check against the inventory model, and keep the units — kg CO₂e, m³, kg SO₂e — attached to the values rather than to the legend alone. Our guide on running presentations across global teams covers how to keep those conventions consistent when several regions contribute data.
LCA Slide Quality Checklist
- The action title states a supported finding.
- The functional unit and system boundary are visible.
- The study type — attributional or consequential — is declared.
- Primary, secondary, estimated, and missing data are distinguishable.
- Impact categories retain their units and method notes.
- The allocation rule and the step of the ISO hierarchy it came from are named.
- Scenario comparisons use the same scope and assumptions.
- Sensitivity analysis tests assumptions that can change the decision.
- Results are shown with and without end-of-life credits where those credits matter.
- Sources, exclusions, limitations, and illustrative values are disclosed.
Frequently Asked Questions
What is a functional unit in LCA?
The functional unit is the quantified service that alternatives must both deliver, and it is what makes a comparison valid. It should state the function, quantity, duration, and quality level — for example, packaging sufficient to deliver 1,000 litres of product with a nine-month shelf life, rather than "one container."
How is an LCA different from a carbon footprint?
A product carbon footprint reports one impact category, usually in kg CO₂e. An LCA can cover several categories — climate, water, acidification, resource use, and others — which is what makes burden shifting visible. A product can lower its carbon footprint while increasing water consumption, and only a multi-category study will show it.
Does an LCA slide deck need a critical review?
It depends on the claim. ISO 14044 attaches additional requirements, including critical review by interested parties, to comparative assertions intended for public disclosure. An internal deck supporting an engineering trade-off does not carry the same obligation as a public claim that one product is environmentally preferable to a competitor's.
Can Tosea AI redesign my existing PowerPoint without changing the content?
Yes. Export the PowerPoint as a PDF, upload it to Tosea AI, and request a redesign that keeps the original wording. Use Layout Only to refresh visual structure without intentional rewriting. Confirm that every label, footnote, and slide element remains complete.
How do I upload a PowerPoint and ask Tosea AI to redesign each slide?
Export the PowerPoint as a PDF. Upload it, explain that the content and sequence must stay intact, choose a template or describe the visual direction, generate the deck, and inspect every slide before exporting the revision.
Can I upload my own PowerPoint template to Tosea AI?
Tosea AI supports custom templates on eligible paid plans. Check that required layouts, fonts, colors, logo placement, and master-slide rules are represented before sharing the deck.
Can Tosea AI use custom brand colors, fonts, and a logo?
Yes. Specify the colors and fonts in the instructions and upload the logo or use a supported custom template. After export, verify font availability, color values, logo clear space, and contrast.
Can Tosea AI match the style of my old company presentations?
Tosea AI can use a representative company deck as design guidance. This does not mean permanent model training. For stronger consistency, use an approved template and compare the output with current brand guidelines.
Does Tosea AI preserve PowerPoint formatting after export?
Editable PPTX export is designed to remain close to the generated preview while keeping elements available for editing. Fonts, complex graphics, and software environments can affect the result, so test the file in the setup used for delivery.
Can I tell AI to edit the layout only and keep the exact wording?
Yes. Layout Only changes visual structure without intentionally rewriting content. Compare the edited slide with the source, especially labels, citations, footnotes, numbers, and line breaks.
Turn LCA Evidence into a Decision-Ready Deck
A strong Life Cycle Assessment PowerPoint keeps the science visible while making the decision easy to follow. Scope choices stay on the page, inventory quality is explicit, impact trade-offs are not hidden, and the final recommendation survives sensitivity testing.
Use Tosea AI to organize source material, choose diagrams during outlining, refine layouts after rendering, and export an editable presentation. For related techniques, read Best BCG Strategy Consulting PowerPoint Templates, the McKinsey-style 3C analysis guide, the cognitive architecture of logical consulting decks, and the GE McKinsey nine-box matrix guide for portfolio-level decisions.
Sources
- ISO 14040: Life cycle assessment — principles and framework — International Organization for Standardization
- ISO 14044: Life cycle assessment — requirements and guidelines — International Organization for Standardization
- Life Cycle Assessment: Principles and Practice — US Environmental Protection Agency
- Product Environmental Footprint method — European Commission
The slide examples and data in this article are illustrative. The images are original and do not contain BCG logos, proprietary templates, or confidential client work.