How to Build a Bain-Style PDCA Cycle PowerPoint with AI: Complete Guide
Build a Bain-style PDCA cycle PowerPoint with AI: the four stages, the eight-step method, four business slide examples with reusable prompts, and a pre-export checklist.
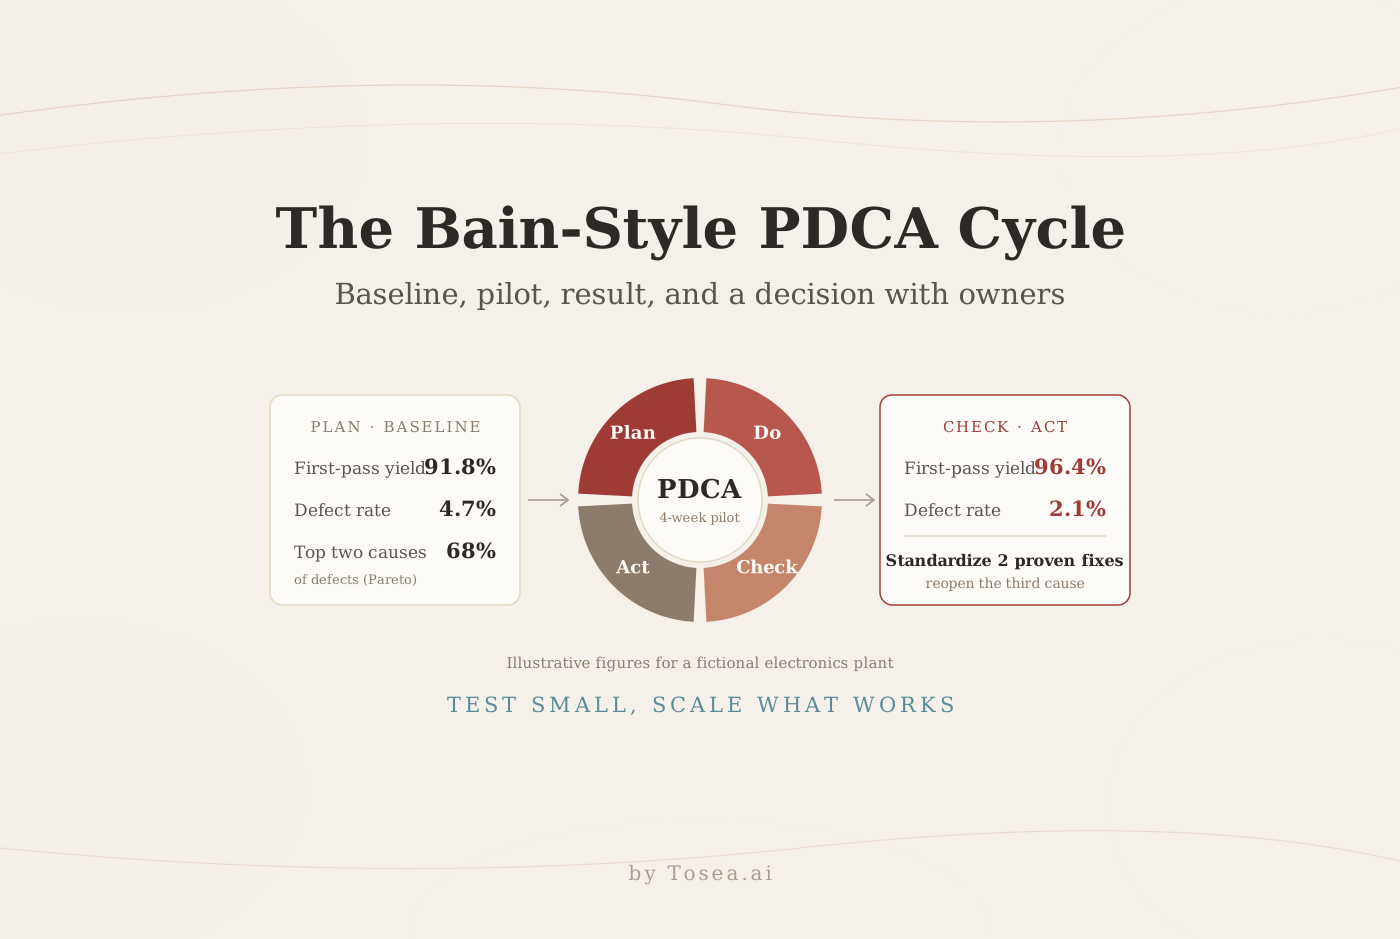
A Bain-style PDCA cycle PowerPoint should show how evidence moves from a problem to a tested change and then to a management decision. A circular diagram alone does not do that. This guide explains the four PDCA stages, the practical eight-step method, how PDCA compares with PDSA, DMAIC, and A3, and four business applications. It also shows how Tosea AI helps analysts turn source files into a reviewable storyline, editable charts, controlled layouts, and an editable PPTX.
The slide examples below are original editorial references built with fictional data. They are not Bain & Company templates, and Tosea AI is not affiliated with or endorsed by Bain & Company.
Quick answer: Define the problem and target in Plan. Run a limited test in Do. Compare results with the baseline in Check. In Act, standardize what worked, reject what did not, and move unresolved issues into the next cycle. Put the decision, evidence, owner, and next review date on the slide.
What is the PDCA cycle?
PDCA stands for Plan, Do, Check, Act. It is a repeatable method for improving a process, product, or service through a planned test and evidence-based follow-up.
| Stage | Management question | Minimum evidence for the slide |
|---|---|---|
| Plan | What problem are we solving, why does it occur, and what result do we expect? | Baseline, target, root-cause evidence, hypothesis, owner |
| Do | What change will we test, where, and for how long? | Pilot scope, action plan, resources, risks, measurement plan |
| Check | Did the result differ from the baseline and control? | Actual result, variance, side effects, confidence and limitations |
| Act | What should be standardized, revised, stopped, or tested next? | Decision, rollout conditions, updated standard, next-cycle backlog |
The American Society for Quality describes PDCA as a four-step model for carrying out change. One historical correction matters: the W. Edwards Deming Institute says Deming emphasized PDSA, with Study rather than Check. An executive Check page should therefore compare prediction with outcome, expose side effects, and state what the team learned.
PDCA, PDSA, DMAIC, and A3: which frame fits the slide?
Improvement teams often use several related methods, and a steering committee may have seen all of them. The choice changes what the slide has to prove.
| Method | Typical home | Best for | What the slide must show |
|---|---|---|---|
| PDCA | General management, operations, and quality teams | Fast, repeatable tests of a process change | Baseline, pilot, result, and decision |
| PDSA | Deming's preferred form; the core of the IHI Model for Improvement in healthcare | Learning cycles in which the prediction matters as much as the result | Prediction, observed result, and what was learned |
| DMAIC | Six Sigma projects (Define, Measure, Analyze, Improve, Control) | Variation-heavy problems that need statistical evidence | Measurement system, capability, and control plan |
| A3 report | Toyota-pioneered one-page problem-solving record | Summarizing one problem from start to finish | Problem, analysis, countermeasures, and action plan on one sheet |
The Lean Enterprise Institute describes the A3 as a practice of putting the problem, analysis, corrective actions, and action plan on a single large sheet. A consulting-style PDCA slide borrows the same discipline. The left side carries the problem and evidence, and the right side carries the countermeasures and follow-up.
For most business decks, the method name matters less than consistency. Pick one frame, label the stages the same way on every page, and do not switch from "Check" to "Study" halfway through the review. If the audience already runs Six Sigma projects, use DMAIC labels and move the PDCA logic into the Improve and Control pages.
The practical eight-step PDCA method
Many teams expand the four stages into eight working steps:
- Describe the current state and define the problem.
- Identify possible causes using data, process maps, 4M, 5W2H, or a fishbone diagram.
- Separate primary causes from plausible but weak explanations.
- Design countermeasures with owners, timing, targets, and measurement rules.
- Run the change on a limited scope.
- Compare results with the baseline, target, and a control where possible.
- Standardize successful changes and update procedures, training, and controls.
- Move unresolved issues into the next cycle with a revised hypothesis.
Use a Pareto chart to prioritize observed categories, then validate causes with process evidence or an experiment. A large category is not automatically the root cause.
How to design a consulting-grade PDCA slide
A useful PDCA page carries five elements: an action title, measurable baseline, tested change, result, and decision. If the title says the pilot improved quality, show the starting value, final value, period, scope, and source.
Keep actuals, estimates, and targets distinct. Use one accent color for the recommendation and neutral gray elsewhere. The final box should say standardize, extend, revise, or stop. Continue monitoring requires an owner, threshold, and date.
How to structure a PDCA storyline across a deck
A single PDCA slide works for a status update. A steering-committee review usually needs six to eight pages, each answering one question in the order the committee will ask it:
- Executive summary: the decision requested, the headline result, and what remains open.
- Baseline and problem definition: the metric definition, measurement period, and gap to target.
- Root-cause evidence: a Pareto or segmentation view, plus the evidence that validated the primary causes.
- Pilot design: scope, owner, duration, measurement plan, and the stop condition.
- Results against baseline and control: the primary metric first, then side effects and control metrics.
- Act decision: one line per countermeasure, labeled standardize, extend, revise, or stop.
- Next-cycle backlog: unresolved causes, revised hypotheses, owners, and review dates.
Put metric definitions, data sources, and calculation notes in an appendix so the main pages stay readable. Write the action titles first and read them in sequence. If the titles alone do not tell the story, the charts will not rescue it. Our BCG-style storyline guide covers the same answer-first logic for strategy decks, and the Bain-style decision-making frameworks guide shows how to make the decision owner explicit on the final page.
Use case 1: reduce manufacturing defects
Manufacturing teams use PDCA to improve yield, scrap, downtime, safety, or delivery. Start with a Pareto view, then investigate the largest categories using a fishbone diagram or 4M analysis.
The slide below combines the eight steps with a defect Pareto and before-versus-after metrics. The defect counts sum to 1,000, so the cumulative line reconciles with the bars. It also avoids a common mistake: one issue remains unresolved, so the recommendation standardizes only the fixes that the pilot actually proved.
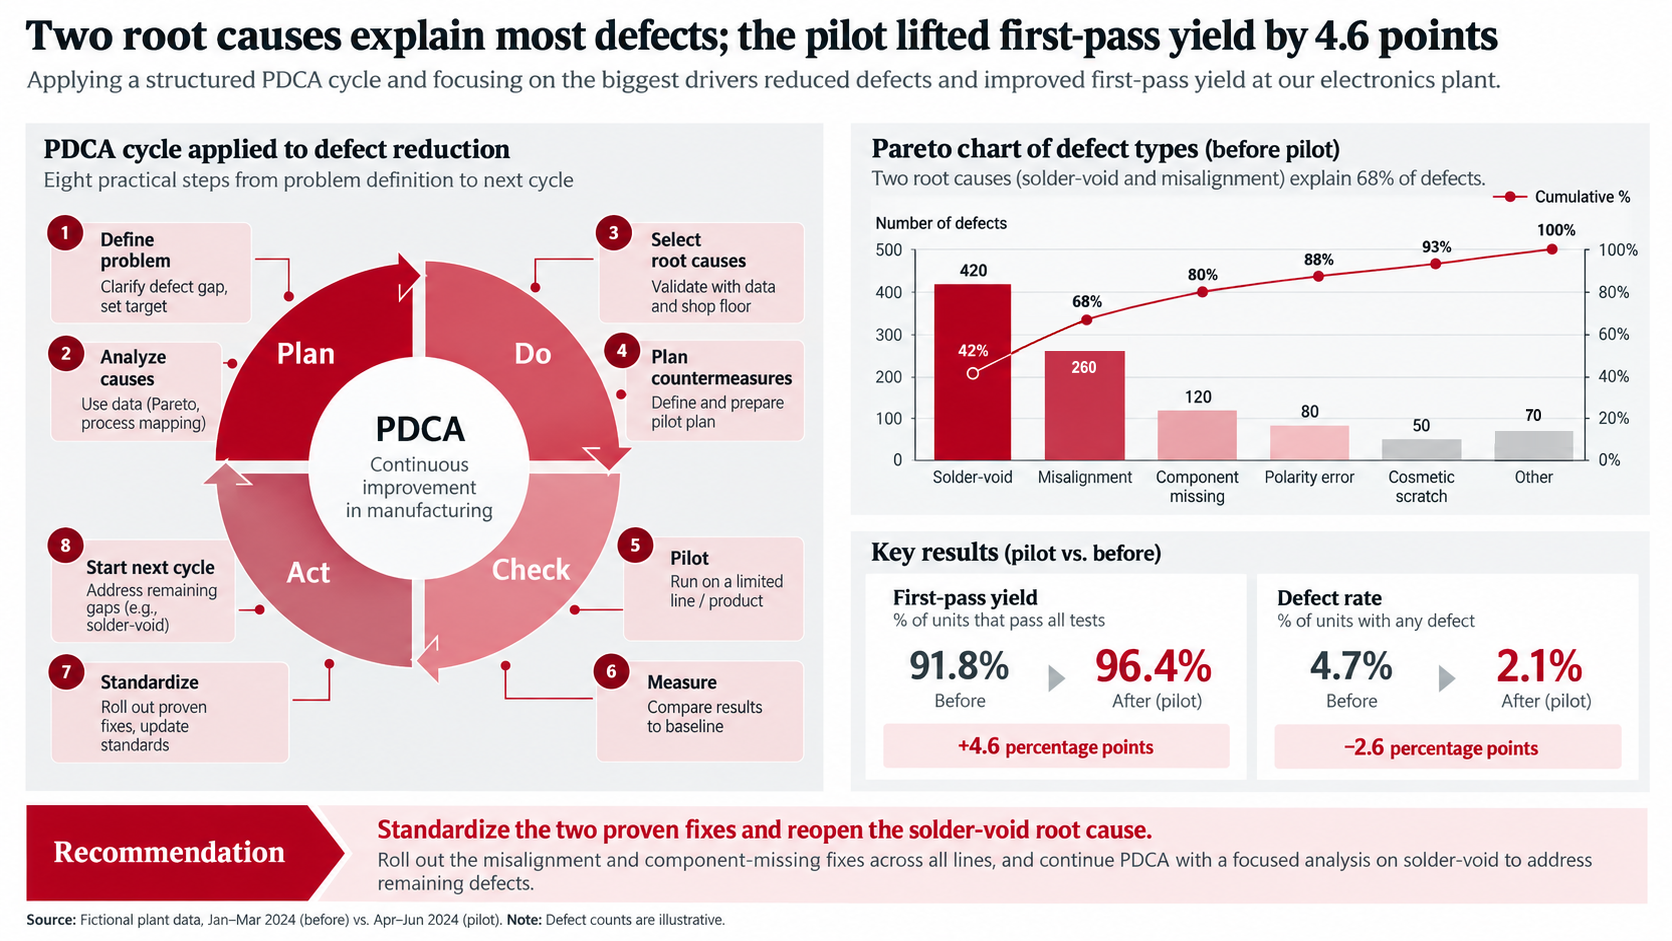
Illustrative example: fictional electronics-plant data. The figures are not industry benchmarks.
Reusable AI prompt
Create one 16:9 executive PDCA slide for manufacturing quality. Audience: plant leadership. Problem: [problem]. Use only these verified inputs: [baseline, defect categories, periods, root-cause evidence, pilot results, targets, sources]. Show the eight PDCA steps, a Pareto chart, and before-versus-after quality metrics. Distinguish proven fixes from unresolved causes. Write a conclusion-led title and a specific Act decision. Use a restrained red, charcoal, gray, and white consulting layout. Label illustrative or estimated values. Do not invent data.
Use case 2: recover project delivery
PDCA works when a transformation repeatedly misses milestones. Late delivery is a symptom; delayed scope decisions, unclear acceptance criteria, weak product-owner availability, or poor change control may be causes.
Test a small operating change such as a weekly scope gate, shared acceptance template, or fixed decision cadence. Then compare completion, approval time, and rework with the baseline. For recurring updates on the same program, our project status report templates guide shows how to carry the pilot gates into the weekly report.
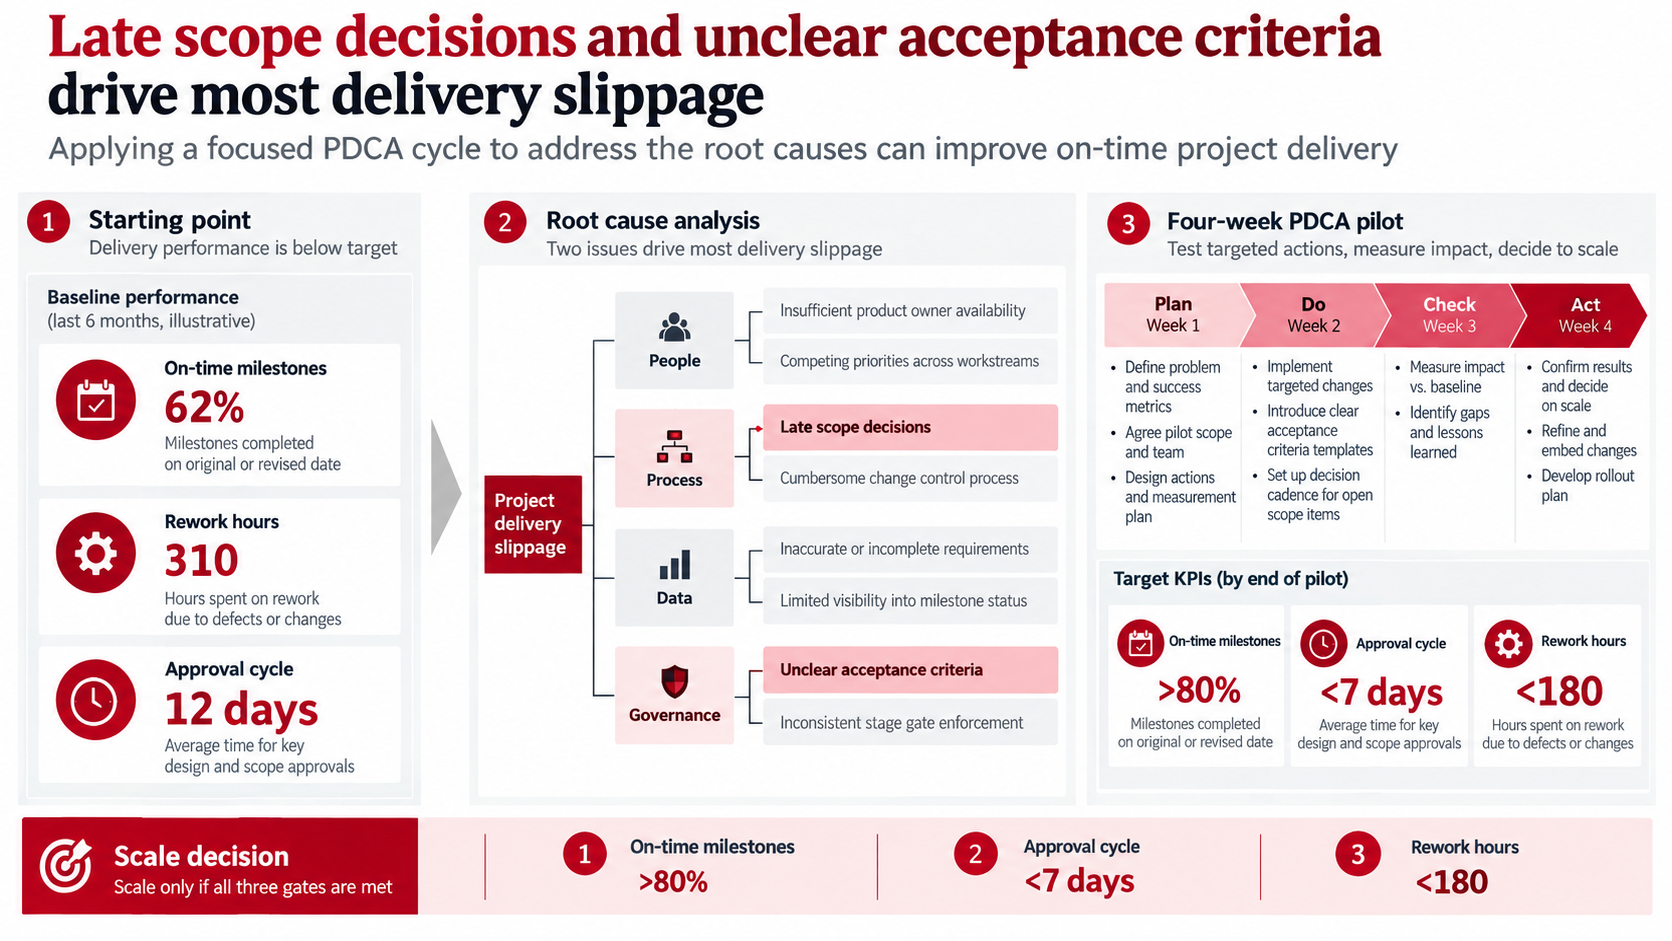
Illustrative example: a four-week pilot links two root causes to three measurable scale gates.
Reusable AI prompt
Build one 16:9 PDCA slide for a delayed project or transformation. Use these verified sources: [milestone data, rework, approval times, interviews, process evidence]. Show the baseline on the left, a cause tree in the center, and a four-week Plan-Do-Check-Act pilot on the right. Highlight no more than two primary causes. Define three measurable gates for scaling and include a stop condition. Write an action title that names the cause, not only the delay. Do not fabricate metrics.
Use case 3: improve customer service
Customer service teams use PDCA to reduce repeat contacts, handling time, complaints, or escalation. Segment the problem first because billing, setup, and product defects need different countermeasures.
A useful pilot includes a control group or unchanged channel to separate the intervention from seasonality. Act can standardize one change, keep another in test, and reject a weak third.
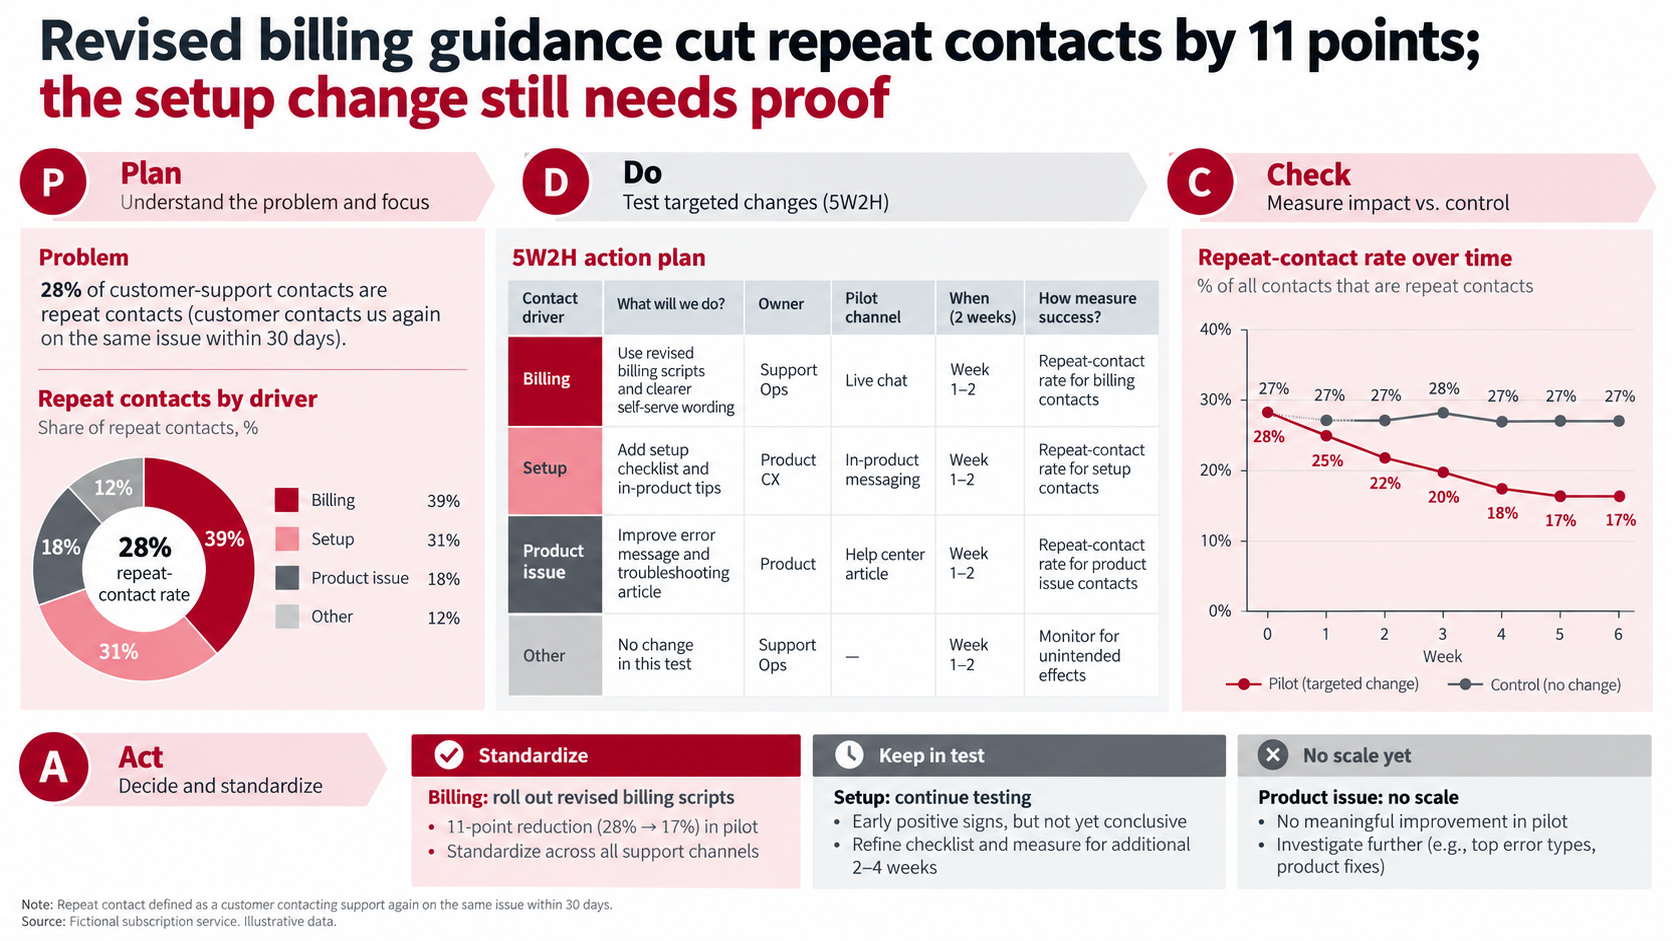
Illustrative example: the billing change meets the evidence threshold, while other fixes remain unproven.
Reusable AI prompt
Create one 16:9 customer-service PDCA slide. Problem: [metric and definition]. Segment the baseline by contact driver, channel, or customer group. Use only verified data from [sources]. Build a 5W2H pilot plan with action, owner, channel, timing, and success measure. Compare pilot and control trends. In Act, classify each countermeasure as Standardize, Keep in test, Revise, or Stop. Add limitations and source notes. Do not invent causal claims.
Use case 4: remove cost without weakening control
Finance teams use PDCA to reduce cost, cycle time, errors, and manual work. A faster invoice process is not better if duplicate payments or policy exceptions increase.
Map the current process, mark bottlenecks, and test specific countermeasures. A waterfall can show how each action changes cost or time. The final decision table should separate changes worth standardizing from changes that need a broader test or should be rejected.
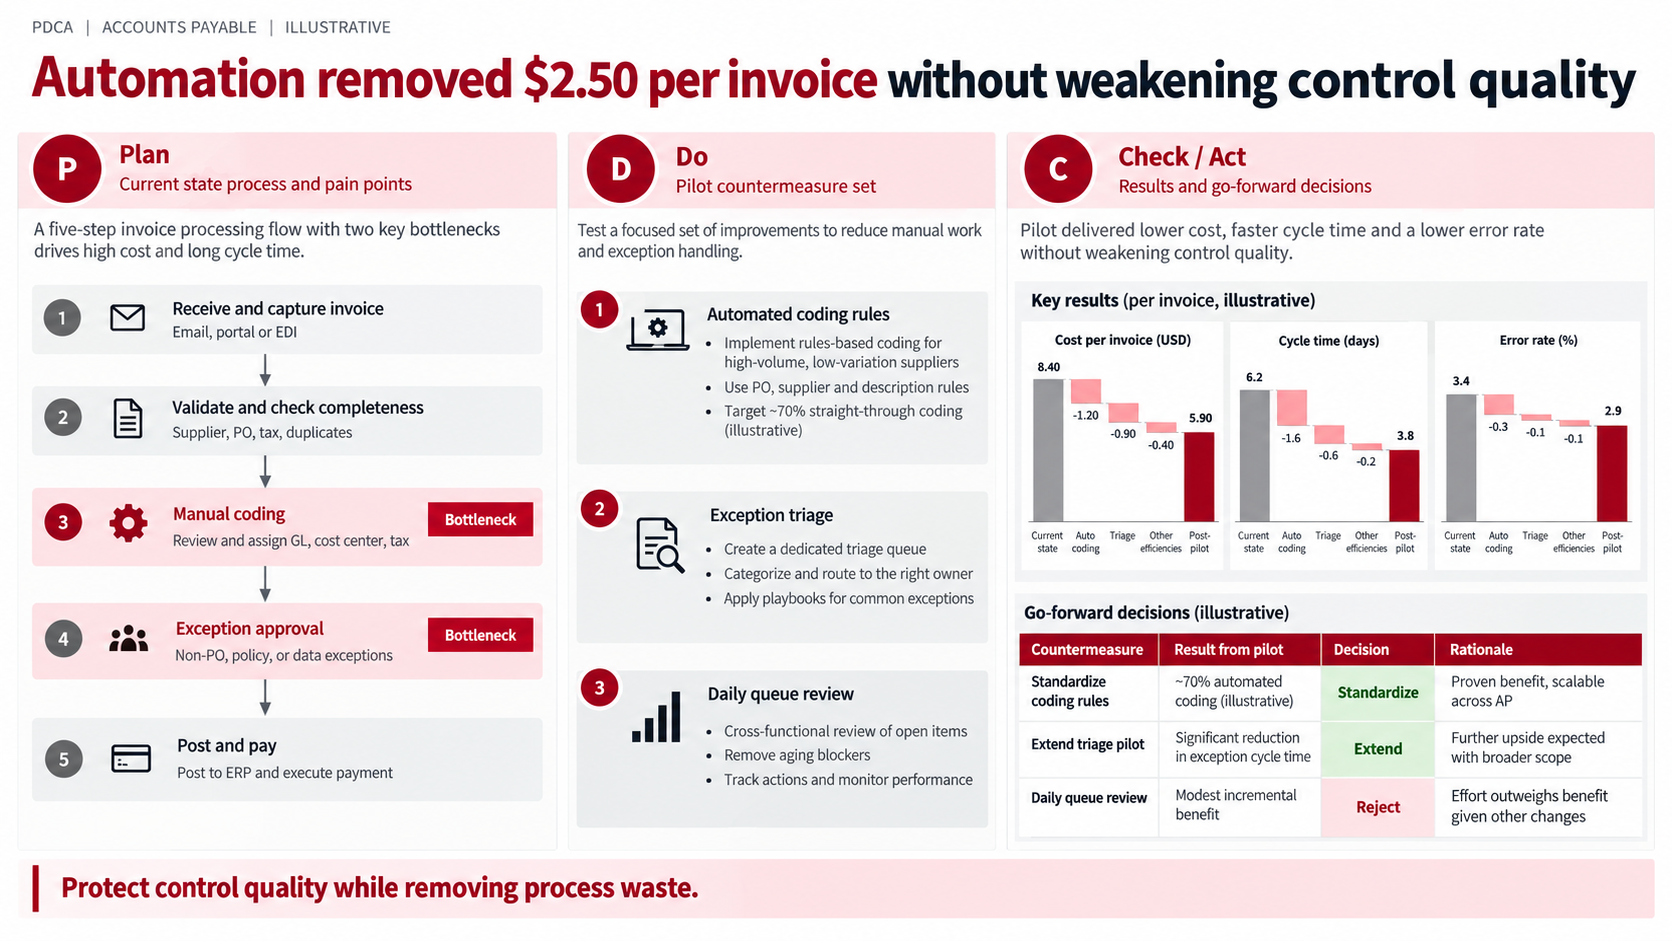
Illustrative example: automation lowers cost and time while the control metric remains visible.
Reusable AI prompt
Create one 16:9 finance-process PDCA slide. Map the current process and mark the two largest verified bottlenecks. Pilot these countermeasures: [actions]. Show cost, cycle time, error rate, and control-quality measures before and after. Use a waterfall or variance chart for quantified effects. End with a decision table that labels each action Standardize, Extend, Revise, or Reject, with rationale and owner. Preserve units, periods, and sources. Do not invent savings.
Common PDCA slide mistakes
Most weak PDCA decks fail in the same few places. Check for these before the review:
- Declaring success from one period. A single good month can be seasonality. Show a control group, an unchanged channel, or a comparable prior period.
- Moving the goalposts. If the metric definition, denominator, or scope changed between Plan and Check, the comparison is invalid. Restate the definition on the results page.
- Treating the largest Pareto bar as the root cause. The Pareto shows where defects concentrate, not why they occur. Validate causes with process evidence before assigning countermeasures.
- Reporting only the target metric. A faster process that raises errors or policy exceptions has not improved. Put at least one control metric next to the primary result.
- Testing too many changes at once. Six simultaneous countermeasures make it impossible to attribute the effect. Keep the pilot small enough that each action can be judged on its own.
- Writing a vague Act box. "Continue monitoring" is not a decision. Name the owner, the threshold that would trigger action, and the next review date.
The same discipline applies to any executive data page. Our guide to presenting sales data to executives uses a similar baseline, driver, and decision structure.
Use Tosea AI Data Studio for editable PDCA evidence
Improvement evidence often arrives in Excel, CSV files, PDF tables, or screenshots. Tosea AI Data Studio can import Excel and CSV data, recognize values from charts and tables, and rebuild them as editable presentation visuals. The AI think-cell alternative guide walks through the chart types and styling options in more detail.
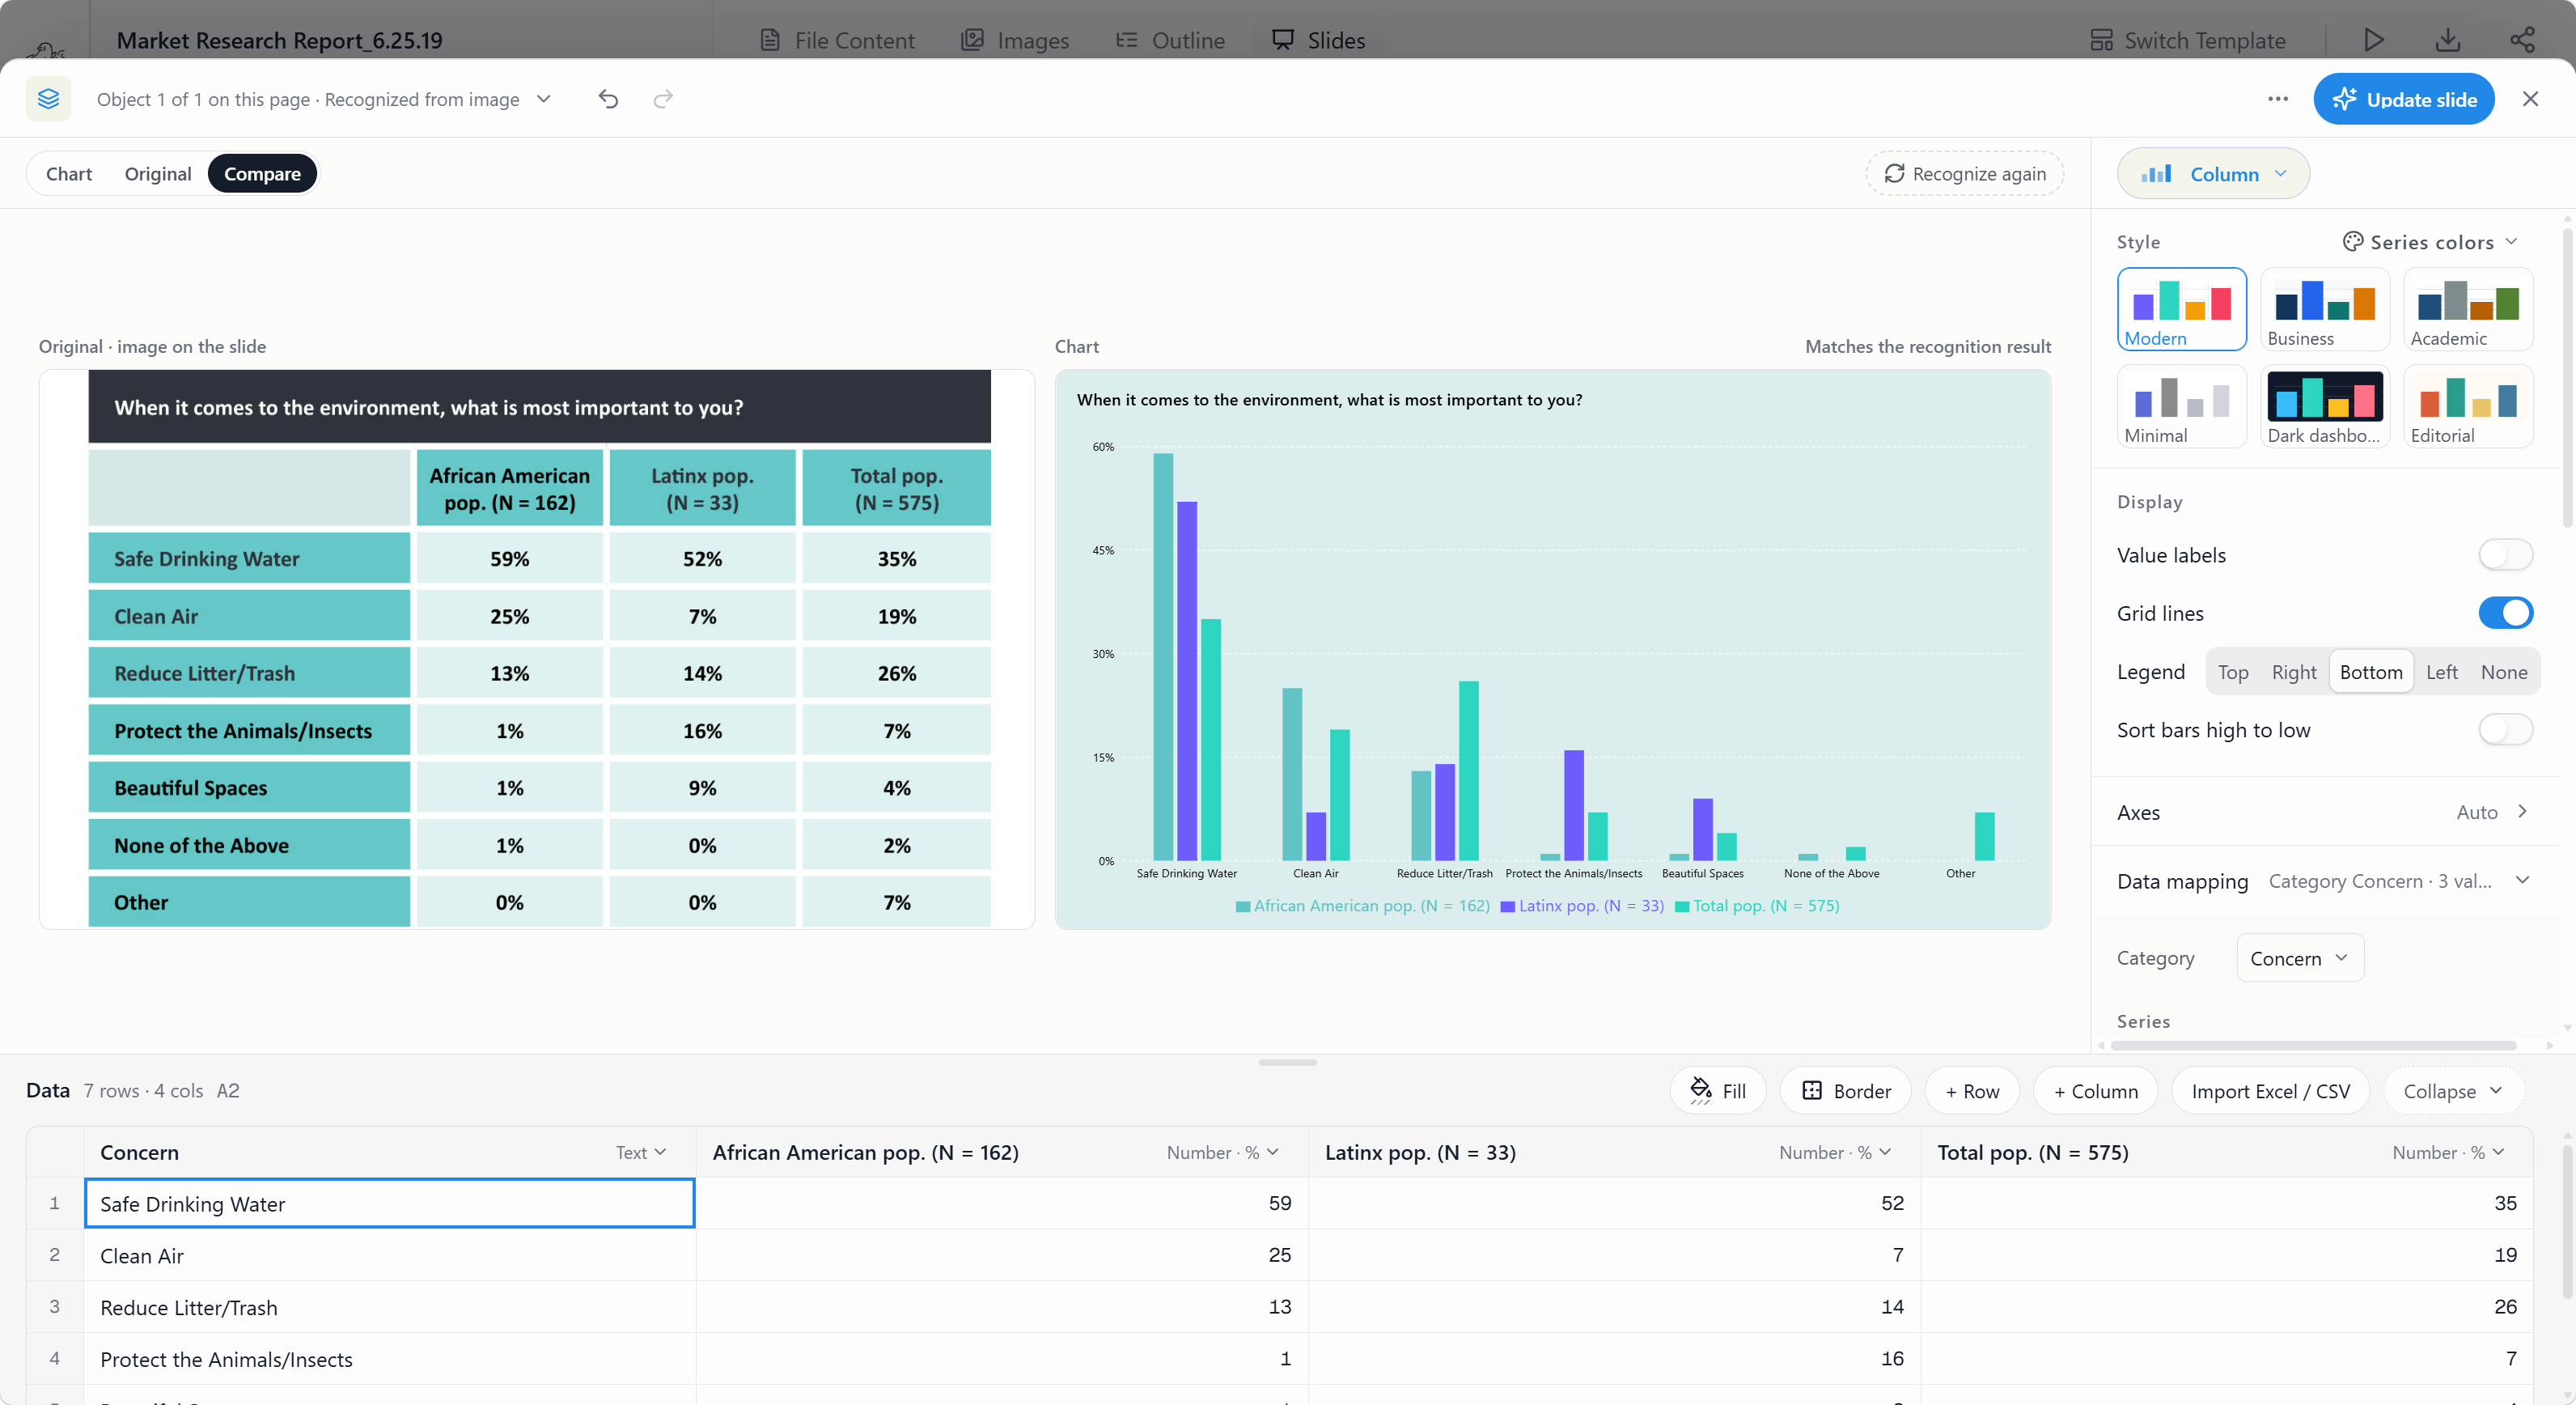
For PDCA, keep a simple data structure: metric, definition, baseline period, pilot period, control group, value, unit, source, owner, and status. Verify recognized values and formulas before updating the slide. Recalculate savings and rates in a spreadsheet. The presentation is the decision layer, not the calculation system.
Select layouts before or after slide rendering
Tosea AI separates outline review from rendering. At the outline stage, assign the appropriate visual to each message: Pareto for problem concentration, fishbone for causal hypotheses, 5W2H table for the pilot, line chart for trend comparison, waterfall for financial impact, and roadmap for rollout.
After rendering, you can still change a layout or diagram. If wording has already been approved, Layout Only refreshes the visual structure without intentionally rewriting the content. Compare the revised slide with the source before export.
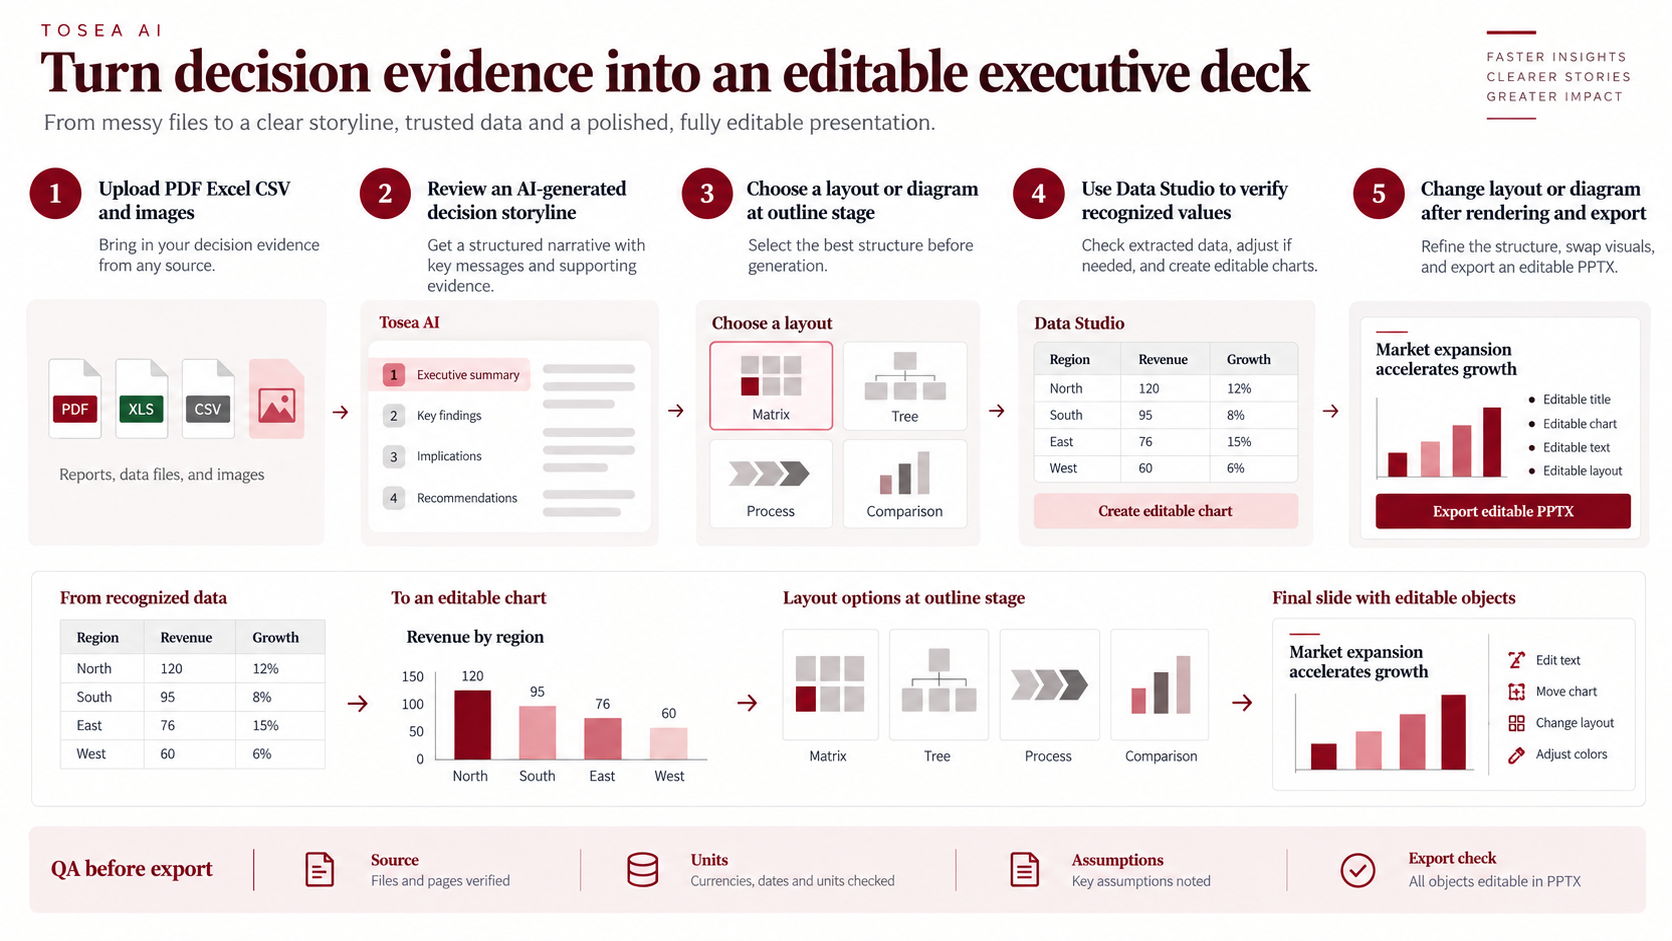
A practical workflow is:
- Upload reports, process documents, spreadsheets, or an existing deck exported as PDF.
- State the audience, decision, metric definitions, and evidence boundary.
- Review the outline and assign the correct visual relationship to each slide.
- Render the slides, then revise action titles and weak exhibits.
- Use Data Studio for editable charts and Layout Only for structural changes.
- Export an editable PPTX and check it in the delivery version of PowerPoint.
Pre-export quality checklist
- The title states the finding or decision.
- The problem has a measurable definition and baseline period.
- Root causes have evidence and are not simply workshop opinions.
- The pilot scope, owner, duration, and success threshold are visible.
- Results distinguish actuals, targets, assumptions, and estimates.
- Comparison periods use the same definition and denominator.
- Side effects and control metrics are reported.
- Chart totals reconcile: Pareto bars sum to the stated total, and waterfall steps add up to the end value.
- The Act decision says what to standardize, continue, revise, or stop.
- Unresolved issues enter the next cycle with an owner and date.
- The exported PPTX has been checked for fonts, labels, sources, and reading order.
Frequently asked questions
Can Tosea AI redesign my existing PowerPoint without changing the content?
Yes. Export the PowerPoint as a PDF, upload it to Tosea AI, and request a redesign that keeps the wording and sequence. Use Layout Only for visual restructuring without intentional rewriting. Confirm every label, footnote, chart value, and slide element before delivery.
How do I upload a PowerPoint and ask Tosea AI to redesign each slide?
Export the file as a PDF, upload it, and state that each slide should be redesigned while preserving its content and order. Choose a template or describe the visual direction, inspect the generated pages, and export the revised presentation as an editable PPTX.
Can I upload my own PowerPoint template to Tosea AI?
Tosea AI supports custom templates on eligible paid plans. Configure the template through the available workflow, then verify the required layouts, fonts, colors, logo placement, and master-slide rules before sharing the deck.
Can Tosea AI use custom brand colors, fonts, and a logo?
Yes. Specify brand colors and fonts in the instructions, and upload the logo or use a custom template where supported. These features are available on eligible plans. After export, check font availability, color values, logo clear space, and contrast.
Can Tosea AI match the style of my old company presentations?
Tosea AI can use a representative company deck as design guidance, but that should not imply permanent model training. For stronger consistency, use an approved custom template containing the company layouts, colors, fonts, and logo. Check the result against the brand guidelines.
Does Tosea AI preserve PowerPoint formatting after export?
Tosea AI editable PPTX export is designed to stay close to the generated preview while keeping elements editable. Results can vary with fonts, complex graphics, and the application used to open the file. Test the deck in the exact environment used for delivery.
Can I tell AI to edit the layout only and keep the exact wording?
Yes. Layout Only changes the visual arrangement without intentionally rewriting the content. It is useful after wording has been approved. Compare the revised slide with the source and confirm labels, citations, footnotes, numbers, and line breaks.
Build the next improvement cycle with Tosea AI
A professional PDCA cycle PowerPoint makes the learning visible. It shows the baseline, tested change, result, decision, and next cycle without pretending that every intervention worked.
Tosea AI helps move source documents and data into a reviewable outline, editable charts, controlled layouts, and an editable PPTX. The analyst still owns the hypothesis, calculation, evidence, and decision.
For related guidance, read the Bain-Style SPACE Matrix Guide and the Bain-Style Consulting PowerPoint with 18 Frameworks for more consulting slide patterns.
Use PDCA for a small, measurable change. Study what happened, scale only what the evidence supports, and put the unresolved work into the next cycle.
Sources
- PDCA Cycle: Plan-Do-Check-Act — American Society for Quality
- The PDSA Cycle — The W. Edwards Deming Institute
- A3 Report — Lean Enterprise Institute
- Model for Improvement — Institute for Healthcare Improvement