How to Build a Bain-Style SCP Analysis PowerPoint with AI: Complete Guide
Build a Bain-style SCP analysis PowerPoint with AI: the Structure-Conduct-Performance framework, CR4 and HHI math, four slide examples with prompts, and a checklist.
A Bain-style SCP analysis PowerPoint should explain how an external shock changes market structure, how firms respond, and what those choices mean for performance. Tosea AI helps analysts turn research, spreadsheets, PDFs, and existing slides into a structured argument, editable charts, controlled layouts, and an editable PPTX. This guide shows how to use the Structure-Conduct-Performance framework without reducing it to three decorative boxes. It covers the framework, how it compares with Five Forces and PESTEL, a worked concentration calculation, a deck-level storyline, and four slide examples with reusable prompts.
The slide examples below are original editorial references built with fictional data. They are not Bain & Company templates, and Tosea AI is not affiliated with or endorsed by Bain & Company.
Quick answer: Define the market first. Measure structure with evidence such as concentration, entry barriers, differentiation, and switching costs. Document observable conduct in pricing, investment, capacity, channels, or integration. Then test how those choices relate to margins, share, efficiency, innovation, or customer outcomes. State the decision and the evidence boundary on every slide.
What is the SCP analysis framework?
SCP stands for Structure, Conduct, and Performance. The framework links the conditions of an industry to the choices firms make and the results that follow.
| Layer | Questions to answer | Useful evidence |
|---|---|---|
| External shock | What changed outside the industry? | Regulation, technology, input costs, demand, culture, macroeconomics |
| Structure | How is competition organized? | Market definition, shares, concentration, entry barriers, differentiation, switching costs |
| Conduct | How are firms responding? | Price, capacity, product, advertising, R&D, channels, partnerships, integration |
| Performance | What outcomes changed? | Profitability, efficiency, market share, quality, innovation, customer welfare |
The intellectual history is often compressed too aggressively. Harvard economist Edward S. Mason established much of the empirical industry-analysis tradition in the 1930s. Joe S. Bain developed the cross-industry SCP approach in the 1950s, especially through his work on concentration and barriers to entry. F. M. Scherer later extended the industrial-organization framework. A ScienceDirect reference overview summarizes the conventional causal sequence as structure influencing conduct, which then affects performance. Despite the shared surname, the economist Joe S. Bain has no connection to Bain & Company, the consulting firm founded by Bill Bain in 1973. "Bain-style" in this guide refers only to a restrained, conclusion-led slide convention.
That sequence is a starting hypothesis, not automatic proof. Conduct can reshape structure through acquisition, innovation, capacity investment, or exclusionary tactics. Strong performance can attract entry. Market concentration can reflect scale economies rather than weak competition. The OECD guide to competition measurement warns that competition indicators have conceptual and practical limits. A credible SCP deck therefore separates measurement, inference, and recommendation.
SCP, Five Forces, and PESTEL: which frame fits the slide?
SCP is often confused with two other industry frameworks. They answer different questions, so the choice should follow the decision the deck supports.
| Framework | Core question | Strongest evidence | Use it when | Typical slide output |
|---|---|---|---|---|
| SCP | How did a change in market conditions alter firm behavior and results? | Shares, concentration, entry data, observed pricing and investment moves, margins | A specific shock needs to be traced to outcomes | Shock-to-performance chain with a conditional recommendation |
| Five Forces | How attractive is the industry, and where does profit pressure come from? | Buyer and supplier power, substitutes, entry threat, rivalry intensity | Assessing industry profitability or entry attractiveness | Force-by-force rating with implications for margin |
| PESTEL | Which external trends could affect the business? | Political, economic, social, technological, environmental, and legal signals | Scanning the environment before a strategy refresh | Trend inventory ranked by impact and likelihood |
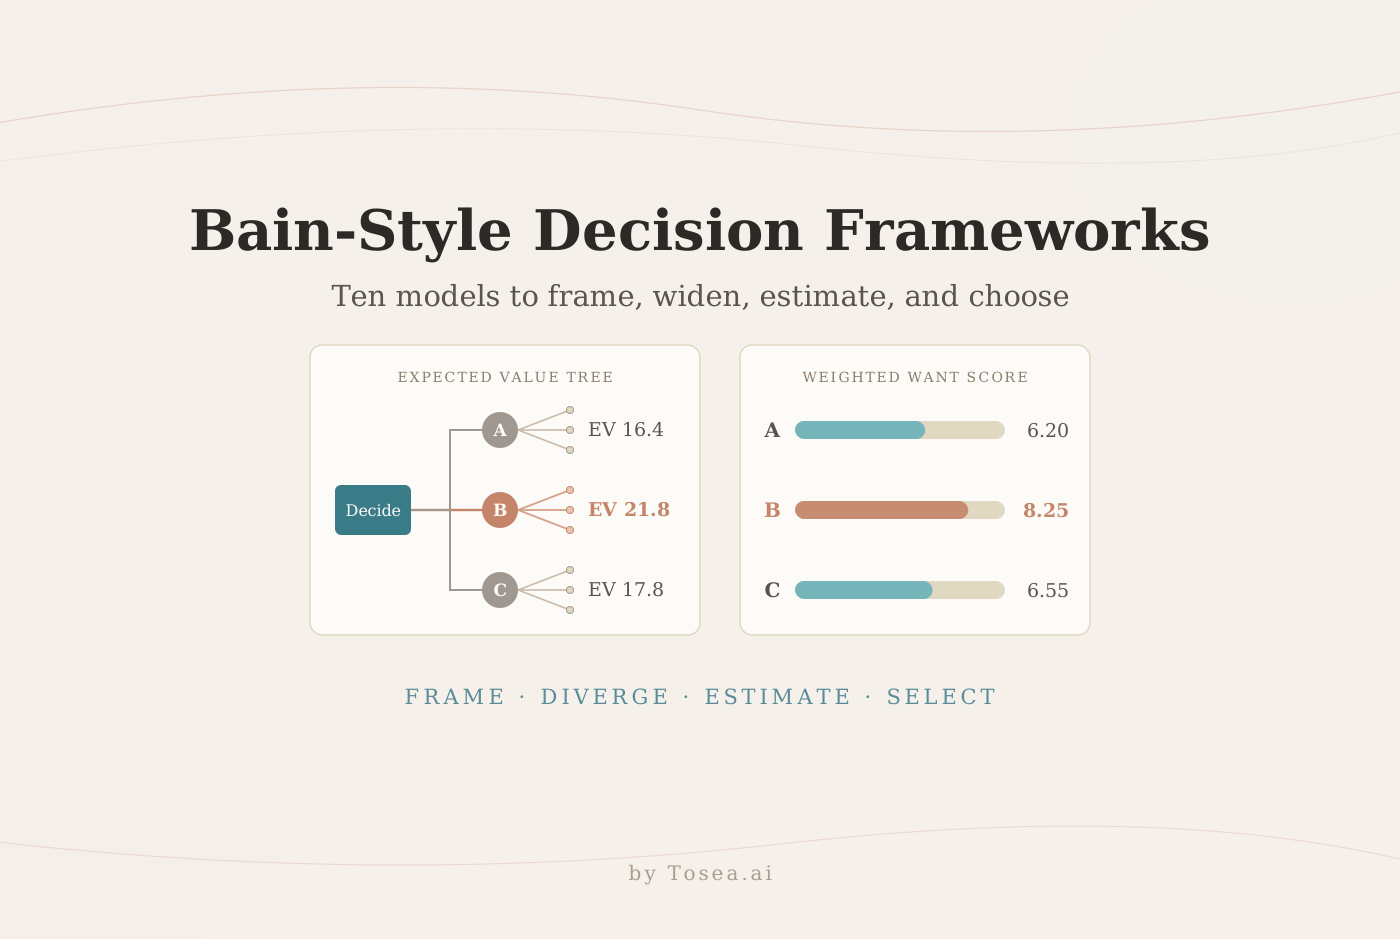
The three frameworks combine well. PESTEL can surface the external shock, Five Forces can describe where profit pressure sits, and SCP can trace one shock through structure and conduct to measurable performance. Use SCP as the backbone when the audience needs to know what changed, who reacted, and whether the reaction worked. For a broader menu of consulting frames, see our guide to Bain-style decision-making frameworks and the McKinsey-style 3C strategy deck.
How to build an SCP analysis PowerPoint
Step 1: define the market before measuring it
Write down the product scope, customer segment, geography, channel, and period. A concentration ratio is meaningless when the market boundary changes from one slide to the next. Explain whether substitutes are included and why.
Step 2: establish the external shock
Name the event that makes the analysis timely. It may be a regulation, platform shift, supplier disruption, change in consumer behavior, or new technology. State the date, affected participants, and expected transmission mechanism.
Step 3: measure structure
Use more than market share. Consider the number and relative size of competitors, entry and exit conditions, scale economies, product differentiation, vertical relationships, buyer power, and switching costs. Concentration metrics such as CR4 or the Herfindahl-Hirschman Index can help, but they do not replace market evidence.
Step 4: document conduct rather than guessing intent
Track observable moves: price changes, discount rules, capacity additions, product launches, R&D, advertising, bundling, partnerships, acquisitions, or channel changes. Separate announced plans from executed actions.
Step 5: connect conduct to performance
Choose metrics that fit the question. Company performance may include growth, margin, share, return on invested capital, cost, or service levels. Market performance may include price, choice, innovation, quality, entry, or customer welfare. Show the baseline, period, source, and limitations.
Step 6: write the decision and its trigger
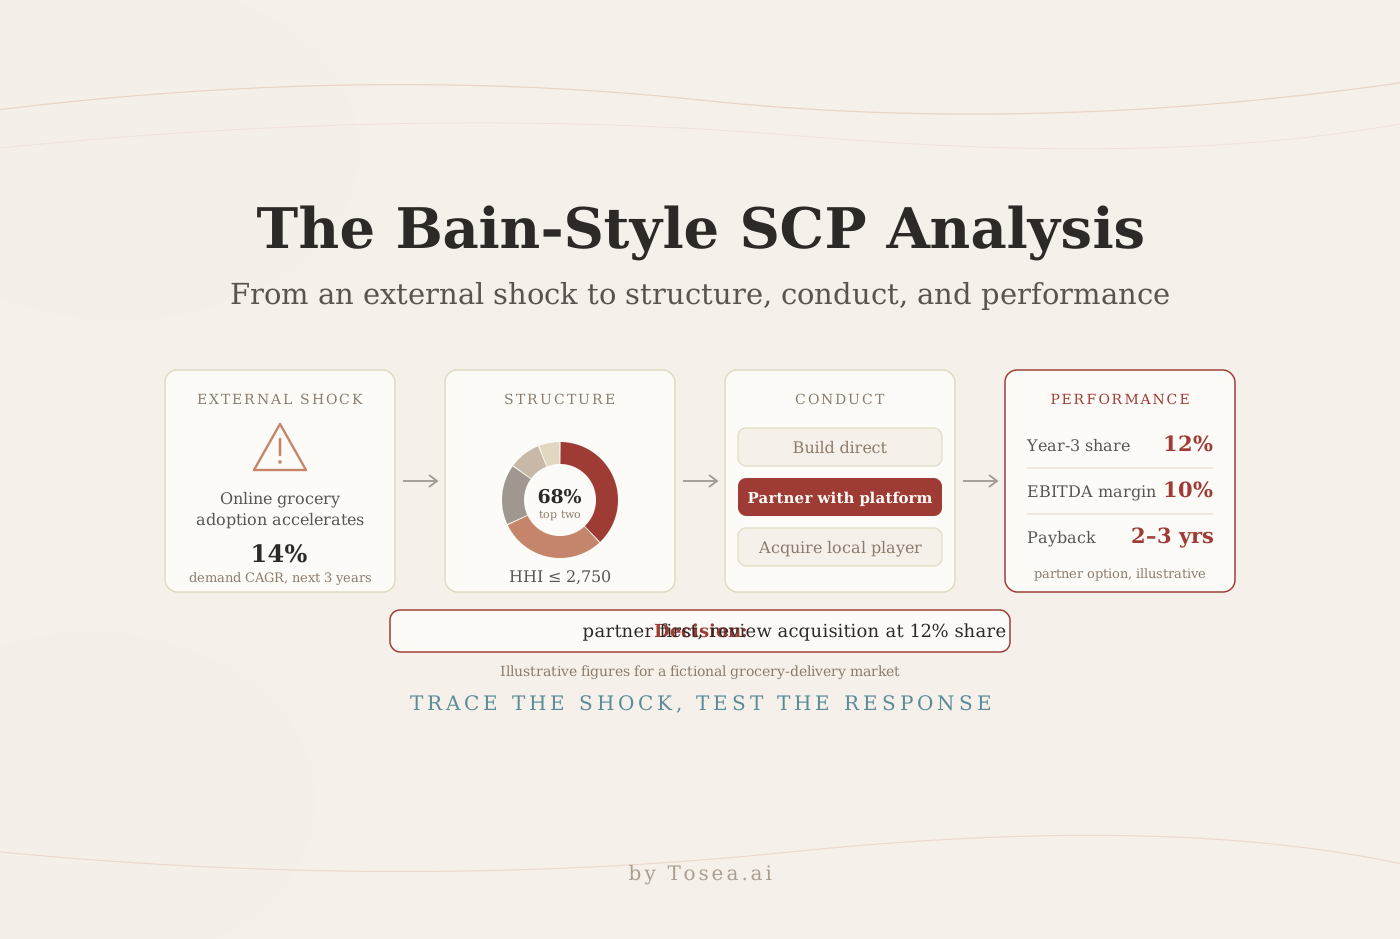
End each analytical slide with what management should do and the condition that would change the answer. "Partner first; review acquisition at 12% share" is a decision. "Monitor the market" is not, unless it names an owner, a metric, and a threshold.
How to measure concentration: a worked CR4 and HHI example
Concentration is the most quoted structure metric and the most frequently miscalculated. Two measures cover most slides:
- CR4 (four-firm concentration ratio): the sum of the four largest market shares.
- HHI (Herfindahl-Hirschman Index): the sum of the squared market shares of every firm, from near zero to 10,000 for a monopoly.
Take the fictional grocery-delivery market used in Use case 1 below:
| Competitor | Demand share | Share squared |
|---|---|---|
| Platform A | 38% | 1,444 |
| Platform B | 30% | 900 |
| Regional player 1 | 17% | 289 |
| Regional player 2 | 9% | 81 |
| Others (combined) | 6% | 36 |
| Total | 100% | 2,750 |
CR2 is 68% and CR4 is 94%. The HHI is at most 2,750. It is an upper bound because "Others" is treated as a single firm; if that 6% is spread across many small players, the true figure is closer to 2,714. The U.S. Department of Justice generally treats markets between 1,000 and 1,800 as moderately concentrated and those above 1,800 as highly concentrated, so this market is highly concentrated under either reading.
Three rules keep the number honest on a slide. First, state the share basis (revenue, volume, or orders), because the ranking can change between them. Second, keep the market definition fixed across every chart in the deck. Third, treat agency thresholds as a reference point for merger review, not a verdict on how competitive a market feels to customers. A concentrated market with low switching costs can still be fiercely contested.
How to structure an SCP storyline across a deck
A single SCP slide works for a steering committee update. A full industry review usually needs a sequence in which each page answers one question:
- Executive summary: the recommendation, the condition attached to it, and the two or three facts that support it.
- Market definition: product, customer, geography, channel, and period, with what is excluded.
- External shock: a dated timeline of the event and the expected transmission path.
- Structure: shares, concentration, entry barriers, and switching costs, before and after the shock if data allows.
- Conduct: observed moves by major competitors, separating executed actions from announcements.
- Performance: margins, share, service, or customer outcomes against a baseline.
- Options and scenarios: two or three strategic responses tested under base and stress cases.
- Decision, risks, and triggers: owners, thresholds, review dates, and what would change the answer.
Put calculation detail, source tables, and sensitivity cases in an appendix. The BCG-style storyline guide explains how to write the action titles that carry this sequence.
Use case 1: evaluate market entry
SCP is useful when an attractive growth rate hides a difficult route to market. A concentrated distribution layer may make direct entry expensive even when end demand is expanding. The slide should compare entry modes, not merely describe industry growth.
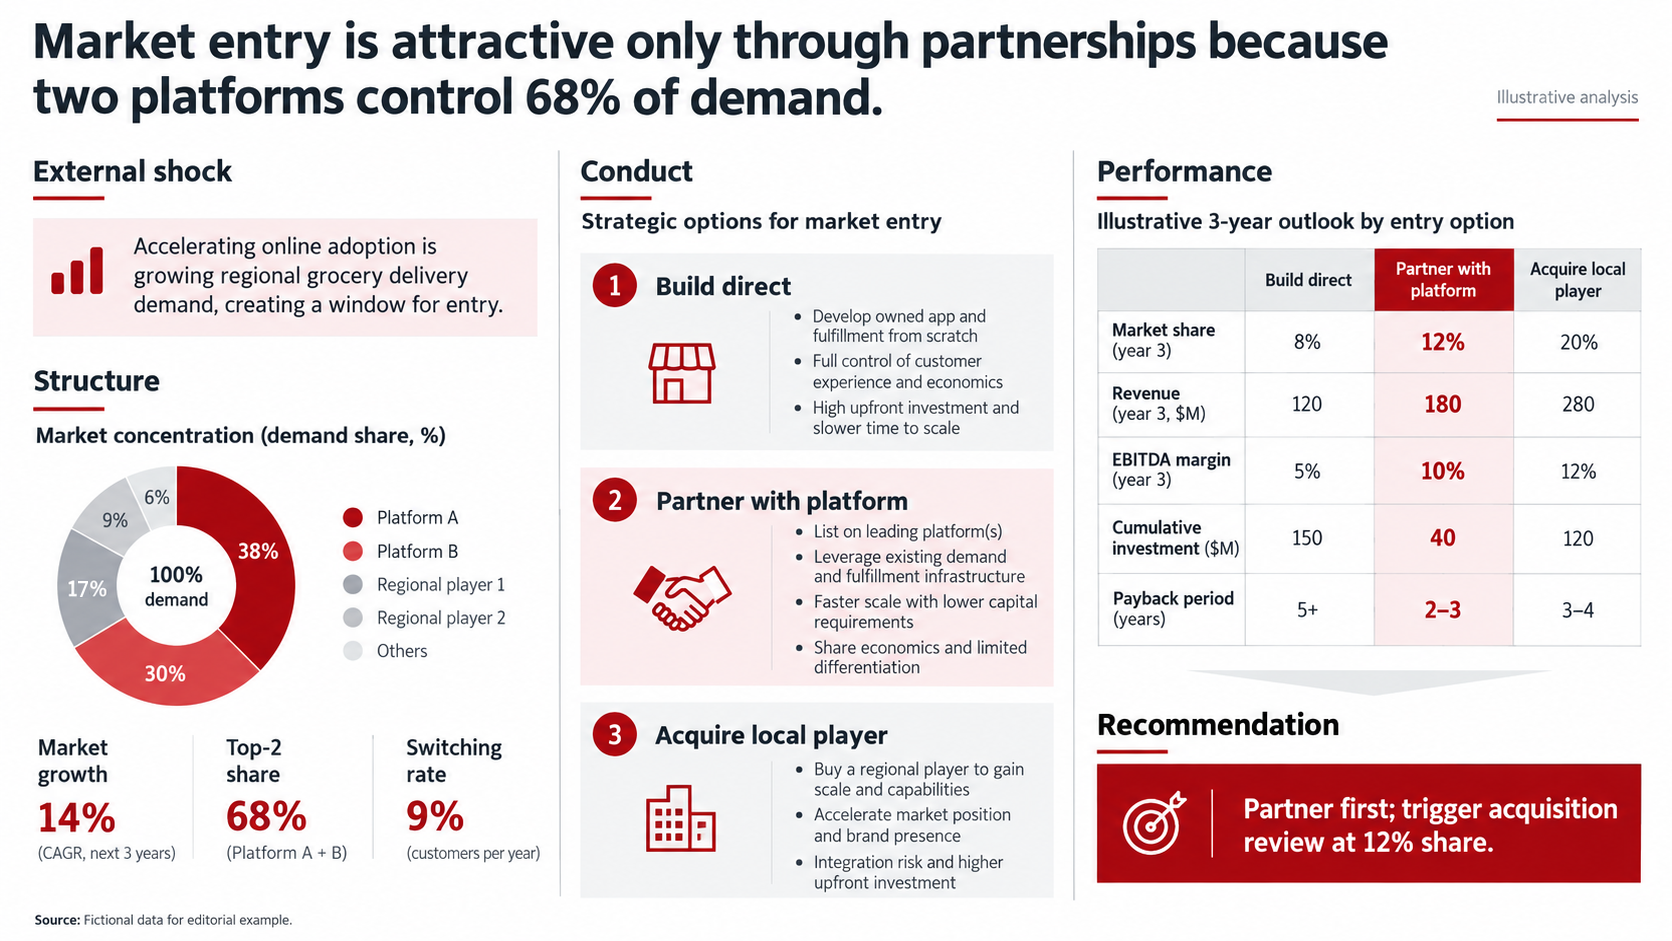
Illustrative example with fictional grocery-delivery data. The recommendation is conditional on share and capital thresholds.
Reusable AI prompt
Create one 16:9 executive SCP market-entry slide. Define the market as [product, customer, geography, channel, period]. Use only verified inputs from [sources]. Show the external shock, market structure, conduct options, and 3-year performance scenarios. Include concentration, growth, switching, investment, share, margin, and payback where available. End with a conditional recommendation and trigger. Label assumptions and illustrative values. Do not invent data.
Use case 2: redesign pricing conduct
Pricing is conduct, but the right move depends on structure. A fragmented market with easy switching calls for a different response than a concentrated market with high integration costs. Segment-level evidence is usually more useful than one average list-price comparison.
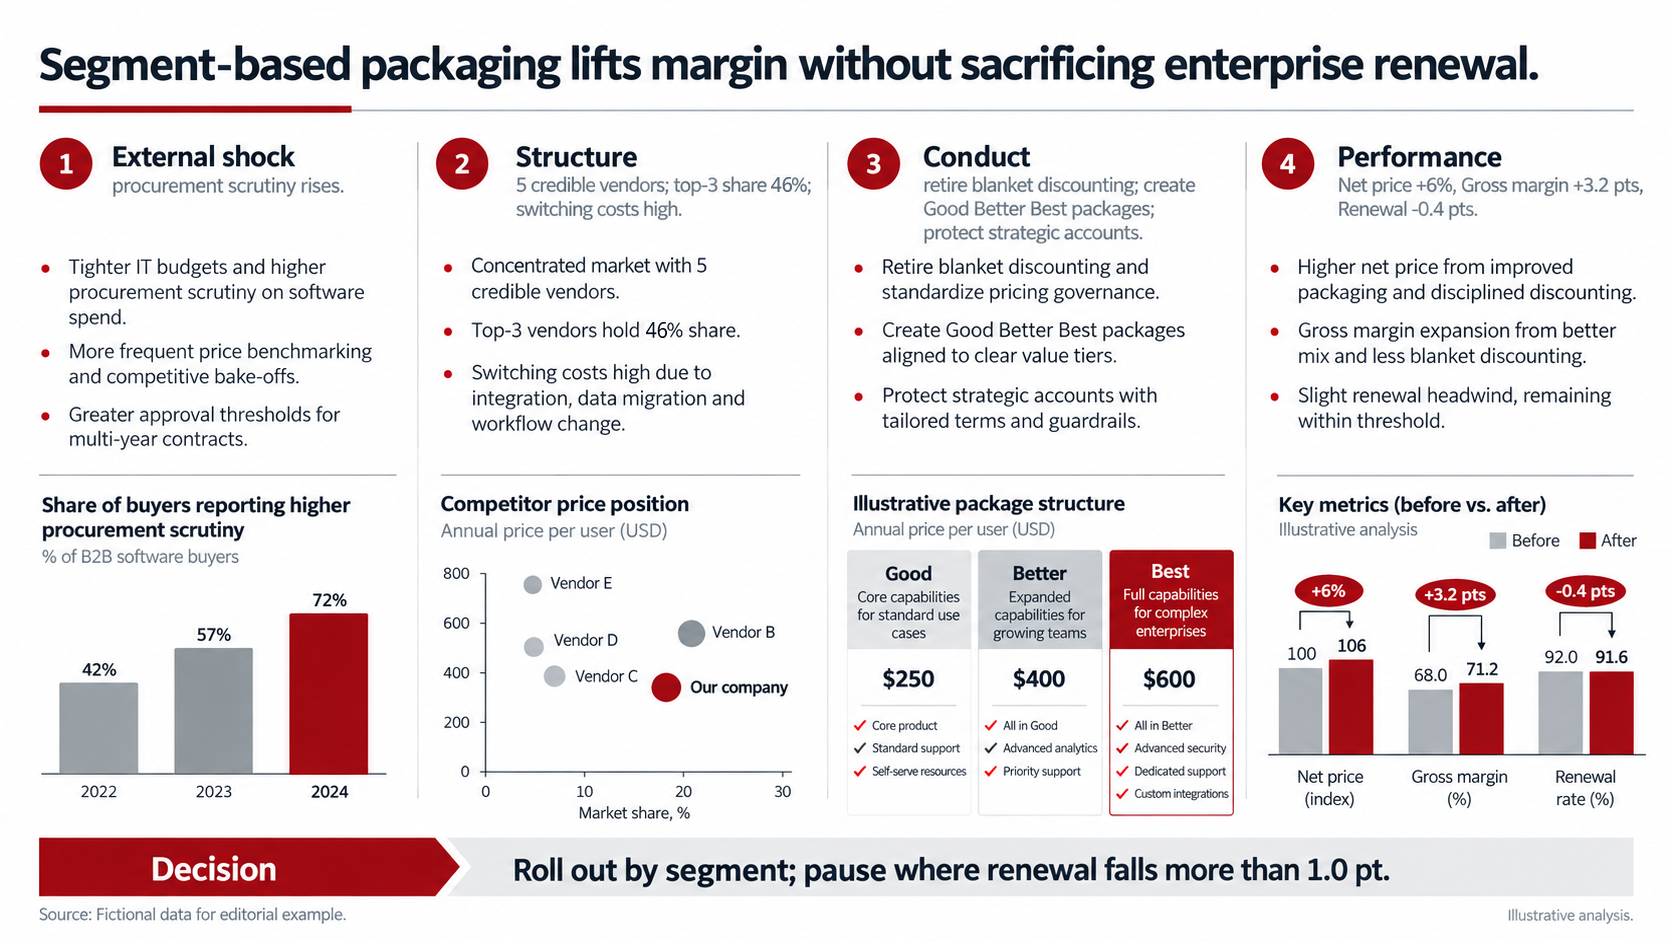
Illustrative example: package design raises net price while an explicit renewal threshold limits downside.
Reusable AI prompt
Build one 16:9 SCP pricing slide for [industry]. Use verified competitor prices, shares, switching evidence, customer segments, discounts, renewals, and margins. Show the external shock, structure, current conduct, proposed pricing conduct, and before-versus-after performance. Separate list price from realized net price. Add a rollout rule and a pause threshold. Preserve units, dates, and sources. Do not infer willingness to pay without evidence.
Use case 3: choose between dual sourcing and vertical integration
A supplier shock can expose concentration risk upstream. SCP helps the team connect qualified capacity and entry barriers to sourcing conduct, then compare cost, lead time, service, and capital. The recommendation should change when disruption duration or demand assumptions change.
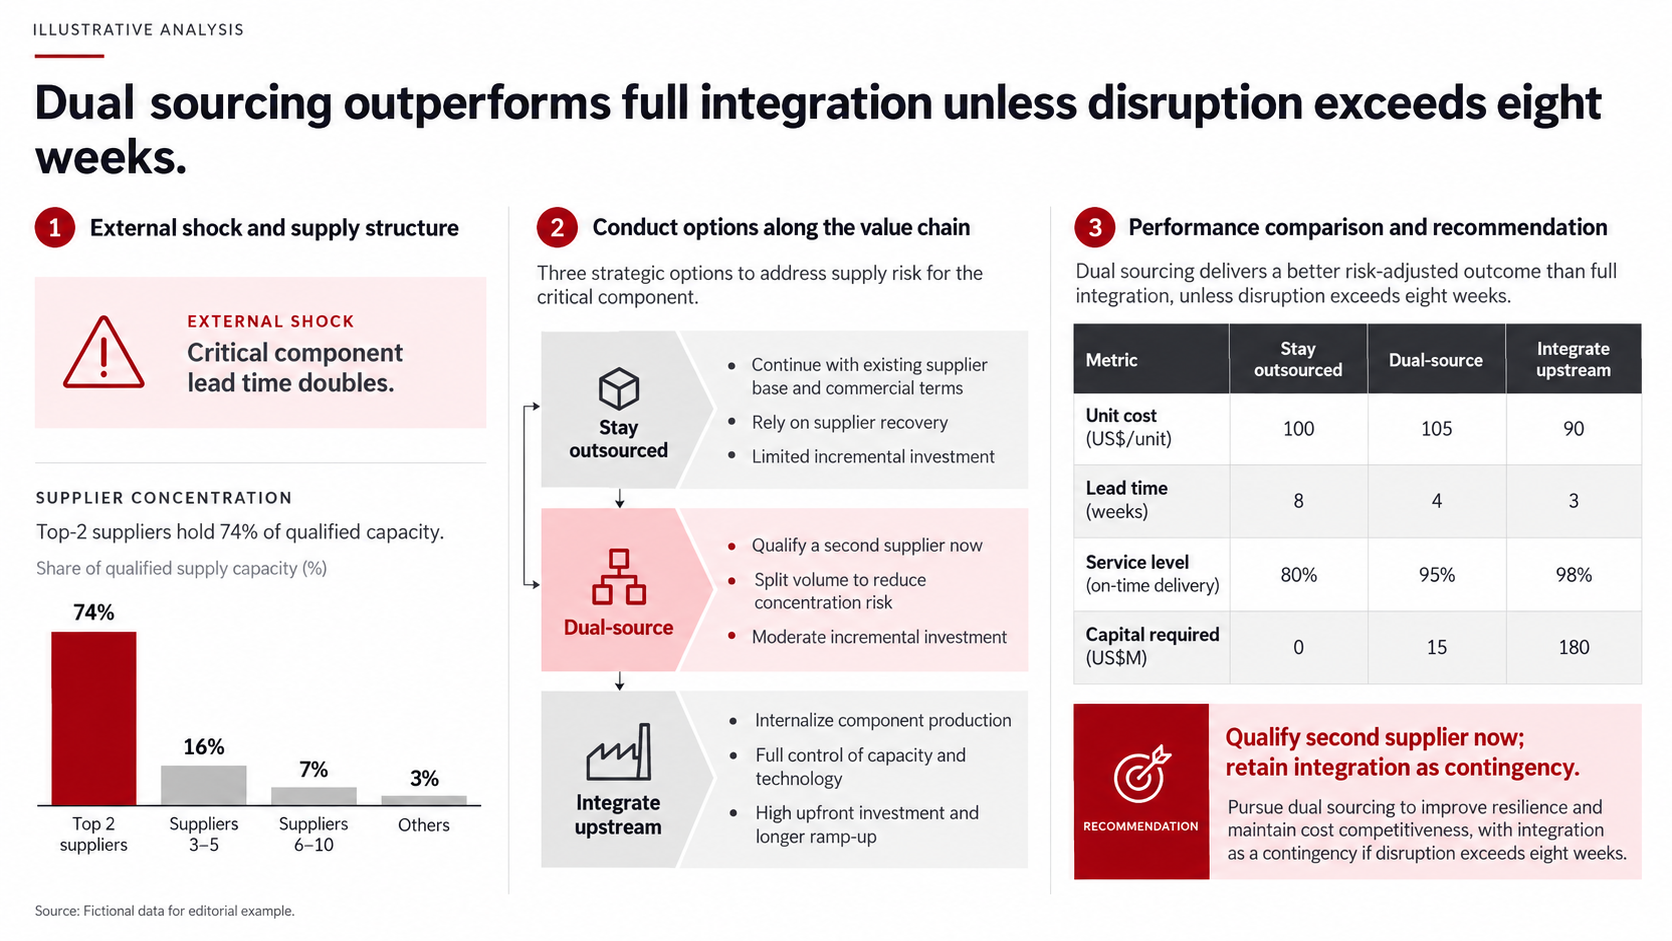
Illustrative example: dual sourcing wins under the base case, while integration remains a contingency.
Reusable AI prompt
Create one 16:9 SCP supply-risk slide. Use these verified inputs: [supplier shares, qualified capacity, lead time, unit cost, service, capital, disruption scenarios]. Show the external shock and supply structure, then compare Stay outsourced, Dual-source, and Integrate upstream. Calculate performance under at least two disruption scenarios. State the break point at which the recommendation changes. Do not fabricate supplier capacity or savings.
Use case 4: respond to regulation or technology disruption
Regulation can change switching costs, transparency, access, or permitted conduct. A useful slide traces that transmission path and distinguishes industry-wide effects from company-specific actions. It also shows whether performance gains come from price, volume, service, or mix.
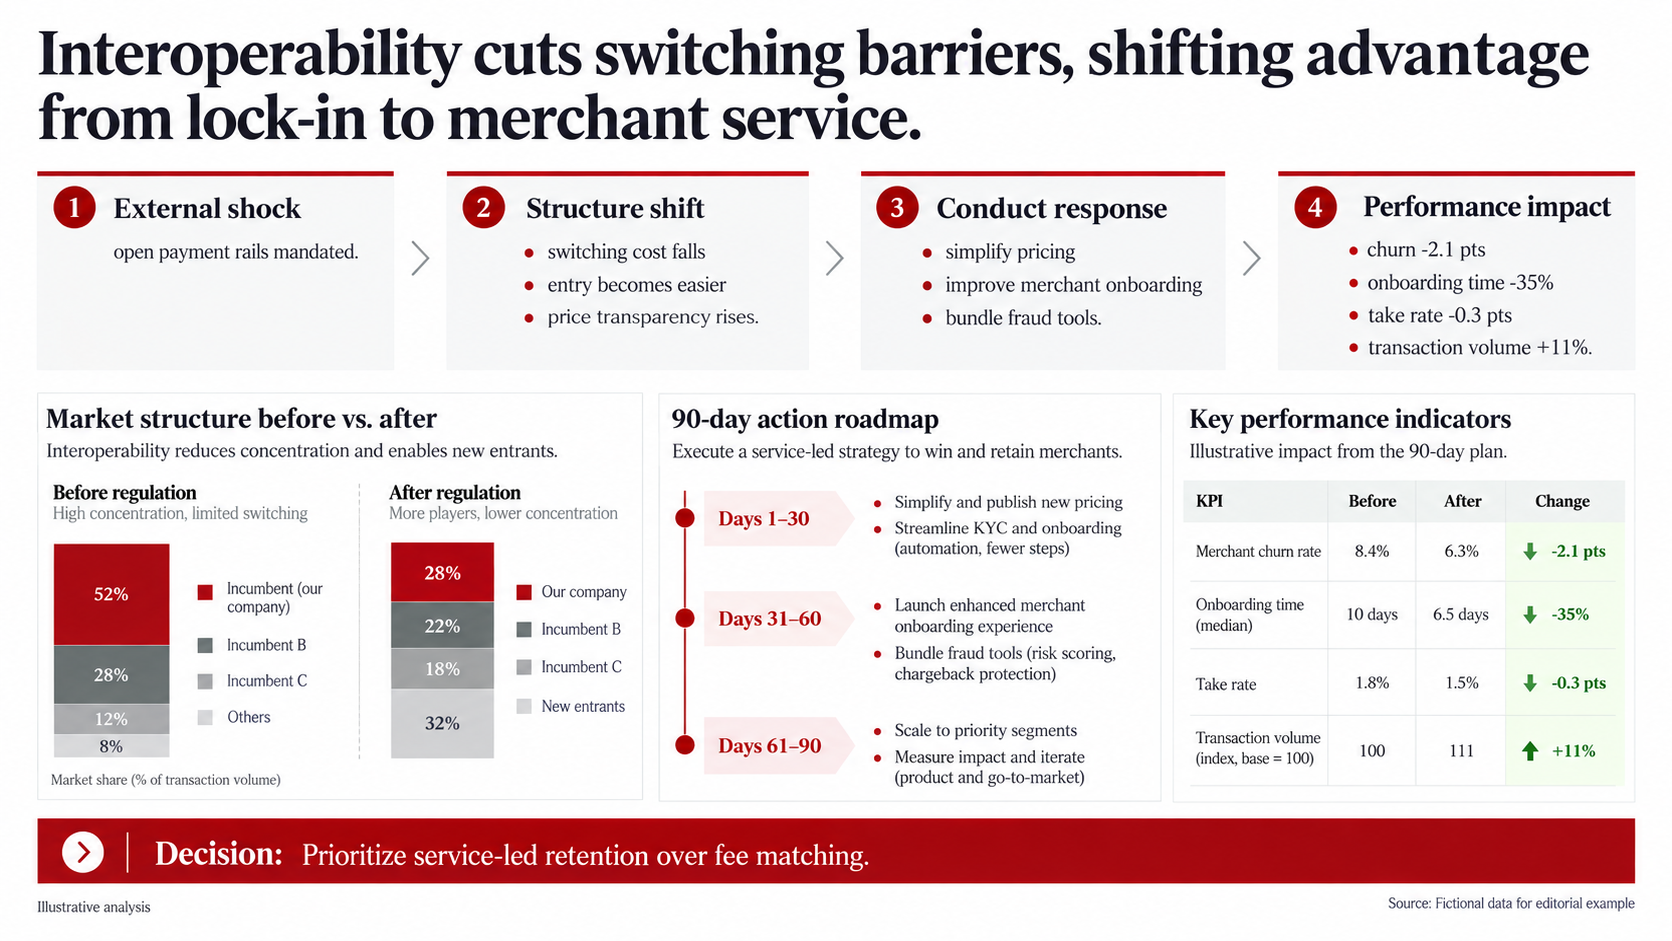
Illustrative example: lower switching barriers move the basis of competition toward merchant service.
Reusable AI prompt
Create one 16:9 SCP regulatory-response slide for [industry and rule]. State the effective date and affected market boundary. Map the chain from external shock to structure shift, conduct response, and performance. Compare market structure before and after, add a 90-day action plan, and track four decision-relevant KPIs. Distinguish regulation text, management assumptions, and modeled effects. Do not claim causality beyond the evidence.
Common SCP slide mistakes
- Three boxes, no chain. Structure, conduct, and performance appear side by side with no arrow of evidence between them. Each layer should cite the fact that links it to the next.
- A moving market boundary. The share chart uses national data while the pricing chart uses one region. Fix the definition once and footnote it everywhere.
- Concentration as a verdict. A high HHI is reported as proof of weak competition, without checking entry, switching costs, or buyer power.
- Intent instead of conduct. "Competitors want to lock in customers" is a guess. "Two competitors introduced three-year contracts in Q2" is conduct.
- Correlation presented as causation. Margins rose after the shock, but so did demand. Show the mechanism or label the link as a hypothesis.
- Unconditional recommendations. The deck says "integrate upstream" without the disruption length or demand level at which that choice stops paying off.
Turn source evidence into editable charts with Tosea AI Data Studio
SCP work often starts with market-share tables, competitor price lists, customer research, and charts embedded in PDF reports. Tosea AI Data Studio can import Excel and CSV files, recognize data from charts and tables, and rebuild the result as an editable presentation chart.
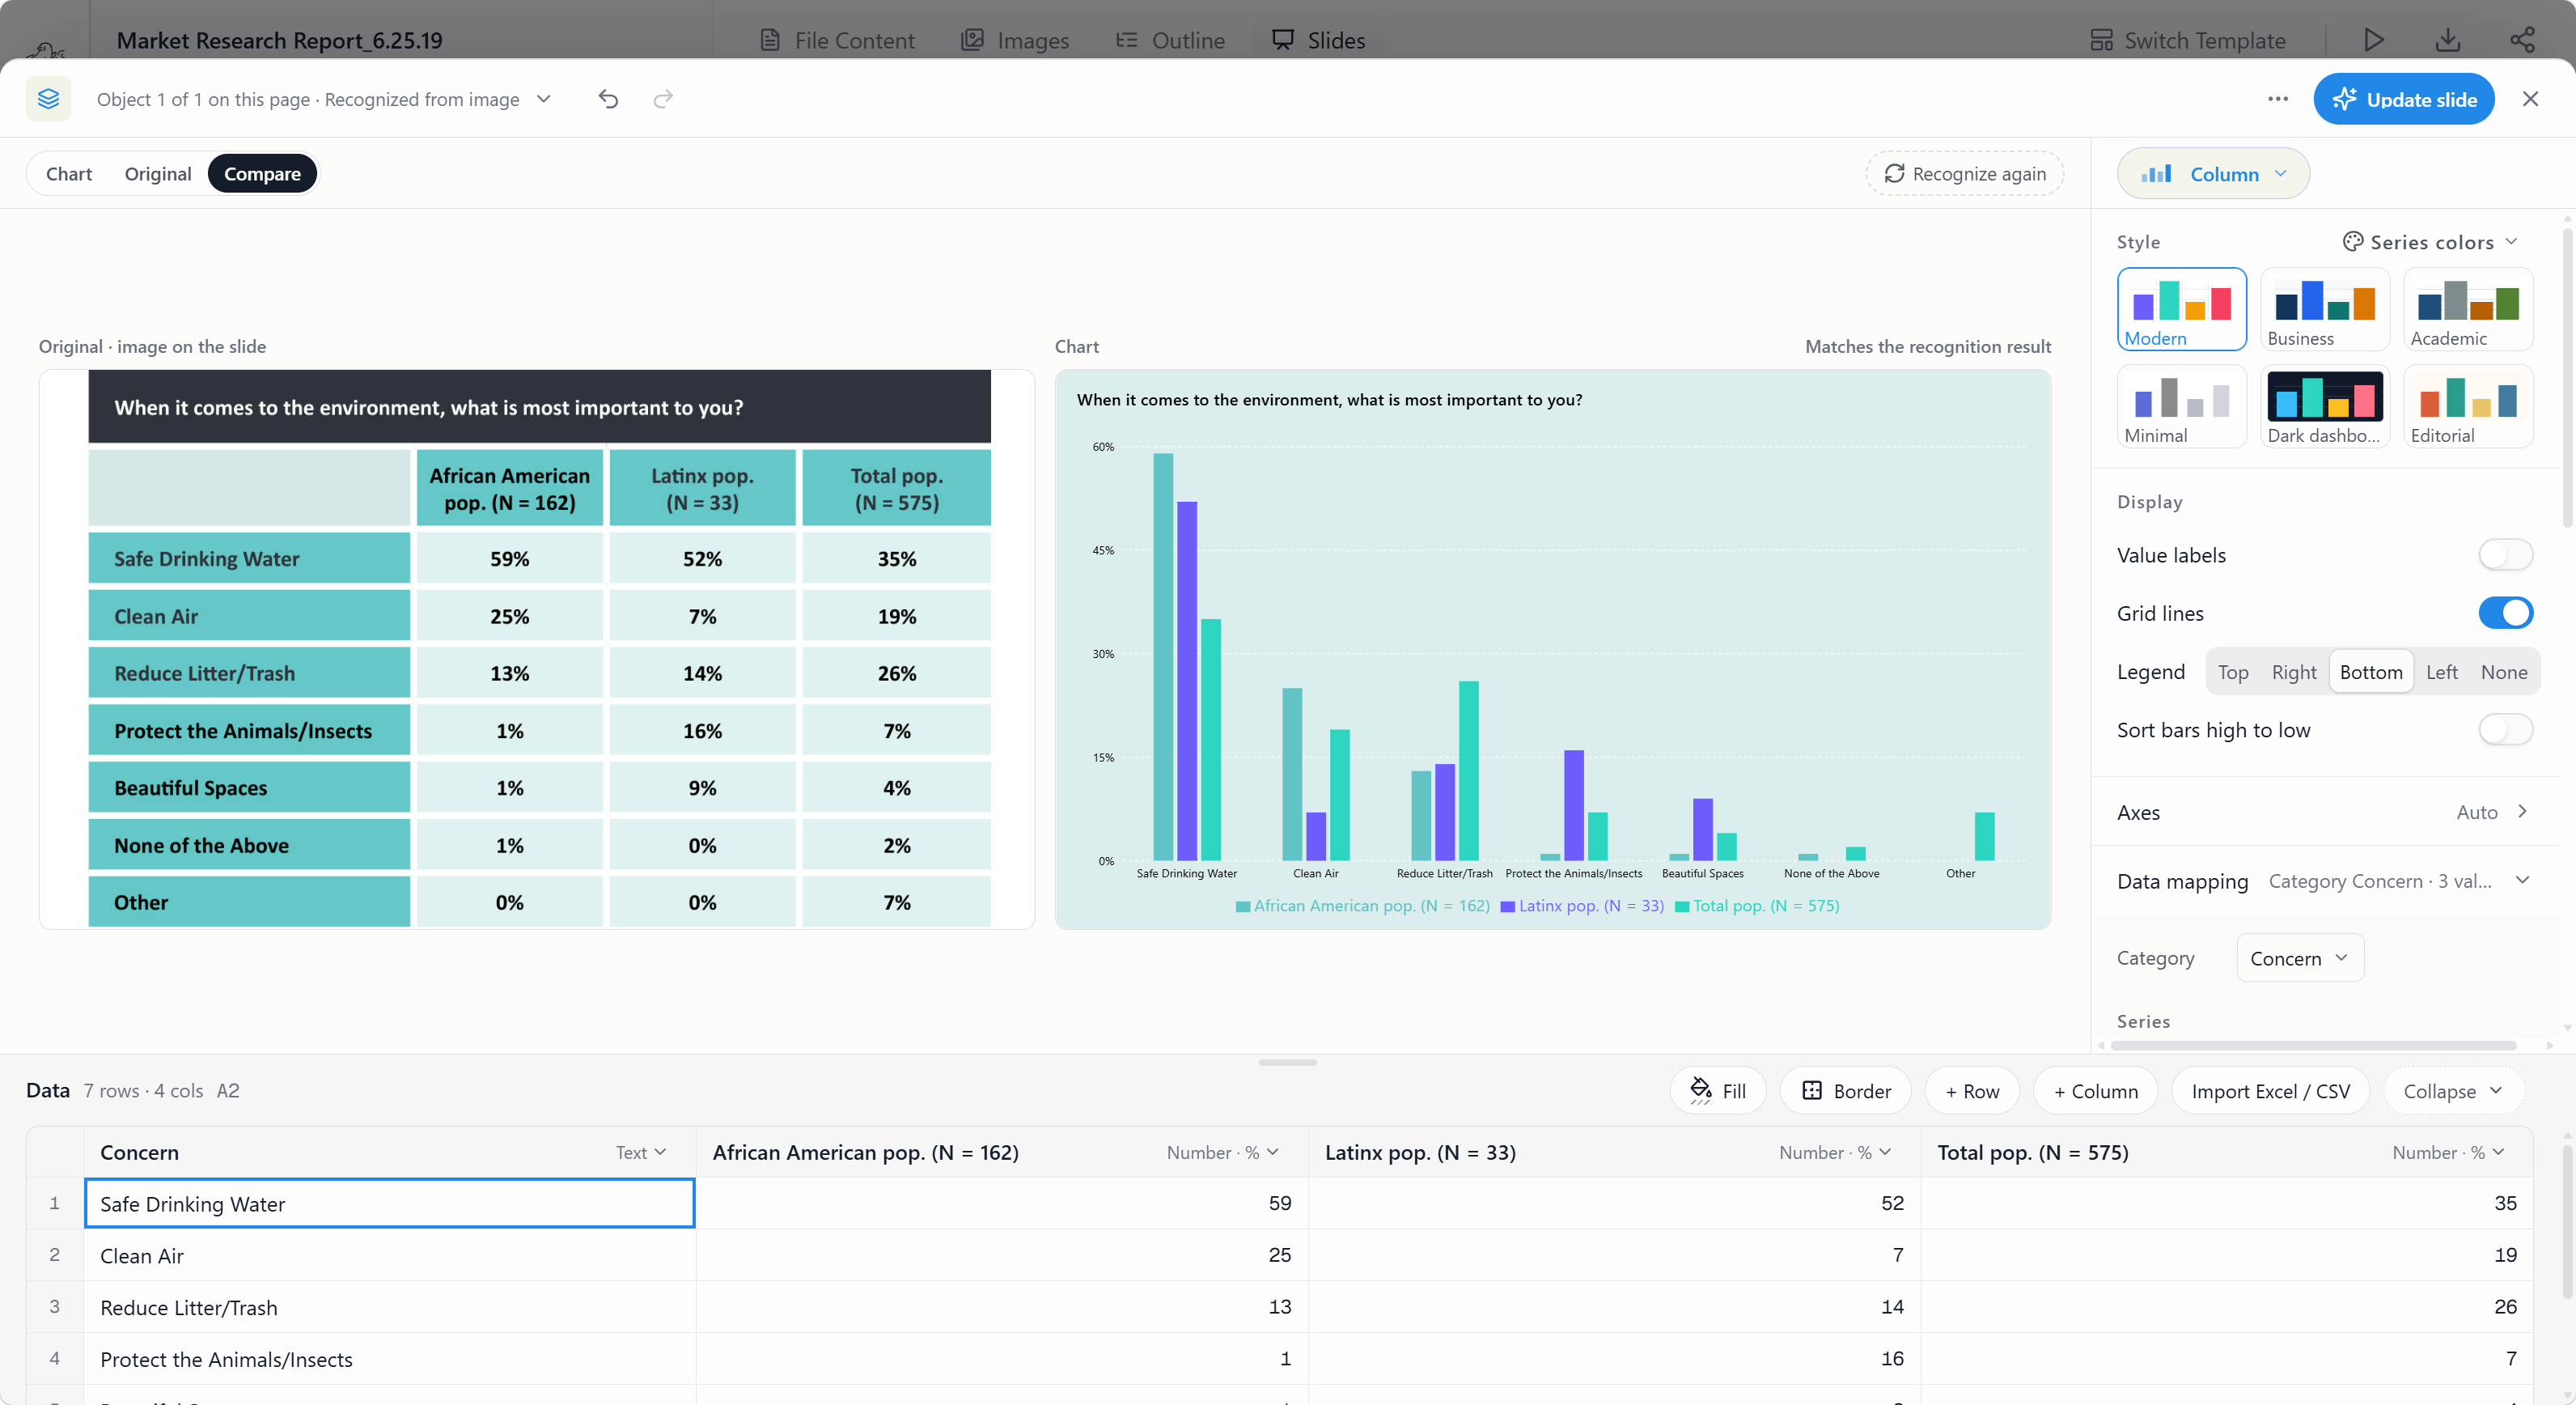
Keep a review table with metric name, definition, market scope, period, unit, value, source, and confidence. Verify recognized values before updating a slide. Recalculate concentration, growth, margins, and scenarios in a spreadsheet. The deck communicates the analysis; it should not become the only calculation record. Our AI think-cell alternative guide covers chart recognition and editing in more detail.
Choose layouts before or after rendering
At the outline stage, assign a visual based on the analytical relationship: a concentration chart for structure, a timeline for shocks, a value chain for vertical conduct, a price waterfall for monetization, or a scorecard for performance. This prevents a visually polished but logically empty deck.
After rendering, Tosea AI still lets you change the layout or diagram. When wording is approved, Layout Only can refresh visual structure without intentionally rewriting the content. Export the result as an editable PPTX and test it in the same PowerPoint environment used for delivery.
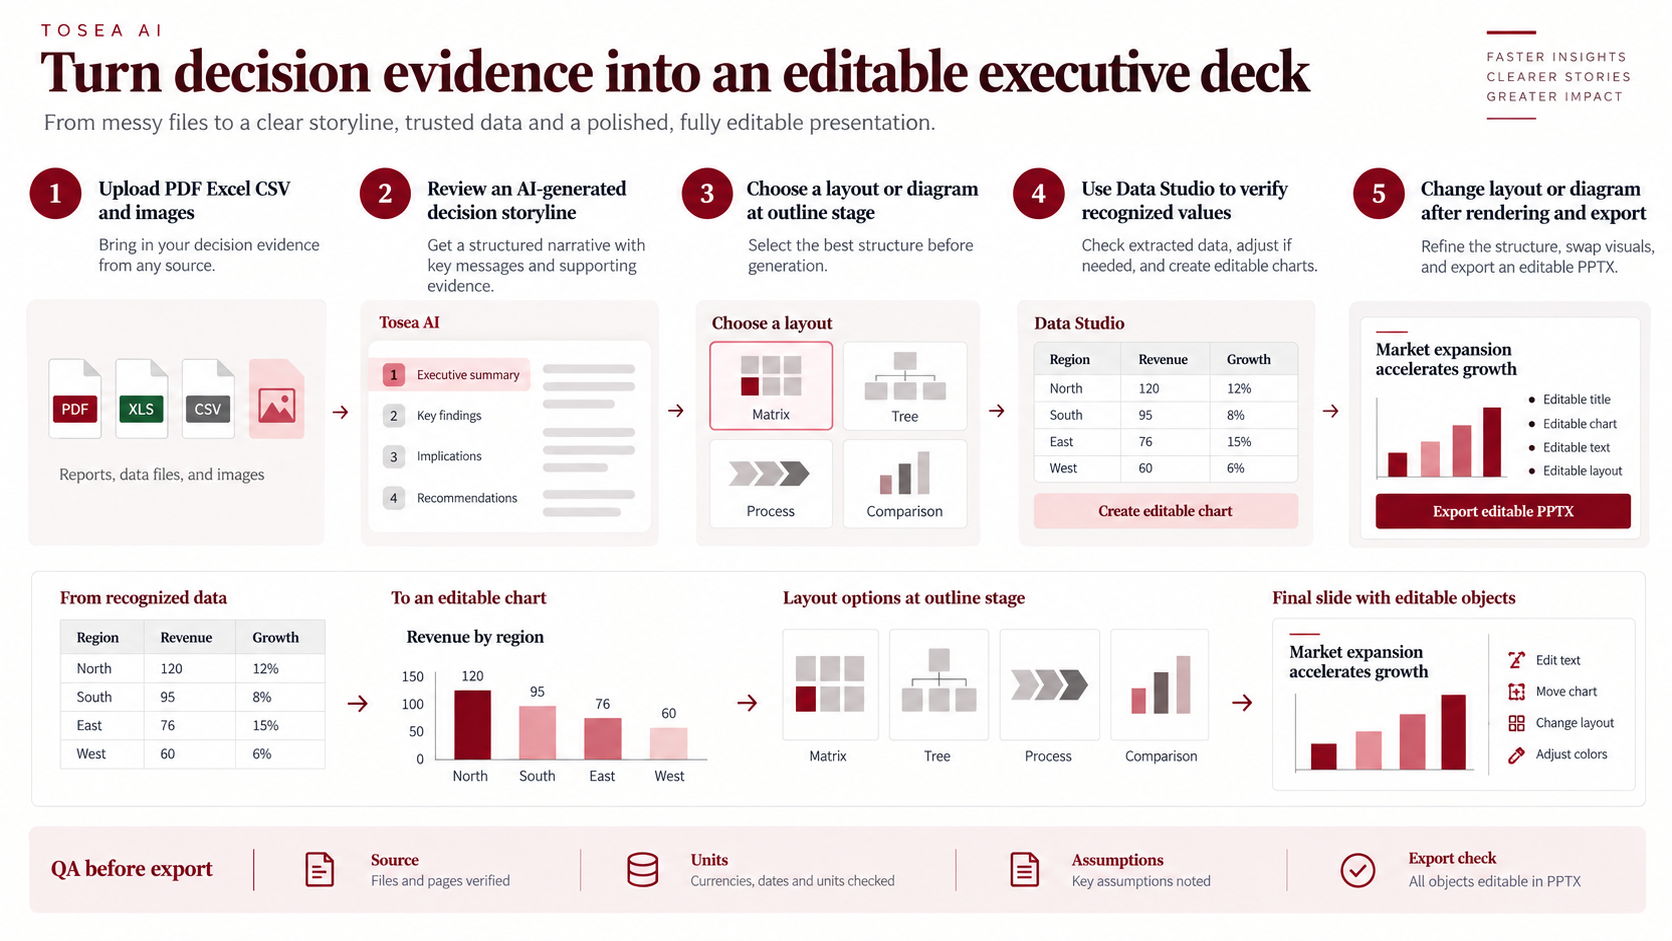
A practical SCP workflow in Tosea AI:
- Upload industry reports, competitor filings, price lists, and share data as PDF, Excel, or CSV.
- State the market definition, the external shock, and the decision the deck must support.
- Review the outline so each slide carries one layer of the chain and one action title.
- Assign visuals by relationship: concentration chart, shock timeline, conduct map, performance scorecard.
- Rebuild key charts in Data Studio and check every recognized value against the source.
- Export an editable PPTX and review fonts, footnotes, and reading order in the delivery version of PowerPoint.
SCP PowerPoint quality checklist
- The market definition is explicit and consistent.
- External shocks have dates and named sources.
- Structure uses more evidence than a single share chart.
- Concentration figures state the share basis and how "Others" was treated.
- Conduct describes observable actions, not assumed motives.
- Performance includes a baseline, period, unit, and source.
- Causal claims are separated from correlations and scenarios.
- Recommendations include conditions, risks, owners, and triggers.
- Every chart can be traced to a calculation or source file.
- The exported PPTX has been checked for fonts, labels, footnotes, and reading order.
Frequently asked questions
What is the difference between SCP analysis and Five Forces?
SCP organizes evidence as market structure, firm conduct, and performance, often with an empirical industry focus. Five Forces evaluates the pressures that shape industry profitability. They overlap, but SCP is better suited to tracing an observed shock through behavior to measurable outcomes. Neither framework proves causality by itself.
Can Tosea AI redesign my existing PowerPoint without changing the content?
Yes. Export the PowerPoint as a PDF, upload it to Tosea AI, and request a redesign that keeps the wording and sequence. Use Layout Only when the goal is visual restructuring without intentional rewriting. Confirm every label, footnote, chart value, and slide element before delivery.
How do I upload a PowerPoint and ask Tosea AI to redesign each slide?
Export the file as a PDF, upload it, and state that each slide should be redesigned while preserving its content and order. Choose a template or describe the visual direction, inspect every generated slide, and export the revised presentation as an editable PPTX.
Can I upload my own PowerPoint template to Tosea AI?
Tosea AI supports custom templates on eligible paid plans. Configure the template through the available workflow, then verify required layouts, fonts, colors, logo placement, and master-slide rules before sharing the deck.
Can Tosea AI use custom brand colors, fonts, and a logo?
Yes. Specify brand colors and fonts in the instructions, and upload the logo or use a custom template where supported. These features are available on eligible plans. After export, check font availability, color values, logo clear space, and contrast.
Can Tosea AI match the style of my old company presentations?
Tosea AI can use a representative company deck as design guidance, but that does not imply permanent model training. For stronger consistency, use an approved custom template containing company layouts, colors, fonts, and logo. Compare the result with current brand guidelines.
Does Tosea AI preserve PowerPoint formatting after export?
Tosea AI editable PPTX export is designed to stay close to the generated preview while keeping elements editable. Results can vary with fonts, complex graphics, and the application used to open the file. Test the deck in the exact environment used for delivery.
Can I tell AI to edit the layout only and keep the exact wording?
Yes. Layout Only changes the visual arrangement without intentionally rewriting content. It is useful after wording has been approved. Compare the revised slide with the source and confirm labels, citations, footnotes, numbers, and line breaks.
Build a defensible SCP analysis PowerPoint with Tosea AI
A professional SCP analysis PowerPoint makes the chain of reasoning visible: external shock, market structure, observable conduct, measured performance, and a decision with conditions. It also shows where evidence ends and management judgment begins.
Tosea AI helps analysts move source documents and data into a reviewable outline, editable charts, controlled layouts, and an editable PPTX. The analyst remains responsible for the market definition, calculations, causal claims, and recommendation.
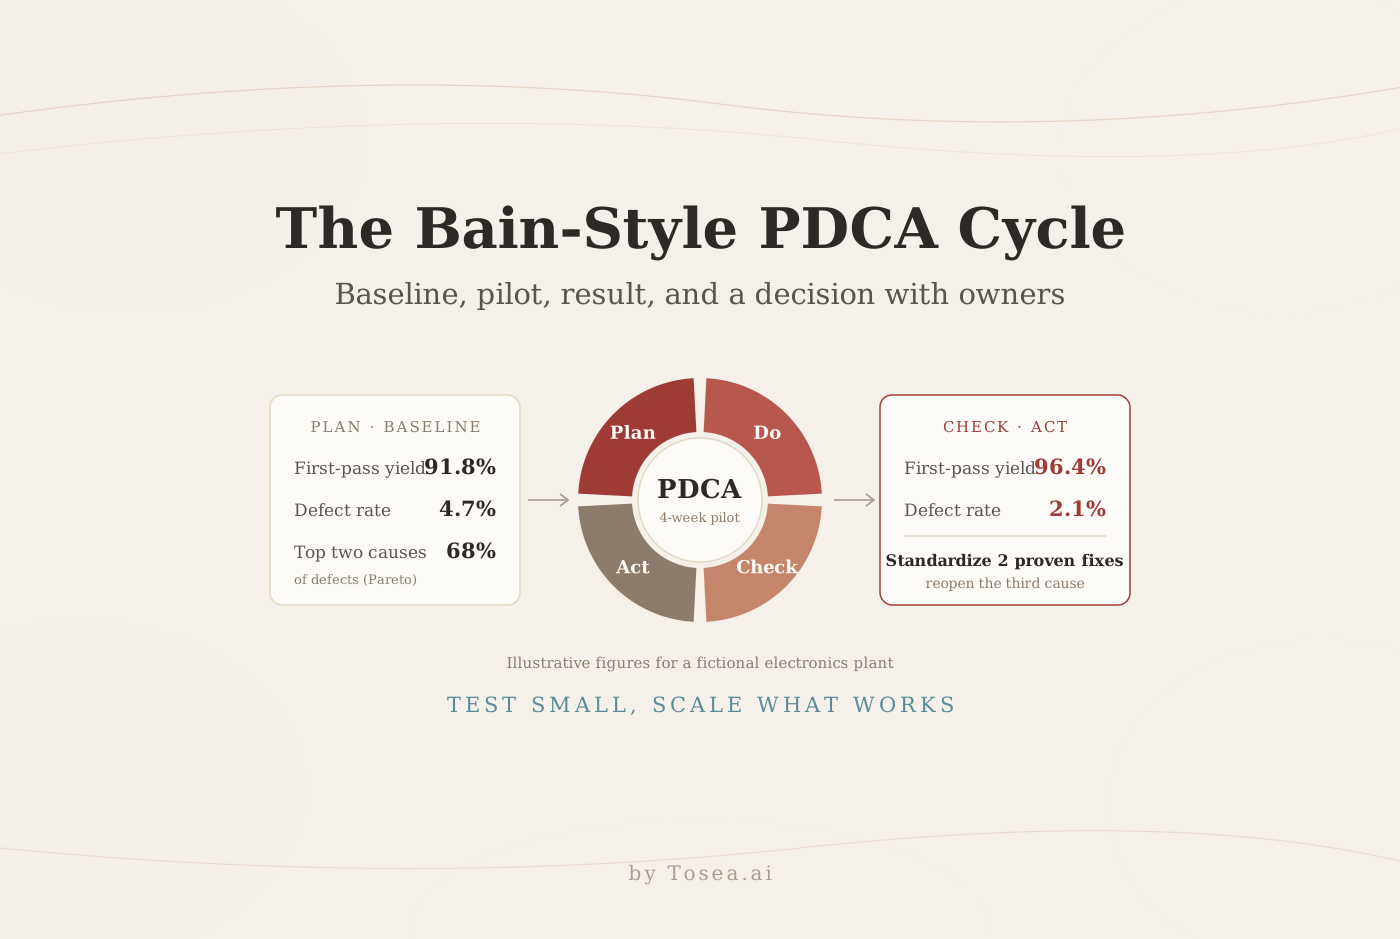
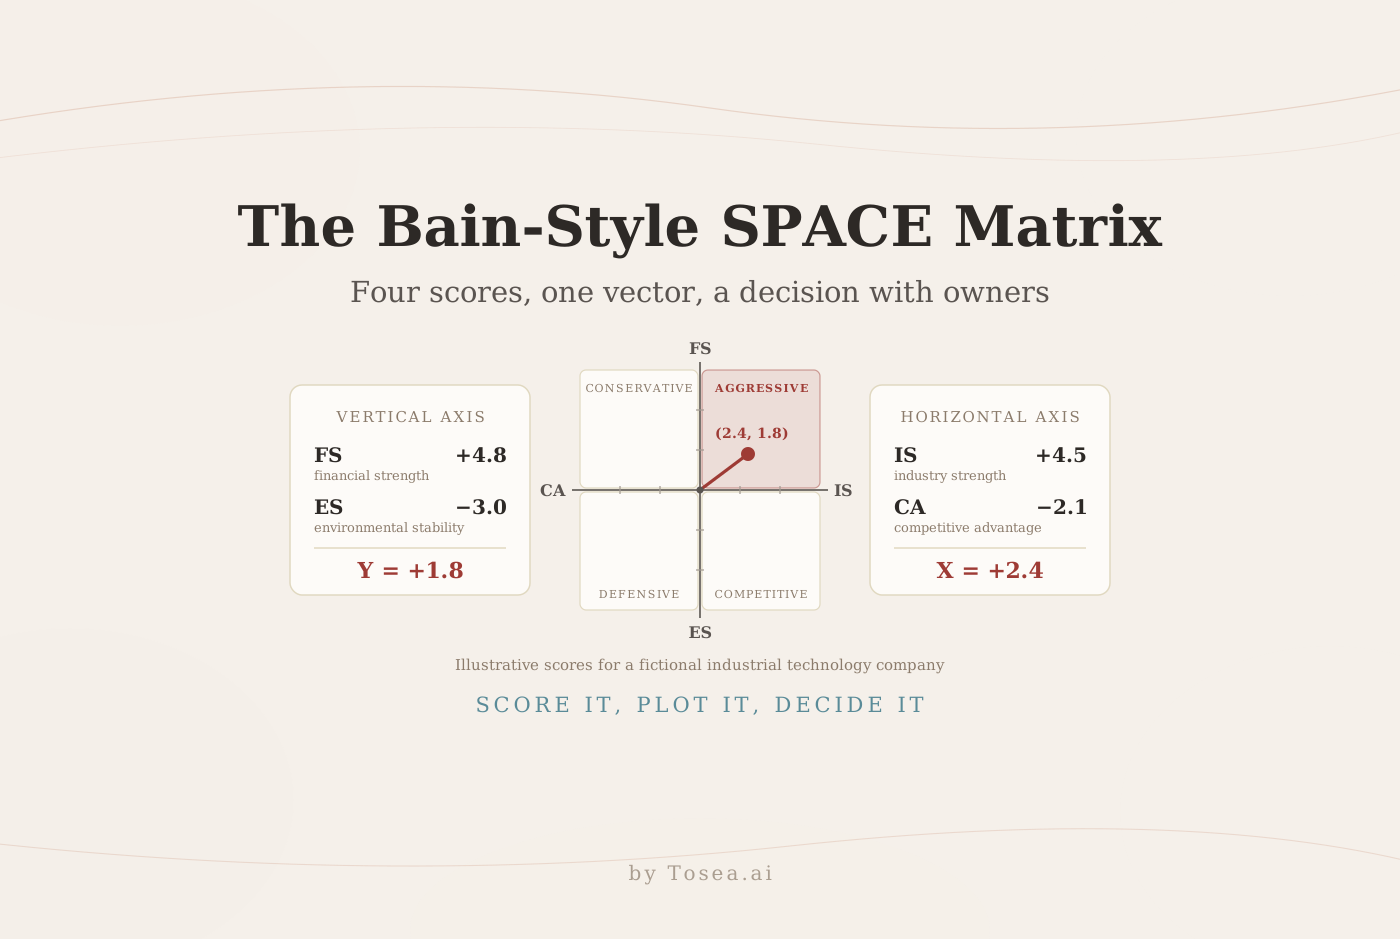
For related guidance, read the Bain-style PDCA cycle guide, the Bain-style SPACE matrix guide, and the GE-McKinsey matrix guide.
Start with one industry, one decision, and one consistent market definition. Upload the evidence to Tosea AI, review the storyline, rebuild the charts, and export a deck that can survive management questions.
Sources
- Structure-Conduct-Performance Paradigm: an overview — ScienceDirect Topics
- Methodologies to Measure Market Competition — OECD, 2021
- Herfindahl-Hirschman Index — U.S. Department of Justice, Antitrust Division
- 2023 Merger Guidelines — U.S. Department of Justice and Federal Trade Commission
- The Five Forces — Institute for Strategy and Competitiveness, Harvard Business School