


Wall method scorecard prompts
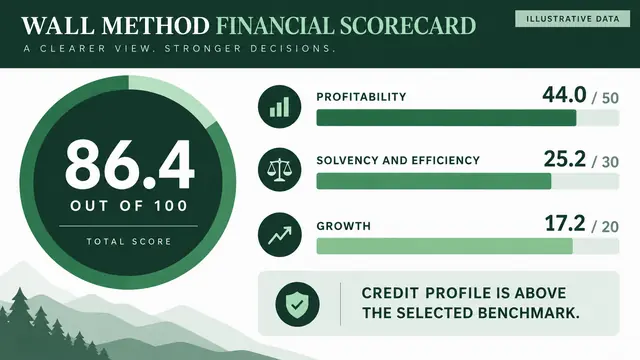
Shows a financial health score out of 100 with category contributions of 50, 30 and 20 under a decision title.
Finance · 5 prompts
Prompts for presentations where the numbers have to hold up: investor pitch decks, IPO and S-1 stories, board financial briefings, forecasts and ratio scorecards. They ask for a source on every figure and a clear label on anything illustrative.
Shows a financial health score out of 100 with category contributions of 50, 30 and 20 under a decision title.
Every prompt below is shown in full. Copy it, or run it in Tosea with your own file.
Turns a preliminary S-1 into an investor deck ordered by investor decisions, with period-safe financial charts and filing sources.
Create an investor presentation from the uploaded preliminary S-1.

Audience:
Institutional investors, equity research analysts and corporate strategy teams.

Objective:
Explain the company's business model, product architecture, customer adoption,
revenue growth, operating leverage, cost structure, capital requirements,
risk factors, governance and unresolved offering terms.

Structure the presentation around investor decisions rather than the order
of the filing. Use conclusion-led slide titles. Separate reported facts,
calculated metrics and interpretation.

For every financial slide:
- Preserve the reporting period and units
- Do not combine annual and half-year figures in one continuous trend
- Label calculated ratios clearly
- Add the filing section as a source
- Do not estimate redacted or blank figures

Use a restrained institutional design with editable charts and tables.
End with the questions investors should resolve before valuation.
Builds a slide-by-slide financial deck with conclusion titles, three-bullet limits, chart picks, speaker notes and verification flags.
Act as a financial presentation strategist and slide creator.
Create a complete slide-by-slide financial presentation on:
[insert financial topic — e.g., Q3 earnings results, Series B pitch, annual budget review]
Audience: [insert audience — e.g., board of directors, buy-side analysts, potential investors, CFO]
Goal: [inform / persuade / request approval / update / raise capital]
Length: [insert number of slides]
Tone: [executive / technical / persuasive / conservative]
For each slide, include:
A conclusion-style slide title that states the key message — not just a label
Main takeaway in one sentence
3 bullet points maximum
Recommended financial visual (chart type, table format, or diagram)
Speaker notes with transition to the next slide
Flag any statistic or figure that requires external verification with the label: NEEDS VERIFICATION
Structure the deck with:
Executive summary
Current financial position or business context
The central problem or opportunity
Financial impact and analysis
Supporting evidence and data
Recommendation or ask
Risk factors
Next steps and required decisions
Make this deck decision-ready. Every slide should push toward the final ask.
Structures a fundraising deck as hook, conflict, stakes, journey, insight, transformation and ask, flagging every market-size claim.
Create a fundraising or investor presentation on:
[insert topic — e.g., Series A pitch, secondary offering, strategic partnership proposal]
Use this narrative structure:
Hook:
the single insight that changes how the audience sees this opportunity
Conflict:
what is broken, missing, or inefficient in the current market
Stakes:
the financial and strategic cost of the status quo
Journey:
the path from current state to market capture
Insight:
the proprietary advantage or insight that makes this possible
Transformation:
what the market looks like after this solution succeeds
Call to Action:
the specific ask and what it enables
For each slide, include:
Slide title as a memorable headline, not a label
Core financial idea or market claim
Narrative beat — where this slide sits in the story arc
Recommended visual metaphor or financial chart
Speaker notes with one line to deliver with emphasis
Flag any market-size claim or growth projection with: NEEDS VERIFICATION
Avoid generic startup language. Make this feel like a credible investment thesis, not a product demo.
Explains each financial concept in plain English with a business analogy and defines terms like EBITDA or IRR on the same slide.
Build an executive-level financial presentation on:
[insert financial topic — e.g., risk exposure, budget variance, regulatory impact, capital allocation]
The audience has limited financial background. Explain every concept clearly enough that a senior executive without an accounting background would follow every slide.
For each financial concept, provide:
A plain-English explanation of what it means
A real-world business analogy
The specific business decision it informs
A visual that clarifies rather than decorates
Speaker notes that anticipate non-technical questions
Rules:
No unexplained jargon. If you use EBITDA, LTV, CAC, IRR, or similar terms, define them immediately on the same slide.
No assumptions about prior financial knowledge.
Flag any benchmark figure with: NEEDS VERIFICATION
The goal is decision-readiness, not financial education.
Builds an analysis deck with methodology, sensitivity analysis and a source appendix, and marks any missing figure instead of inventing it.
Create a research-backed financial presentation on:
[insert topic — e.g., market entry analysis, competitive landscape, credit risk assessment]
Audience: [insert audience]
Goal: [insert decision or action required]
For each slide, include:
A conclusion-style slide title
Key analytical takeaway
Supporting financial evidence required — chart type, data source category, or analysis type
Suggested data visualization — waterfall chart, sensitivity table, scatter plot, regression line, or other
Speaker notes with citation guidance
For any specific figure, statistic, or market data: mark as NEEDS VERIFICATION
Structure the deck with:
Market or business context with key macro factors
The analytical question this deck answers
Methodology — how the analysis was conducted
Key findings with supporting data
Scenario analysis or sensitivity analysis
Risks and limitations
Conclusion and recommendation
Source appendix
Rules:
Never invent numbers. If a figure is missing, write: NEEDS VERIFICATION — [describe what data is needed]
Every quantitative claim needs a source category (e.g., company filings, market data provider, management estimate)
Fixes an eight-slide board briefing from executive summary to decisions required, with no more than six figures on the metrics slide.
Create an executive-level financial briefing on:
[insert topic]
Audience: [CEO / CFO / board / investment committee / audit committee]
Structure exactly as follows:
Slide 1:
Executive summary — the situation, the recommendation, and the decision required — in three bullets maximum
Slide 2:
Current financial position — the most relevant metrics, no more than six figures on this slide
Slide 3:
The central problem or opportunity — stated as a financial impact, not a description
Slide 4:
Analysis — supporting data for the recommendation, structured as a comparison, scenario, or trend
Slide 5:
Strategic options — two or three alternatives with financial and strategic tradeoffs
Slide 6:
Recommendation — one clear direction with the financial case
Slide 7:
Risks — the three most significant risks and the mitigation approach for each
Slide 8:
Next steps and decisions required from this meeting
For each slide:
Title states the conclusion, not the topic
Maximum three bullets
Recommended visual or data format
Speaker notes with the decision or action this slide leads to
Flag any figure with: NEEDS VERIFICATION
No filler. No generic business language. Every word earns its place.
Reviews existing financial slides and recommends the right chart, text cuts, layout and a sharper conclusion headline for each.
Act as a senior financial presentation designer.
Review and improve this slide-deck content for visual clarity and analytical impact:
[paste your slide content here]
For each slide, recommend:
The most appropriate chart or visualization type for the financial data (waterfall, bridge, line chart, scatter plot, heat map, comparison table, or other)
What text to cut — every slide should show, not tell
What should be converted from bullets to a visual
Specific layout recommendation (two-column, full-bleed chart, timeline, matrix, or other)
A stronger conclusion-style headline that states the financial insight
A cleaner, shorter version of the slide copy
Design rules:
One financial insight per slide
Lead with the conclusion, support with data
Financial tables must show all necessary rows — do not abbreviate data that decisions depend on
Highlight the key metric or result in the primary brand color
All axes labeled, all data sourced
Charts should look publication-ready, not presentation-template default
Make this deck look like it came from a top-tier investment bank or consulting firm, not a template library.
Writes opening lines, talking points and transitions for each slide, plus the 10 hardest audience questions with direct answers.
Act as a financial speechwriter and investor presentation coach.
Using this deck:
[paste your slide outline or key slide titles]
For each slide, create:
Opening line — the first sentence of your delivery for this slide
Main talking points — what to say, not what is on the slide
Financial story or example to make the number real
What to emphasize — the one figure or claim that must land
Transition to the next slide — what connects this slide to what follows
The hardest financial question this slide will provoke
A strong, specific answer to that question
After the slide notes, provide:
The 10 most challenging questions this audience will ask after the full presentation
A direct, confident answer to each question
Rules:
Do not make the delivery sound like reading bullets aloud
Use natural, confident financial language
Anticipate skepticism about projections, assumptions, and risks
This is where the presentation becomes defensible — the numbers are only part of the case.
Pulls the top five financial risks and three growth opportunities from a long annual report and cites the PDF page on every slide.
Using the uploaded 200-page annual report, extract the top 5 financial risks and 3 growth opportunities. Structure the slides for an audience of institutional investors, focusing on the 'Risk Mitigation' section. Ensure every slide references the specific page number from the PDF.
Condenses a prospectus's business model and competitive landscape into 15 minimalist slides that favor visual metaphors over bullets.
Summarize the 'Business Model' and 'Competitive Landscape' sections of this draft prospectus. Use minimalist design principles and prioritize high-impact visual metaphors over bullet points. Limit to 15 slides.
Draws base, optimistic and conservative revenue lines over three years and shades the range between the upper and lower cases.
Create a financial forecast slide showing projected revenue for the next three years. Display the base case as a solid line, optimistic case as a dotted line above, and conservative case as a dotted line below. Shade the area between the optimistic and conservative lines to represent the confidence range.
Turns a business plan into a standard 12-slide pitch deck from problem to use of funds, each slide titled with one message.
Transform this business plan into a 12-slide investor pitch deck following the standard pitch deck template structure: Problem, Solution, Market Size, Product, Business Model, Traction, Competitive Landscape, Team, Financial Projections, Funding Ask, Use of Funds, and Appendix. Each slide should have a single clear message as the title and supporting evidence as the body content.
Builds a thesis deck with a TAM/SAM breakdown, three evidence-backed arguments, risks, model assumptions and bull, base and bear returns.
Create an investment thesis presentation for [company/fund]. Structure: Market opportunity with TAM/SAM breakdown, Thesis statement as a single sentence, Three supporting investment arguments each with data evidence, Risk factors with mitigation strategy for each, Financial model summary with key assumptions, Portfolio fit analysis, and Return scenario analysis showing base, bull, and bear cases.
Give the model your business plan or memo, name the investor audience, and ask for the standard arc: problem, solution, market, traction, business model, team, financials and the ask. Require a source for every number.
It can draft the structure, charts and commentary. Attach the report, ask it to use only figures from the file, and check every total before you present.
No. Figures on the example slides are illustrative. Replace them with your own data.
McKinsey-, BCG- and Bain-style strategy frameworks.
Conference talks, defenses, journal clubs and lectures.
QBRs, board decisions, dashboards and reviews.
Pitch decks, investor updates and financial reviews.
Launch plans, campaign reviews and monthly reports.
Themes, chart styling and slide redesign.
Upload the document. Tosea drafts the deck, you edit and export.
Start for free