QBR presentation prompt
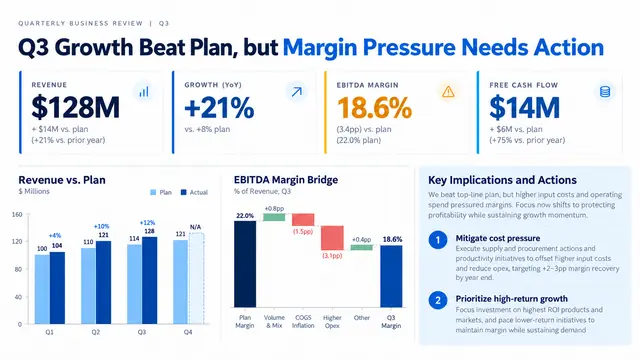
A prompt for a 10-slide quarterly business review aimed at an executive committee.
Business · Example slide
Prompts for the decks managers present every quarter: business reviews, board decisions, operating dashboards, market entry cases, competitive analysis and project postmortems. Each one names the audience and the decision, which is what turns a report into a presentation.
A prompt for a 10-slide quarterly business review aimed at an executive committee.
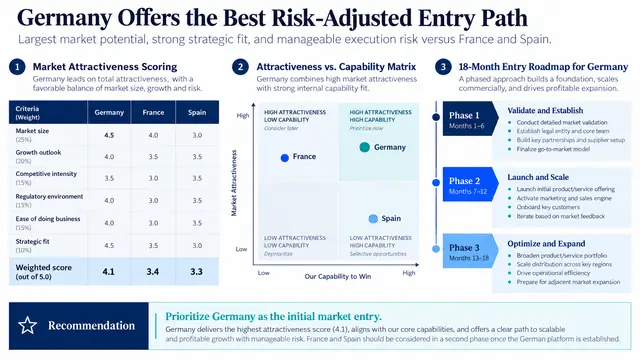
A prompt for a 12-slide market entry recommendation for a CEO and investment committee.
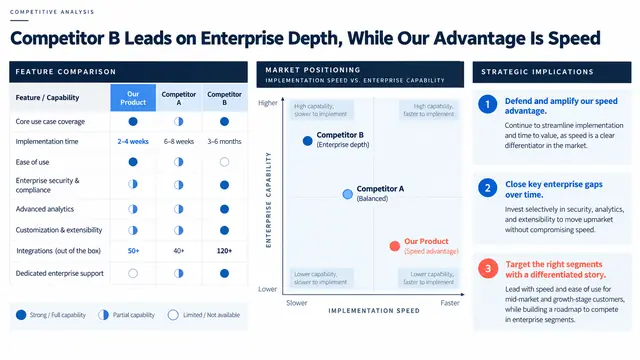
A prompt for an 8-slide competitive analysis that compares your product with two competitors for product and commercial leaders.
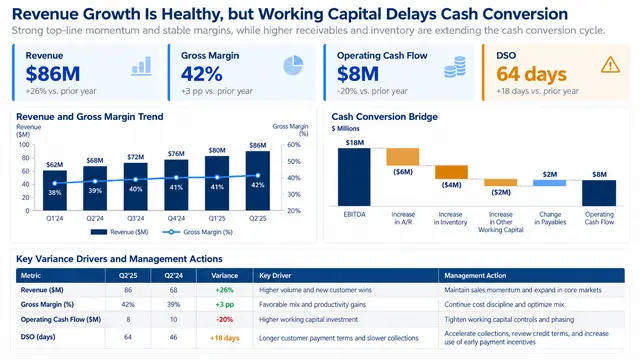
A prompt that turns management accounts into a 9-slide financial diagnosis for a CFO and business unit leaders.
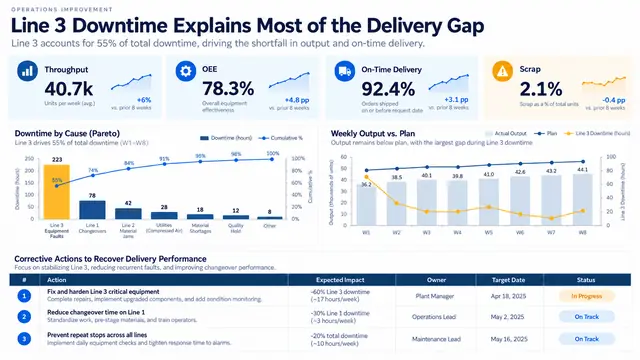
A prompt for a 10-slide operations review aimed at a COO, plant managers and supply chain leads.
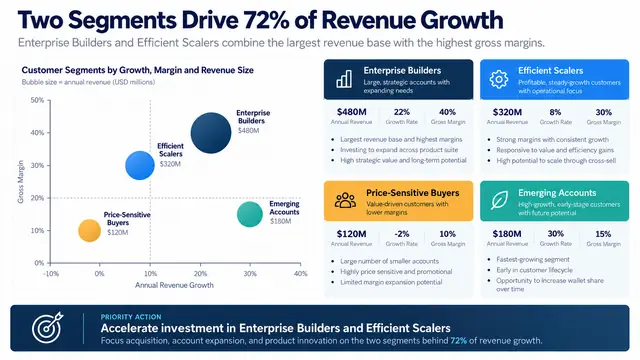
A prompt for a 9-slide customer segmentation deck for revenue and marketing leaders.
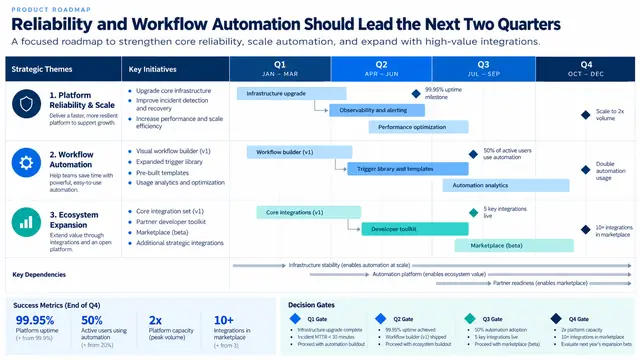
A prompt for an 11-slide, four-quarter product roadmap for executives, product, engineering and go-to-market leaders.
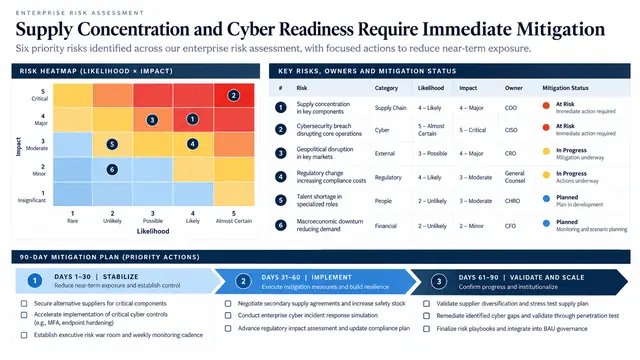
A prompt for an 8-slide enterprise risk assessment for an executive risk committee.
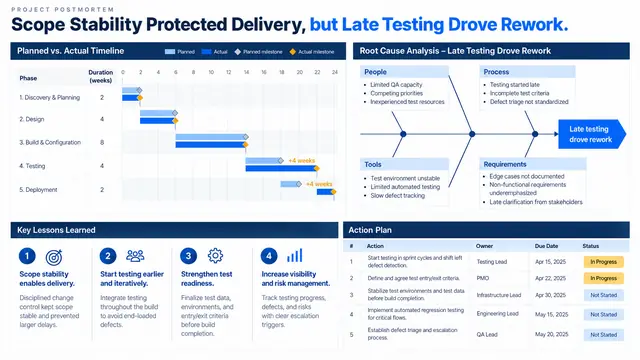
A prompt for a blameless 7-slide project postmortem for a steering committee and delivery team.
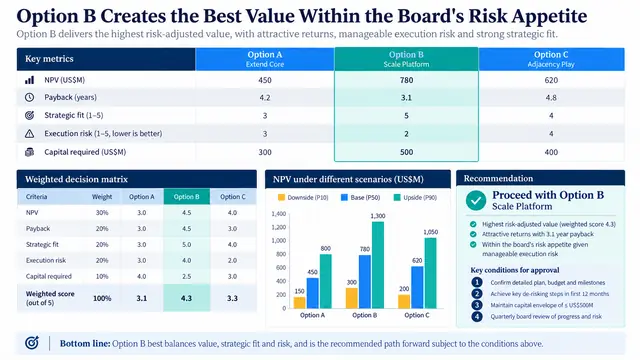
A prompt for a 10-slide board deck that compares three investment options on strategic fit, NPV, payback, capital and execution risk.
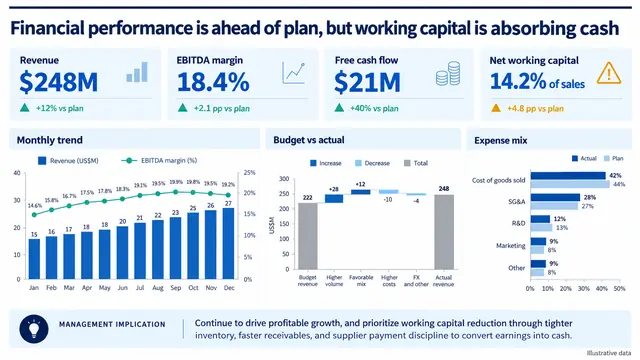
Builds a one-slide CFO dashboard tracking revenue, margin, cash and working capital, with waterfall steps that reconcile.
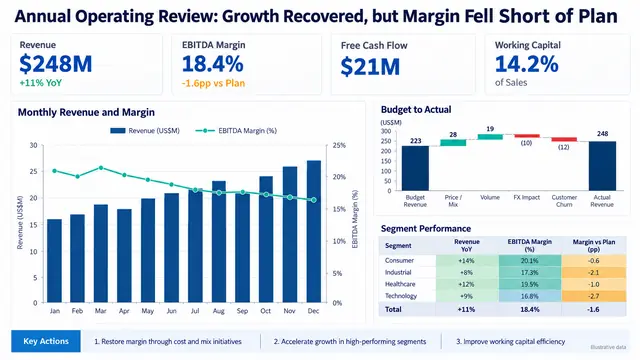
Turns an Excel workbook into a full-year review slide with KPI cards against plan, a budget waterfall and a segment heatmap.
Every prompt below is shown in full. Copy it, or run it in Tosea with your own file.
Turns a report into a 10-slide executive deck with takeaway titles, a source note for every material number and an editable PPTX.
Create a 10-slide executive presentation from the attached report.
Audience: business unit leaders with five minutes to review before a meeting.
Goal: explain the decision, the evidence, the financial effect, and the next action.
Use takeaway titles, one main message per slide, and a restrained consulting style.
Reuse source charts where accurate. Rebuild simple charts as editable objects.
Add source notes for every material number.
Export an editable PPTX.
Render every slide and check overflow, alignment, contrast, and font substitution before delivery.
Compares local power expansion with computation-transfer siting on one slide, with a cost callout and stated exclusions.
Using the uploaded Qu et al. manuscript, create one 16:9 executive slide comparing local energy expansion with computation-transfer-based siting of new data centers. Show two alternatives with their main dependencies. Add one callout: approximately 44-47% lower modeled construction costs under the reported comparison. State that servers, network hardware, and AI accelerators are excluded. Use a dark green, ivory, and amber palette. Cite the abstract, Section 3.4, and Figure 2 caption. Do not depict physical relocation of existing facilities or guarantee project savings.
Builds a five-row screening table for energy, water, connectivity, land and financing, labeled as proposed checks.
Create one 16:9 site-screening slide grounded in Section 2 of the uploaded paper. Build a five-row table: energy, water, digital connectivity, land, and financing. For each row, specify an evidence input and a feasibility question. Mark every item as a proposed screening check, not an observed site rating. Add a separate unresolved-issues strip for energy security, data security, and environmental compensation in cross-border deployment. Use no invented location scores or investment recommendations. Cite Section 2 and the limitations in Section 4.
Separates movable workloads from latency-sensitive services with a shared eligibility gate and a modeled 100 ms threshold.
Create one 16:9 cloud-architecture discussion slide distinguishing potentially flexible workloads from latency-sensitive services. Use two columns and a shared eligibility gate covering latency, bandwidth, approved destinations, and resilience. Identify 100 ms as the paper's modeled service threshold, not a universal SLA. Add a callout that synchronized distributed training needs separate engineering validation. Label workload examples and gates as proposed guidance. Cite the flexibility constraints in Section 2.3.2 and Section 2.3.4. Invent no workload shares, throughput gains, or migration success rates.
Charts modeled emissions on a zero-based axis and keeps data transmission emissions inside the net reduction.
Create one 16:9 sustainability slide from Section 3.4 and Figure 7. Plot annual modeled emissions with a zero-based axis in Mt CO2/year. Local energy expansion is 184.9. Computation-transfer siting consists of 101.7 for receiving-site operations plus 13.1 for data transmission, totaling 114.8. Annotate the net reduction as 70.1, approximately 37.9%. Add a note that some receiving corridors increase emissions. Use green for operations and amber for transmission. Do not omit network emissions or present a whole-industry historical reduction.
Builds an eight-slide interview portfolio that maps your real evidence to the role's top five requirements through two case studies.
Create an eight-slide job portfolio presentation for the target role in my uploaded job description. Use only evidence from my approved files. Start with my professional value proposition, then map my skills to the role's top five requirements and present two case studies using problem, constraints, my responsibility, method, result, and lesson. Separate my contribution from team outcomes and cite the source of every metric in a footnote. Preserve relevant charts and work samples, flag missing evidence, remove client names and confidential details, and use concise action titles. Do not invent metrics, clients, tools, or experience. Produce an editable PowerPoint suitable for a 10-minute interview discussion.
Contrasts AI risk mentions with substantive disclosure on one slide, showing a percentage-point gap and its denominator.
Read the uploaded AI Risk Observatory v2 paper. Create one 16:9 board briefing slide in navy, teal, and white. Compare 41.2% of all 2025 reports mentioning AI risk with 4.3% containing substantive AI risk disclosure. Show a 36.9 percentage-point gap, not a percent change. Add the denominator: 1,561 reports. Explain that 67 of 643 risk-mentioning reports were substantive, equal to 10.4%. Define substantive as a specific risk mechanism plus a tangible company response. Cite Table 4 and Section 4.6. Label the management follow-up as a proposed action, not a paper finding.
Plots disclosure rates for two market segments on a shared zero-based scale, with sample sizes and an exclusions caveat.
Create a two-bar comparison slide from Table 3 of the uploaded v2 paper. Plot 2025 AI risk disclosure: Main Market 57.8%, n=703 reports; AIM 6.4%, n=171 reports. Use a zero baseline and a shared percent scale. Add a visible caveat that 687 reports were excluded from this printed segment comparison, including 676 without a provider-assigned segment and 11 Aquis reports. Mention that refined segment mapping changes the Main Market rate. Do not treat nested FTSE groups as independent categories or infer that lower disclosure means lower risk.
Turns vendor mentions into four linked cards of procurement questions, labeled as a proposed diligence framework.
Build a procurement workshop slide inspired by the uploaded paper. Use four linked cards: provider and model, business workflow, dependency, and fallback. Under each card, list two questions that procurement should verify internally. Label the whole diagram as a proposed diligence framework. Include the research observation that Microsoft leads named vendor mentions, without converting mentions into market share, spending share, or service reliability. Leave internal vendor names and exposure values unfilled unless verified source data is supplied. Cite Section 4.3.
Explains a three-level boilerplate-to-substantive rubric with labeled illustrative examples and a review checklist.
Create a 16:9 reporting workshop slide explaining the paper's risk substantiveness rubric. Use three levels: boilerplate, moderate, substantive. For substantive disclosure, require both an AI risk mechanism and a tangible company response. Use paraphrased hypothetical examples, clearly labeled illustrative, and do not attribute them to any company. Add a proposed checklist: affected workflow, accountable owner, response, evidence, and review date. Explain that this is a communication aid, not a compliance certification or a validated measure of actual resilience. Cite Section 3.3 and Appendix G.
Turns a report and spreadsheet into an executive deck, choosing bar, line, scatter, heatmap or waterfall by the question asked.
Create an executive presentation from the uploaded report and spreadsheet.

Audience: senior leadership
Decision: determine where to invest, fix performance, or investigate further
Time period: [insert period]
Required comparisons: actual versus plan, current period versus prior period, and segment performance

Use the uploaded data as the source of truth. Do not invent missing values.
For every chart, preserve units, time periods, category labels, source notes, and sample sizes.
Choose the chart according to the analytical question:
- bars for category comparison
- lines for change over time
- scatter plots for relationships between two numeric variables
- heatmaps for patterns across a matrix
- waterfall for bridging one total to another

Use the presentation theme by default. Reserve one accent color for the most important series.
Write an action title that states the finding on each slide.
Flag missing data, inconsistent definitions, and any value that cannot be verified.
Builds a nine-slide answer-first return-offer review with a STAR case, measurable contribution and a 90-day plan.
Create a nine-slide consulting and finance internship conversion presentation for a manager and partner review panel. Use an answer-first storyline. Show my professional profile, work overview, one detailed STAR case, measurable contribution, one mistake and method upgrade, broader role insight, and a 90-day development plan. Use restrained consulting-style design, action titles, editable text, evidence-first charts, and clear source labels. Do not invent results. Flag missing evidence for my review before rendering.
Turns an engineering whitepaper into a 10-slide value proposition deck for a marketing team, with minimal jargon.
Analyze the technical specifications in this engineering whitepaper. Create a 10-slide presentation for a non-technical marketing team. Focus on the 'Value Propositions' section and use a clean, consulting-style layout with minimal jargon.
Groups audit non-conformities by severity in a table layout, citing the source clause or section for every finding.
Based on this compliance audit, create a summary of non-conformities organized by severity. For every finding, include a reference to the specific clause or section number from the source document. Use a table layout where possible.
Builds one slide each for best, base and worst case outcomes from a forecast's data tables, plus a comparison summary.
From this market forecast document, generate three distinct 'What-If' scenarios. Create a separate slide for the 'Best Case,' 'Base Case,' and 'Worst Case' outcomes based on the provided data tables. Include a comparison summary slide at the end.
Turns a quarterly operations report into a 10-slide board briefing that leads with the three most critical metrics.
From this quarterly operations report, create a 10-slide board briefing. Lead with a one-slide executive summary of the 3 most critical metrics. Follow with one slide per business unit, showing performance against targets. Close with a forward-looking slide on next quarter priorities.
Converts a handbook into a 25-slide onboarding deck with one section per policy area and a quiz slide after each.
Convert this employee handbook into a 25-slide onboarding training deck. Break each policy area into a separate section. Use simplified language appropriate for new hires. Include a quiz question slide at the end of each section to reinforce key points.
Adds a rule to use only the source document and leave a placeholder wherever a figure is missing.
Only use information provided in the uploaded document. If data is missing, leave a placeholder rather than generating a figure.
Tells the model to show both values and both sources when two reports disagree on the same metric.
Where the two reports present different figures for the same metric, show both values with their sources.
Outlines a 12-slide C-suite briefing on generative AI in logistics around ROI, risk and a 24-month roadmap.
Create a 12-slide strategic outline for a C-suite presentation on adopting Generative AI in supply chain logistics. The audience is non-technical executives. Focus on three pillars: ROI projections, risk mitigation, and a 24-month implementation roadmap. Use a Problem-Solution-Benefit structure.
Writes 3-4 sentence speaker notes for a range of slides, each ending with a transition and avoiding the bullet text.
Write speaker notes for slides 3 through 6. Each note should be 3-4 sentences, include a transition phrase to the next slide, and use a conversational but authoritative tone. Do not repeat the slide bullet points verbatim.
Sets a 15-slide board deck style: one takeaway per title, four bullets at most, navy and white with gold accents.
Create a 15-slide executive presentation on [topic] for a board of directors audience. Use a clean, minimal design with generous white space. Each slide should have one key takeaway in the title, supporting data in the body, and no more than four bullet points per slide. Use a navy and white color scheme with gold accents for emphasis.
Sets up a 25-slide training deck with numbered steps, definition callouts and a knowledge check every five slides.
Create a 25-slide training presentation on [skill/topic] for new employees. Use a friendly, approachable design with a light background, clear numbered steps, and callout boxes for key definitions. Include knowledge check slide placeholders after every five content slides.
Shows four workstreams with progress bars, RAG budget status and next-milestone callouts on one grid slide.
Create a project management report slide showing four project workstreams. For each workstream, show percent complete as a horizontal progress bar, budget status as a RAG (red/amber/green) indicator, and next milestone as a text callout. Use a clean grid layout with clear visual separation between workstreams.
Converts a status report into 10 set slides: RAG summary, milestones, burn chart, workstreams, risks and decisions.
Convert the following project status report into a 10-slide executive presentation. Slide 1: executive summary with overall RAG status. Slide 2: milestone progress with planned vs actual dates. Slide 3: budget performance with burn chart. Slides 4-6: one slide per major workstream with status and key risks. Slide 7: risk register summary. Slide 8: decisions required from leadership. Slide 9: next period priorities. Slide 10: appendix placeholder.
Turns a weekly status report into five slides: wins, blockers, priorities by owner, metrics and open questions.
Transform this weekly project status report template into a five-slide team sync format. Slide 1: this week's accomplishments as bullet points. Slide 2: blockers and dependencies. Slide 3: next week's priorities by owner. Slide 4: metrics dashboard. Slide 5: open questions.
Answers three questions on one slide: the current situation, the recommendation and the action required.
Create a single executive summary slide that answers three questions: What is the current situation? What is the recommendation? What action is required? Use three columns or three distinct sections, each headed by the question, with two to three bullet points of supporting information below each header.
Lists four numbered agenda items with one-line descriptions, time estimates and icons for a 45-minute talk.
Generate an agenda slide for a 45-minute presentation covering [topic 1], [topic 2], [topic 3], and [topic 4]. Show each agenda item as a numbered section with a brief one-line description. Indicate estimated time for each section. Use icons to differentiate sections visually.
Ends a deck with three numbered takeaways, one clear next step and a call-to-action element in the brand color.
Design a closing slide that summarizes three key takeaways as numbered points, states the recommended next step clearly, and includes a call-to-action button or visual element. Use the brand primary color for emphasis on the CTA element.
Covers current metrics, 12-month themes, a quarterly timeline, the top three initiatives, dependencies and success metrics.
Generate a product roadmap presentation for a SaaS platform for [audience type]. Include: Current state overview with key metrics, Strategic priorities for the next 12 months organized by theme, Quarterly roadmap as a visual timeline, Feature detail slides for the top three initiatives, Dependency and risk summary, and Success metrics for each strategic priority.
Builds a client update with safety metrics, work completed, a two-week lookahead, RFI status, budget curve and open actions.
Create a construction project daily report presentation for a client update. Include: Safety performance metrics, Work completed this week with photos placeholder, Lookahead schedule for next two weeks, RFI and submittal status summary, Budget performance curve, Weather and site condition notes, and Open action items by responsible party.
The source file, the audience and the decision they need to make, the slide count, and the evidence rules. Telling the model what not to do, such as inventing figures, matters as much as telling it what to build.
Yes. Attach the file and use a prompt that names the metrics to show and the decision to support. In Tosea the attached file is read directly, and you can export the result to PowerPoint.
Most executive QBRs fit in 8 to 12 slides: results against plan, the drivers behind them, risks, and the decisions needed. Put the detail in an appendix.
McKinsey-, BCG- and Bain-style strategy frameworks.
Conference talks, defenses, journal clubs and lectures.
QBRs, board decisions, dashboards and reviews.
Pitch decks, investor updates and financial reviews.
Launch plans, campaign reviews and monthly reports.
Themes, chart styling and slide redesign.
Upload the document. Tosea drafts the deck, you edit and export.
Start for free