AI Data Center Siting: What 'Moving Bits Instead of Watts' Found and How to Present It
AI data center siting research explained: modeled 44-47% construction savings, the real carbon math with transmission included, the limits, and four slide examples with reusable AI prompts.
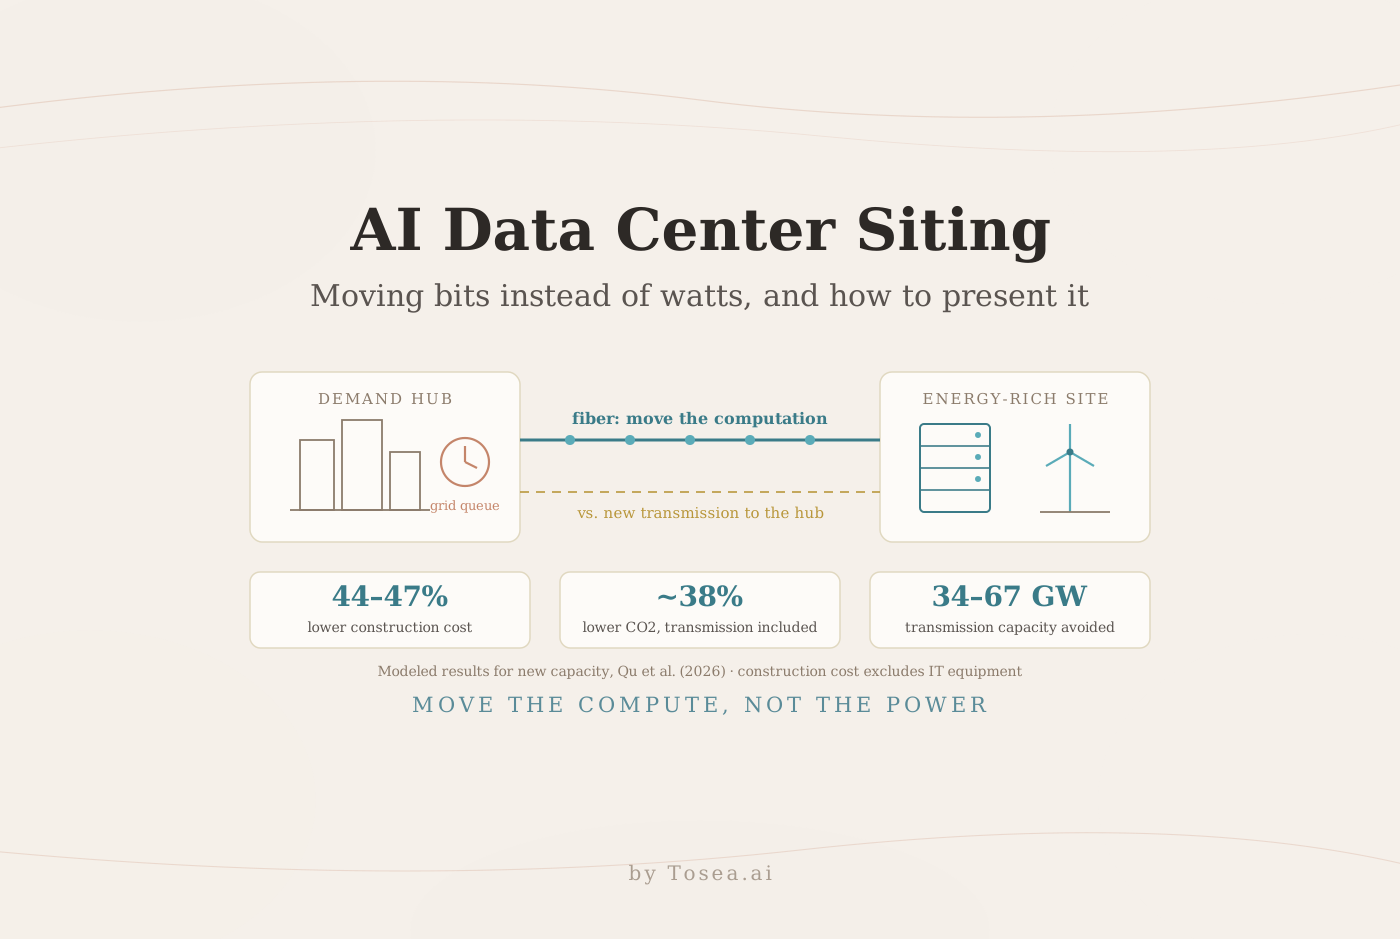
AI data center siting usually starts with a familiar question: how do we bring enough electricity to the places where computing demand is growing? A new research preprint asks whether some demand could instead be served from regions with better energy, water, connectivity, and land conditions. Its modeled results offer a compelling infrastructure story, provided the presentation keeps assumptions, comparison baselines, and operational limits visible. This guide explains what the study found and shows four ways to present it.
The research behind the headline
Jiawei Qu, Xiaoying Shi, Kai Hou, Hongjie Jia, and Jinyue Yan developed the framework in Moving bits instead of watts, submitted to arXiv on October 26, 2026. It is an optimization study, not a completed worldwide deployment or a verified commercial savings program.
The problem it addresses is concrete. The paper cites estimates that data centers used about 415 TWh of electricity in 2024, roughly 1.5% of global demand, heading toward 945 TWh by 2030, and that more than 20% of planned data-center capacity worldwide is at risk of grid-connection delay. In Northern Virginia, connection waits of five to seven years are reported. Unlike electricity, computation can be moved through fiber.
The researchers estimate construction costs across more than 4,000 subnational regions and model interconnected infrastructure across 149 countries. Their analysis includes over 240,000 high-voltage transmission lines and more than 11 million hourly operation simulations. Four data-center development pathways and nine climate-policy pathways produce 36 combined scenarios. The data-center pathways are based on the IEA Energy and AI report scenarios.
The framework allocates future capacity to feasible locations and routes computational demand through fiber networks. It compares this approach with two local energy-expansion strategies around existing demand hubs: local self-generation and transmission expansion.
The study at a glance
| Item | What the paper reports |
|---|---|
| Method | Hourly optimization with constraints on energy, water, digital connectivity, land, and financing risk |
| Coverage | More than 4,000 subnational regions; 149 countries; more than 240,000 high-voltage lines |
| Scenarios | 4 data-center pathways × 9 climate-policy pathways = 36 |
| Construction cost | About 44–47% lower than local self-generation (43.7–46.7% in Section 4) |
| Electricity cost | 17.3–20.4% lower levelized cost of electricity |
| Grid | 34–67 GW of avoided high-voltage transmission capacity |
| Delayed capacity | More than 95% of the capacity still connection-delayed in 2030 could come online |
| Emissions | 184.9 → 114.8 Mt CO2 per year for new capacity in 2030, about 38% lower |
| Preferred hosts | Canada, the Nordic countries, and the Arabian Peninsula |
What the results support
The manuscript reports roughly 44–47% lower construction costs, 17.3–20.4% lower energy costs, and 34–67 GW of avoided additional transmission capacity under the relevant comparisons; the abstract compares the GW figure to Italy's national peak electricity demand. It estimates that more than 95% of the capacity still delayed under local energy expansion could be enabled by 2030. That percentage refers to the delayed subset, which the paper puts at 10–15% of data centers worldwide, not all global data centers.
Construction costs exclude servers, networking hardware, and AI accelerators (Figure 2 caption). Therefore, a 44–47% construction reduction is not a reduction of the same size in a complete AI investment budget. Energy-cost percentages describe a separate measure and cannot be added to construction percentages.
The emissions comparison includes data transmission: modeled annual emissions fall from 184.9 to 114.8 million tonnes of CO2, approximately 38%, for new capacity in 2030. These are conditional model outputs, not observed reductions across today's industry.
Where the capacity goes
The geographic pattern is part of the story. According to Section 3.3, nearly 90% of relocated capacity originates from established hubs in the United States and Europe. Under the paper's Headwinds scenario, Canada hosts 46.7% of relocated capacity; Nordic countries host more than 60% of Europe's relocated capacity; and under the Lift-Off scenario much of the flow shifts toward the Middle East. The paper also reports that, in connection-delayed regions, construction costs are 40–54% higher and electricity costs 13–33% higher than in regions without delays, and that regional construction savings are largest in Europe (48.6%) and North America (47.1%).
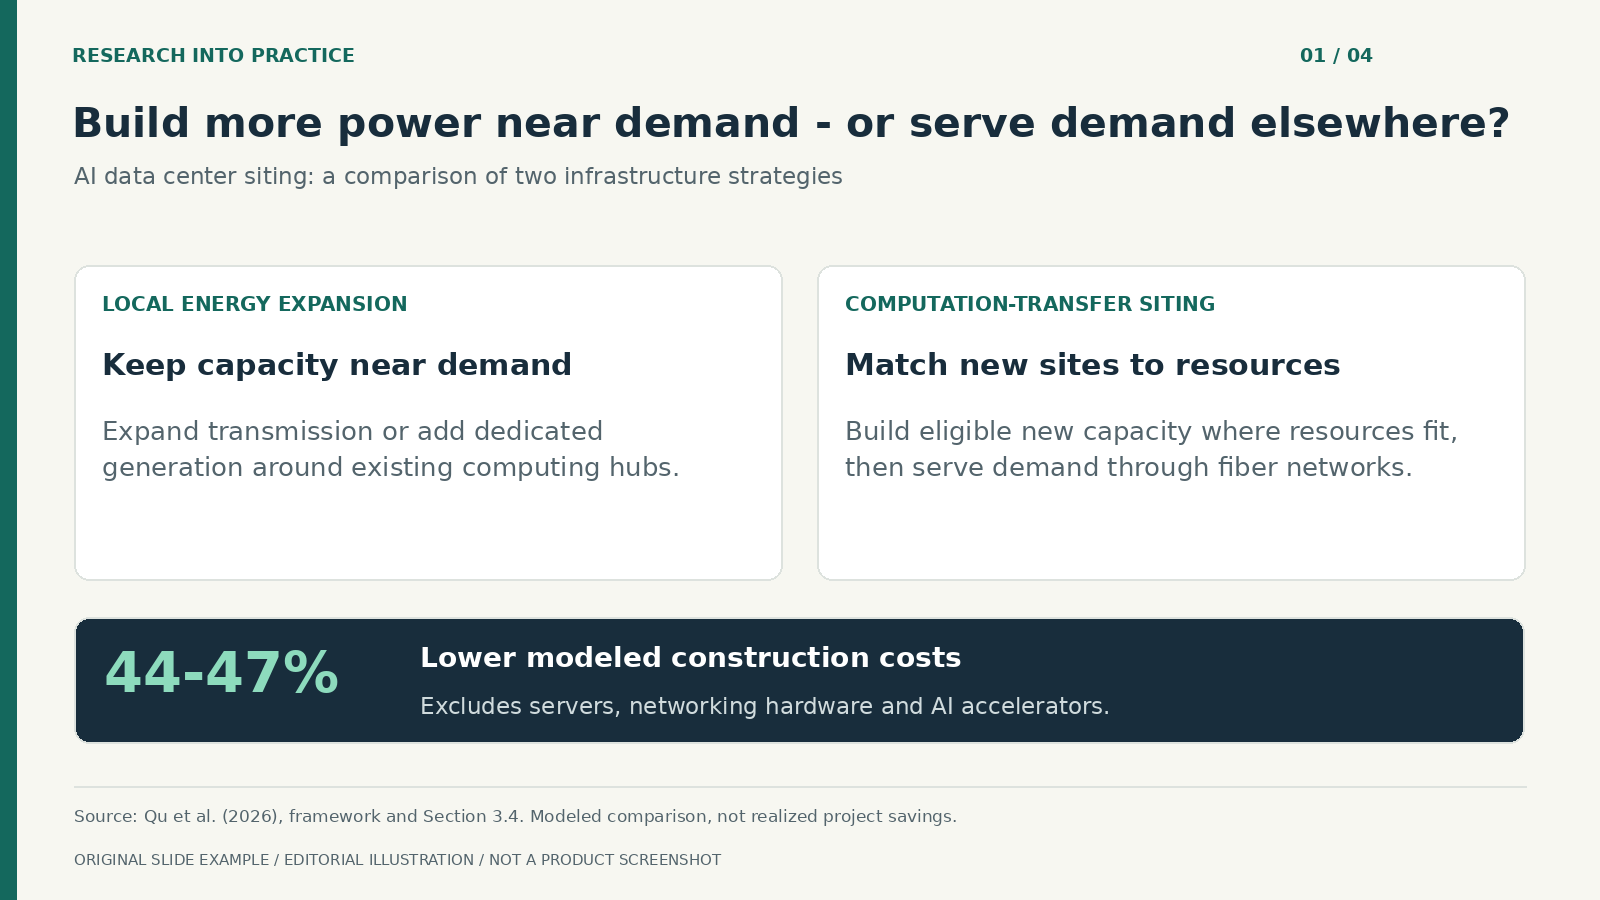
Conceptual comparison based on the study framework. The percentage callout is a modeled construction-cost range, not total project savings.
Five mistakes to avoid when presenting this study
- Calling 44–47% a project saving. It is a modeled construction-cost range against local self-generation, excluding IT equipment.
- Adding the percentages together. Construction cost, electricity cost, and emissions are separate measures with separate baselines.
- Dropping the transmission emissions. The 38% figure already includes 13.1 Mt of data-transmission emissions; leaving them out overstates the benefit.
- Reading "more than 95%" as global. It applies to capacity that would still be connection-delayed in 2030.
- Treating fiber as unlimited. The main optimization does not impose explicit fiber-capacity constraints, and the paper flags specific corridors as possible bottlenecks.
Four presentation scenarios that make the findings useful
Each example below translates the paper into a decision a team might discuss. All images are original editorial slide examples. Research values are sourced; proposed checklists are explicitly identified. They are not Tosea AI screenshots or results from an implemented client project.
Scenario 1: Explain the infrastructure choice to executives
An executive briefing should begin with the choice shown in the slide above: expand local supply around demand, or investigate serving eligible demand from a better-resourced location. Show the existing approach and the alternative side by side, then state what evidence would justify further evaluation. Our board deck structure guide covers how to frame a single decision like this for directors.
Copyable AI presentation prompt
Using the uploaded Qu et al. manuscript, create one 16:9 executive slide comparing local energy expansion with computation-transfer-based siting of new data centers. Show two alternatives with their main dependencies. Add one callout: approximately 44-47% lower modeled construction costs under the reported comparison. State that servers, network hardware, and AI accelerators are excluded. Use a dark green, ivory, and amber palette. Cite the abstract, Section 3.4, and Figure 2 caption. Do not depict physical relocation of existing facilities or guarantee project savings.
Scenario 2: Build a site-screening discussion
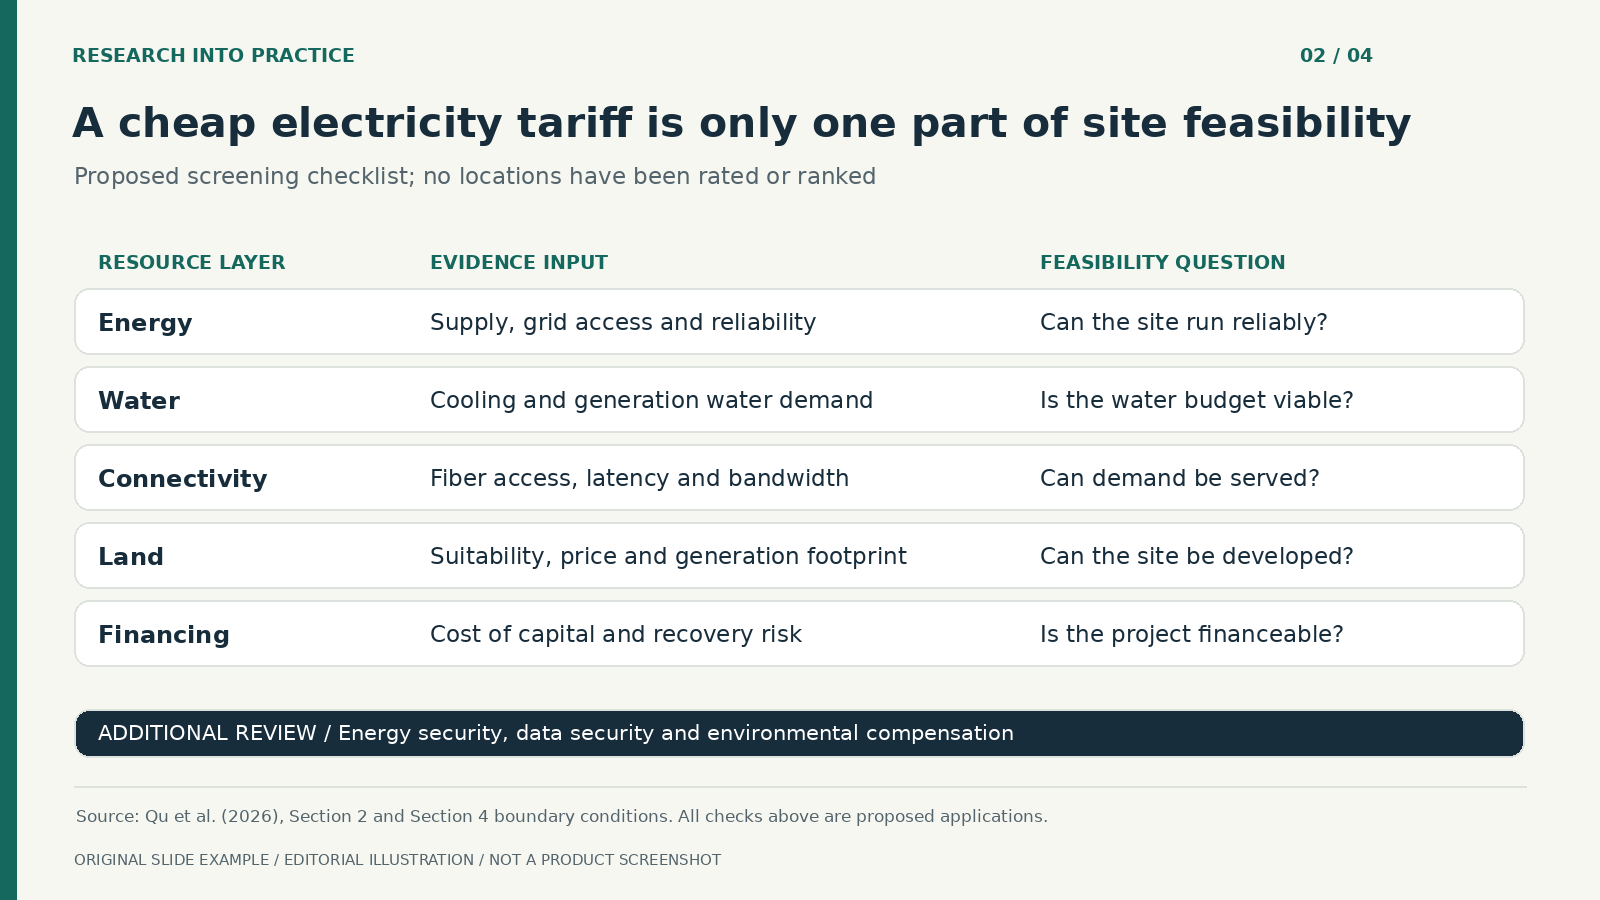
Proposed screening checklist informed by the resource layers and financing treatment in Section 2.
A location can look attractive on electricity price and still fail a wider feasibility review. This slide helps infrastructure teams examine energy reliability, cooling and water availability, fiber connectivity, land suitability, and financing risk together. The paper shows why each layer matters: in Europe, land-price factors add up to 1.81 USD per watt under self-generation, and in West Asia water constraints raise unit construction cost by up to 1.50 USD per watt.
Add a separate review for issues the optimization does not price. Section 4 states that the model "does not explicitly account for energy security, data security and environmental compensation issues associated with cross-border data-centre deployment." Data-residency rules and national barriers to data flows belong in the same review; they require additional diligence before execution.
Copyable AI presentation prompt
Create one 16:9 site-screening slide grounded in Section 2 of the uploaded paper. Build a five-row table: energy, water, digital connectivity, land, and financing. For each row, specify an evidence input and a feasibility question. Mark every item as a proposed screening check, not an observed site rating. Add a separate unresolved-issues strip for energy security, data security, and environmental compensation in cross-border deployment. Use no invented location scores or investment recommendations. Cite Section 2 and the limitations in Section 4.
Scenario 3: Separate workloads before discussing relocation
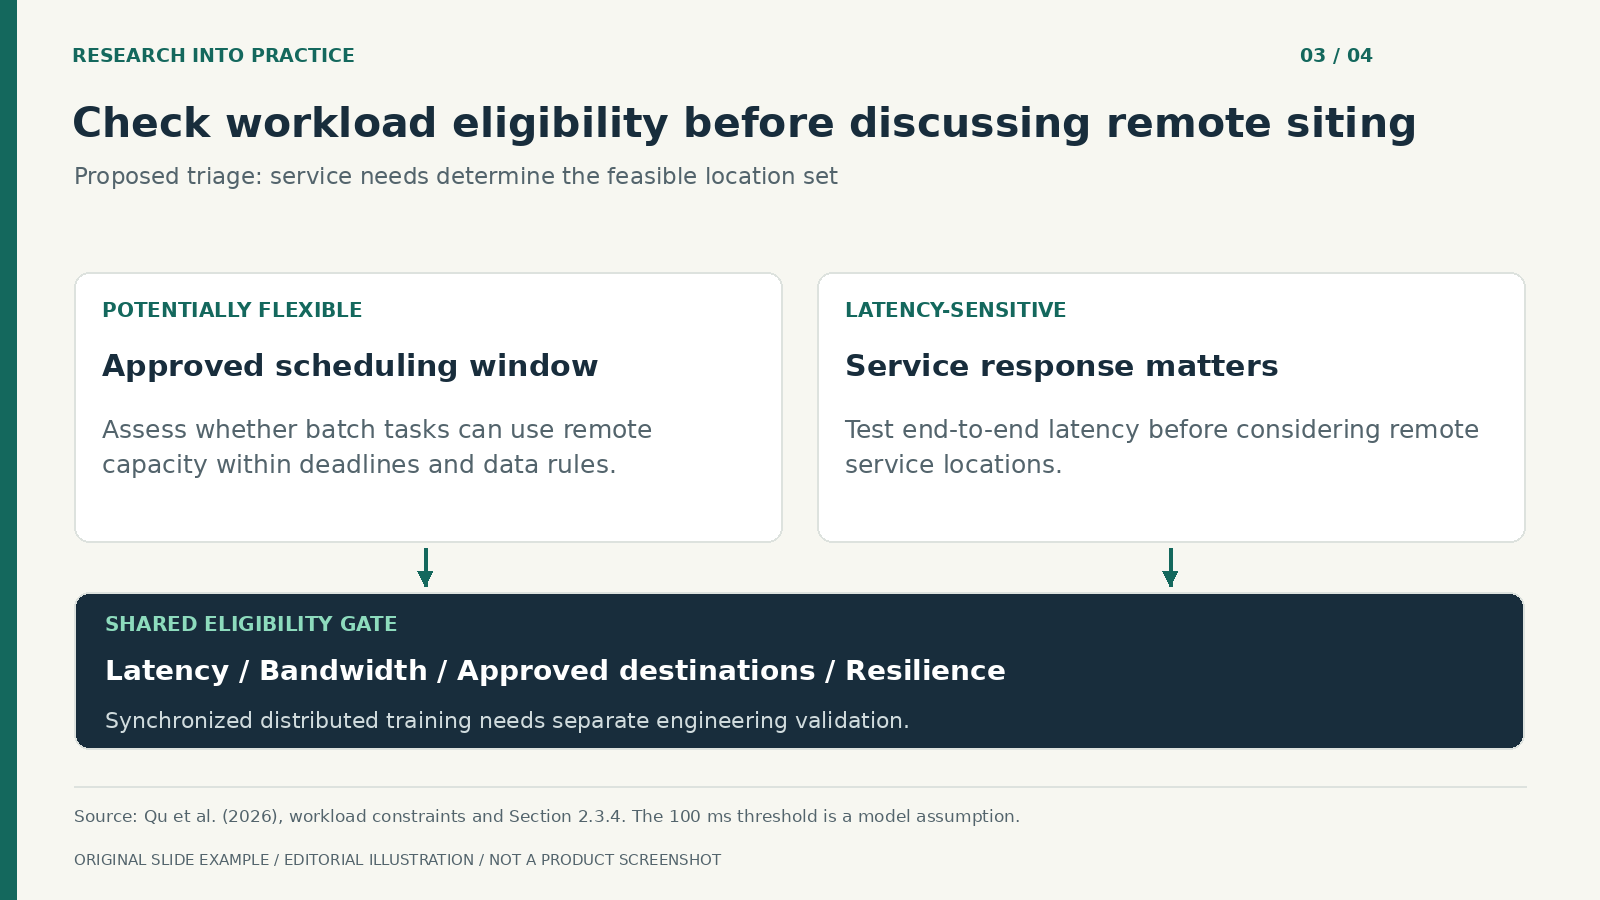
Proposed workload triage, informed by the paper's flexibility and latency constraints. Actual eligibility requires service testing.
For a cloud or platform team, the most useful question is which demand can be served remotely without violating service requirements. A batch task with an approved scheduling window has different constraints from a real-time user interaction.
The model sets a 100 ms service-latency threshold for latency-sensitive workloads, following International Telecommunication Union recommendations, with assumptions of 0.010 ms per km of fiber round-trip time, a route-inflation factor of 1.2, and 5 ms of processing delay (Section 2.3.4). It treats 10% of non-accelerated and 25% of accelerated server demand as fully flexible, and assumes ultra-low-latency workloads, 5% of computing demand, are never transferred (Section 2.3.2). Those are model parameters, not universal service standards or proof that a particular application will work.
The paper's sensitivity tests are useful here: a 10% change in the share of latency-tolerant workloads changes the delayed capacity by less than 1.8%, and tightening the threshold from 100 ms to 50 ms raises the remaining delayed share by only about 3%. Present latency tolerance, bandwidth needs, permitted destinations, and resilience requirements as screening gates. Avoid treating the framework as evidence that tightly synchronized distributed training can be spread across distant sites without performance penalties.
Copyable AI presentation prompt
Create one 16:9 cloud-architecture discussion slide distinguishing potentially flexible workloads from latency-sensitive services. Use two columns and a shared eligibility gate covering latency, bandwidth, approved destinations, and resilience. Identify 100 ms as the paper's modeled service threshold, not a universal SLA. Add a callout that synchronized distributed training needs separate engineering validation. Label workload examples and gates as proposed guidance. Cite the flexibility constraints in Section 2.3.2 and Section 2.3.4. Invent no workload shares, throughput gains, or migration success rates.
Scenario 4: Present carbon savings with the transfer cost included
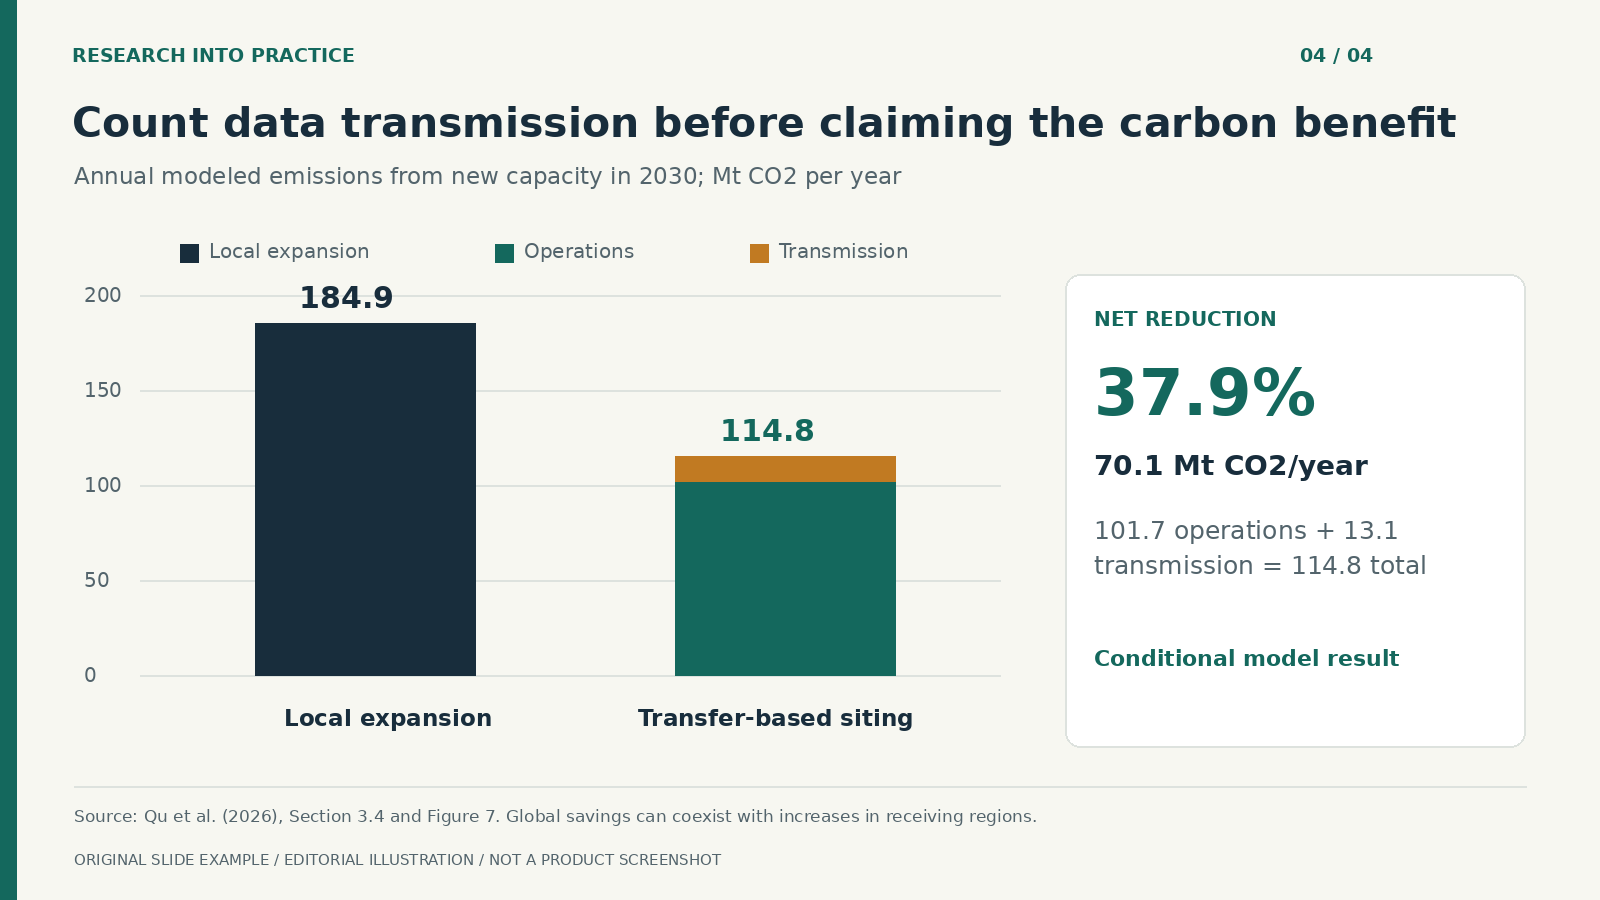
Section 3.4 and Figure 7: local expansion 184.9; receiving-site operations 101.7 plus data transmission 13.1; total 114.8 Mt CO2 per year.
A sustainability briefing should show the complete comparison. Use a zero-based stacked column for the transfer-based approach so the network emissions remain visible instead of disappearing behind a headline reduction.
The calculation is 184.9 minus 114.8, giving 70.1 Mt CO2 per year avoided in the modeled comparison. Dividing 70.1 by 184.9 gives approximately 37.9%, which matches the reduction the paper reports. Do not subtract transmission emissions twice.
Global improvement also does not imply improvement in every region. The largest corridor saving runs from the United States to Canada (−54.4 Mt per year), where the grid emission factor is more than 60% lower, but some corridors increase emissions, such as Europe to North Africa (+16.8 Mt). Keep cost optimization and carbon optimization distinct, and ask whether a proposed site still meets the organization's environmental objectives. For more on presenting climate and risk disclosures, see our guide to AI risk disclosure presentations.
Copyable AI presentation prompt
Create one 16:9 sustainability slide from Section 3.4 and Figure 7. Plot annual modeled emissions with a zero-based axis in Mt CO2/year. Local energy expansion is 184.9. Computation-transfer siting consists of 101.7 for receiving-site operations plus 13.1 for data transmission, totaling 114.8. Annotate the net reduction as 70.1, approximately 37.9%. Add a note that some receiving corridors increase emissions. Use green for operations and amber for transmission. Do not omit network emissions or present a whole-industry historical reduction.
Tailor the same evidence to each audience
| Audience | Their question | Lead with | Keep visible |
|---|---|---|---|
| Executives or board | Should we evaluate remote siting at all? | Infrastructure choice and construction-cost range | IT equipment excluded; modeled, not realized |
| Site-selection team | Which locations pass a full feasibility screen? | Five resource layers plus unpriced issues | No site ratings from the paper |
| Platform or cloud team | Which workloads could move? | Latency and flexibility gates | 100 ms is a model parameter |
| Sustainability team | Is the carbon benefit real after networking? | Stacked emissions with transmission | Some corridors increase emissions |
From research PDF to slides with Tosea AI
Upload the manuscript to Tosea AI, describe the audience, and request a storyline that separates research findings from proposed implementation steps. A six-page structure can cover the problem, framework, cost evidence, workload limits, emissions, and next decision. If you have not turned a paper into a deck before, our research paper to slides workflow walks through the PDF-to-PowerPoint process step by step.
One-click layout starts before rendering. During the outline stage, select a comparison layout for the executive choice, a table for site screening, a diagram for workload eligibility, and a data layout for emissions. You can continue modifying layouts and diagrams after the slides render. See the layout and diagrams documentation.
Use HTML mode when you need its consulting chart controls; the current documentation lists those charts in HTML mode and Layout and Diagram options in Image mode. For approved text, use Layout Only and inspect every figure label and qualification afterward. Confirm that chart values remain accurate when changing visual treatments; our business dashboard PowerPoint guide has a checklist for that step.
Before exporting an editable PPTX, review the construction-cost boundary, emissions components, delayed-capacity denominator, and model assumptions. The paper does not impose explicit fiber-capacity constraints in the main optimization, so aggregate network headroom must not be treated as proof of sufficient bandwidth on every corridor.
Q&A
Does this research mean every AI workload should move to a cheaper region?
No. The result depends on resource conditions, service latency, workload flexibility, connectivity, and model assumptions. Bandwidth bottlenecks, data rules, security, and resilience still need project-specific review. Use the research to frame a feasibility study, not to approve an automatic migration.
Can Tosea AI redesign my existing PowerPoint without changing the content?
Yes. Upload the PPTX or a PDF with Beautify PPT/PDF (available on Pro and above) and keep the default "Keep source pages" option, which preserves the page count, order, and content while redesigning the layout. Use Layout Only for later visual changes. Check that every label, footnote, and slide element remains complete.
How do I upload a PowerPoint and ask Tosea AI to redesign each slide?
Upload the PPTX or PDF with Beautify, keep the source pages, and choose a template or describe the visual direction. Inspect every slide before exporting the revised presentation.
Can I upload my own PowerPoint template to Tosea AI?
Yes, custom templates are available on eligible paid plans. The current workflow places the upload in the Image mode template picker. Confirm the required layouts, fonts, colors, logo placement, and master-slide rules before sharing the generated deck.
Can Tosea AI use custom brand colors, fonts, and a logo?
Yes. Specify colors and fonts and upload the logo or use a custom template where supported. Custom logo and template features require eligible plans. After export, verify font availability, color values, logo spacing, and contrast in PowerPoint.
Can Tosea AI match the style of my old company presentations?
A representative deck can provide design guidance; that does not imply permanent model training. Use an approved custom template for stronger consistency, then compare the generated presentation with your original brand guidelines before distribution.
Does Tosea AI preserve PowerPoint formatting after export?
Editable PPTX export aims to stay close to the generated preview while retaining editable elements. Results can vary with fonts, complex graphics, and presentation software. Test the file in the exact PowerPoint environment used for delivery.
Can I tell AI to edit the layout only and keep the exact wording?
Yes. Layout Only changes visual structure without intentionally rewriting content. After editing, compare the slide with the approved source to confirm that wording, labels, citations, footnotes, and line breaks remain correct.
Make the infrastructure argument clear enough to evaluate
Tosea AI helps research, infrastructure, and strategy teams turn technical PDFs into structured presentations with adjustable layouts and editable export options. Use it to communicate the evidence, assumptions, and next questions together, so an eye-catching headline leads to an informed discussion.
For related workflows, explore Tosea's guides to presenting the BIS findings on AI and population ageing, presenting AI classroom engagement research, and reconstructing slide images and PDFs as editable PowerPoint.
Sources
- Moving bits instead of watts: Accelerating global AI data-centre deployment at the energy-digital-water-land nexus — Jiawei Qu, Xiaoying Shi, Kai Hou, Hongjie Jia, and Jinyue Yan, arXiv preprint, October 26, 2026
- Full paper PDF — arXiv (Table 1 on p. 14; Figures 6–7 and Section 3.4 on pp. 20–22; limitations in Section 4, p. 23)
- Energy and AI — International Energy Agency, 2025
- Layout and diagrams and Beautify an existing PPT or PDF — Tosea AI Help Center