Array-Associated Reverse Transcriptases: Complete Guide to Claude's Discovery and Slides
What array-associated reverse transcriptases are, how Claude agents found them, what the evidence shows, and four scientific slide examples with reusable AI prompts.
Array-associated reverse transcriptases (ART) are a newly described family of phage-associated systems identified through an AI-agent genome-mining campaign at Anthropic. The 2026 report by Peter H. Yoon and colleagues connects a reverse transcriptase, an upstream repeat array, and a neighboring partner gene. Its significance lies in both the biological architecture and the discovery process: Claude agents noticed unusual features in raw DNA and pursued them beyond the original search criteria. This guide explains the findings, reconciles the announcement's rounded figures with the paper, and turns the research into four presentation scenarios with example slides and reusable prompts.
What the technical report says
The 40-page technical report, Autonomous AI agents discover reverse transcriptases with tandem repeat arrays, lists six authors affiliated with Anthropic. Anthropic announced the work on September 23, 2026 and links to the preprint. Treat it as an early research report, rather than established evidence of a working genome-editing technology.
Reverse transcriptases generally copy RNA into DNA. The researchers asked Claude agents, running on Claude Mythos 5, to search for unusual RT systems through new associations with partner genes. The campaign used a coordinated harness in which worker agents planned and executed tasks, supervisors reviewed results, and shared records supported follow-up investigations.
The numbers worth preserving in a presentation
| Reported metric | Value | Location in the report |
|---|---|---|
| Search database | 1.94 billion protein clusters | Figure 1B |
| RT clusters after filtering | 198,290 | Figure 1B |
| Candidate partner families investigated | 17 (16 met the agents' selection criteria; 1 was promoted from a follow-up task) | Results, p. 3 |
| Previously unreported RT associations retained | 3; 14 rejected or set aside | Results, p. 3 |
| Campaign execution | 119 tasks; 949 agent sessions | Results, p. 3 |
| Computational effort | 77 agent-hours; 21.5 elapsed hours | Results, p. 3 |
| Token accounting | 215.6 million tokens | Results, p. 3; Methods, p. 30 |
| ART family survey | 95 distinct RT clusters; 28 detectable upstream arrays | Results, p. 6 |
Counts use different units. Seventeen partner families are not seventeen validated enzymes. Agent sessions are not necessarily independent agents. Aggregate agent-hours can exceed elapsed time because work runs concurrently. The token total includes uncached input, output, and cache-write tokens; cache-read tokens were excluded.
Announcement figures versus paper figures
Anthropic's announcement rounds several figures and groups some stages differently. Both versions are consistent, but they answer slightly different questions:
| Announcement wording | Paper value | What to note on a slide |
|---|---|---|
| "roughly 950 agents" | 949 agent sessions | Sessions, not 949 independent agents |
| "210 million tokens" | 215.6 million tokens | Cache-read tokens excluded |
| "21 hours" | 21.5 hours elapsed; 77 agent-hours | Work ran concurrently |
| "over 200,000 RTs" | 198,290 RT clusters | Clusters, not individual sequences |
| "3,500 new candidate systems" | 3,564 protein families scored as candidate partners | Scored, not validated |
| "the 20 most compelling candidates" | 17 candidate partner families plus 3 flagged new RT lineages | ART came from a flagged lineage |
The last row matters most. ART was not one of the three retained partner-gene associations. It came from a worker that flagged an unusual RT lineage and read the DNA upstream of it. A keynote slide can use the rounded figures with a footnote; a journal-club or lab-meeting slide should use the paper's values and units.
What makes the ART architecture interesting
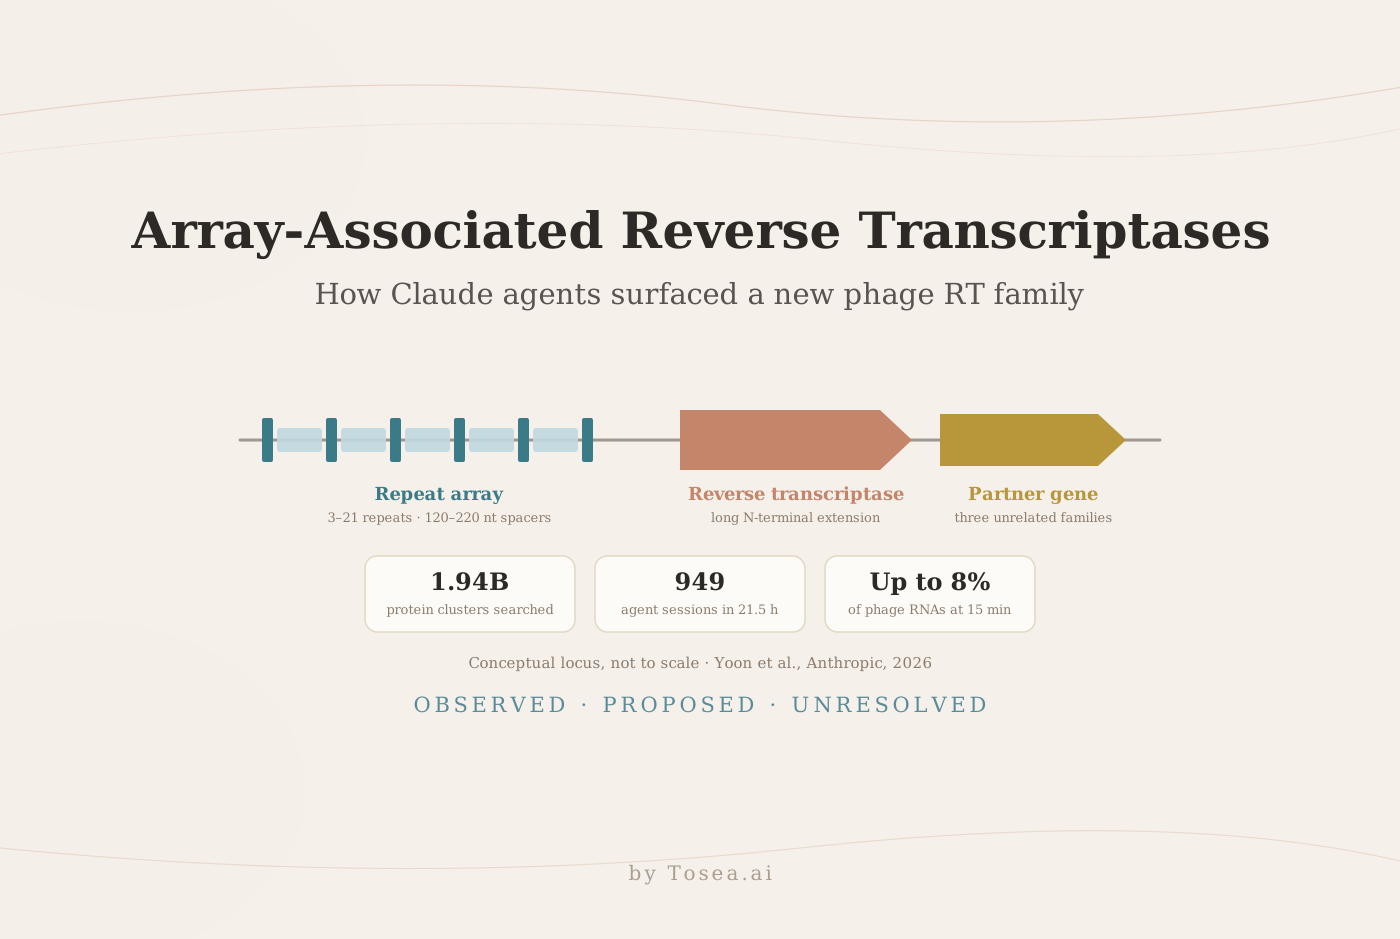
ART systems occur in cultured jumbo phages and predicted viral contigs. Detectable arrays span 0.3–4.1 kilobases and contain 3–21 short repeat copies. Repeats are 15–49 nucleotides long, while intervening spacers measure 120–220 nucleotides. The RT proteins carry an unusually long N-terminal extension of about 180 residues ahead of the polymerase domain, where other RTs typically carry about 50 or fewer. The polymerase domain keeps the catalytic YxDD motif in all 93 members whose sequences span it.
The authors identify three unrelated partner families that occur almost exclusively beside ART RTs. Type I, found at 59 of 95 loci, encodes a protein of about 600 residues with two GNAT-like folds. Type II, confined to the Staphylococcus phage clade, encodes an all-helical protein of about 270 residues. Type III encodes a smaller helical protein of about 170 residues. Structure predictions for Type I and II pairs place an interface between the RT's N-terminal extension and the partner, but only with moderate confidence (ipTM about 0.6).
The arrays resemble CRISPR arrays visually, but important differences matter. ART spacers are longer, are conserved between related phages, and have different sequence organization. The authors report no nearby cas genes. Similarity of architecture therefore motivates research; it does not establish CRISPR function or programmability.
RNA sequencing provides a stronger biological anchor. In a published SA1 phage infection dataset, array-derived RNAs accounted for up to 8% of phage RNAs at 15 minutes after infection. Separate expression experiments in E. coli also produced discrete short array-derived RNAs. The infection dataset is identified as NCBI BioProject PRJNA836150.
The authors propose that ART could work with a repertoire of distinct RNAs, potentially in a retron-like arrangement. However, the Discussion explicitly leaves RT enzymatic activity, RNA substrate identity, RT–partner interaction, and physiological function unresolved. Those distinctions should survive every summary slide.
Why the model mattered: reruns and benchmarks
The paper also asks whether the discovery was repeatable and which capabilities it depended on. The answers deserve a slide of their own, because they complicate the simplest version of the story.
The team ran the same campaign ten more times. Nearly every run sampled ART loci, and two runs investigated the lineage as a follow-up. None read the DNA upstream of the RT, and the array was missed in every rerun. The authors attribute this to the broad RT search space and the non-deterministic behavior of the harness.
They then built fixed-input benchmarks in which a model received ART sequences and a judge model scored its report against ten curated features. Four models (Opus 5.5, Mythos 5.1, Mythos 5, and Opus 5) separated clearly from three others (Opus 4.6, Opus 4.8, and Sonnet 5). With the loci placed directly in context, the most capable models described the array in at least 90% of attempts. With files and tools, performance fell to as low as 32%. In 39% of file-based attempts, the models never read a contiguous stretch of 200 nucleotides, so they never saw more than about one repeat unit. As more DNA was read into context, array recognition rose from 29% to as high as 76% for the four models pooled, and to 96% for Mythos 5.
Finally, the authors traced two internal Mythos 5 signals that respond to the repeat as the sequence is read, comparable to how the genomic language models Evo 2 and gLM2 flag the same repeats. A fair presentation summary is: one campaign found the array because an agent read the raw DNA; reruns did not reproduce the find; controlled benchmarks show that reading the sequence directly makes recognition far more likely. For background on one of the models tested, see our Claude Opus 5.5 complete guide.
Four scientific presentation scenarios
These editorial slide illustrations use values from the paper. They are simplified layouts, not Tosea AI screenshots. Proposed research priorities are recommendations, not reported experiments.
1. Journal club: explain the discovery campaign
For a journal club, present search scale, filtered RT collection, candidate review, and campaign effort separately. A large database does not imply many validated discoveries.
Ask what the agents contributed beyond a predefined pipeline. Here, the repeat array was outside the original emphasis on protein-coding partner genes. The paper also notes (Discussion, p. 14) that an earlier MarsHill genome report had identified the RT and proposed an upstream non-coding RNA, but did not describe the repeat array or partner gene. Novelty belongs to the fuller system characterization.
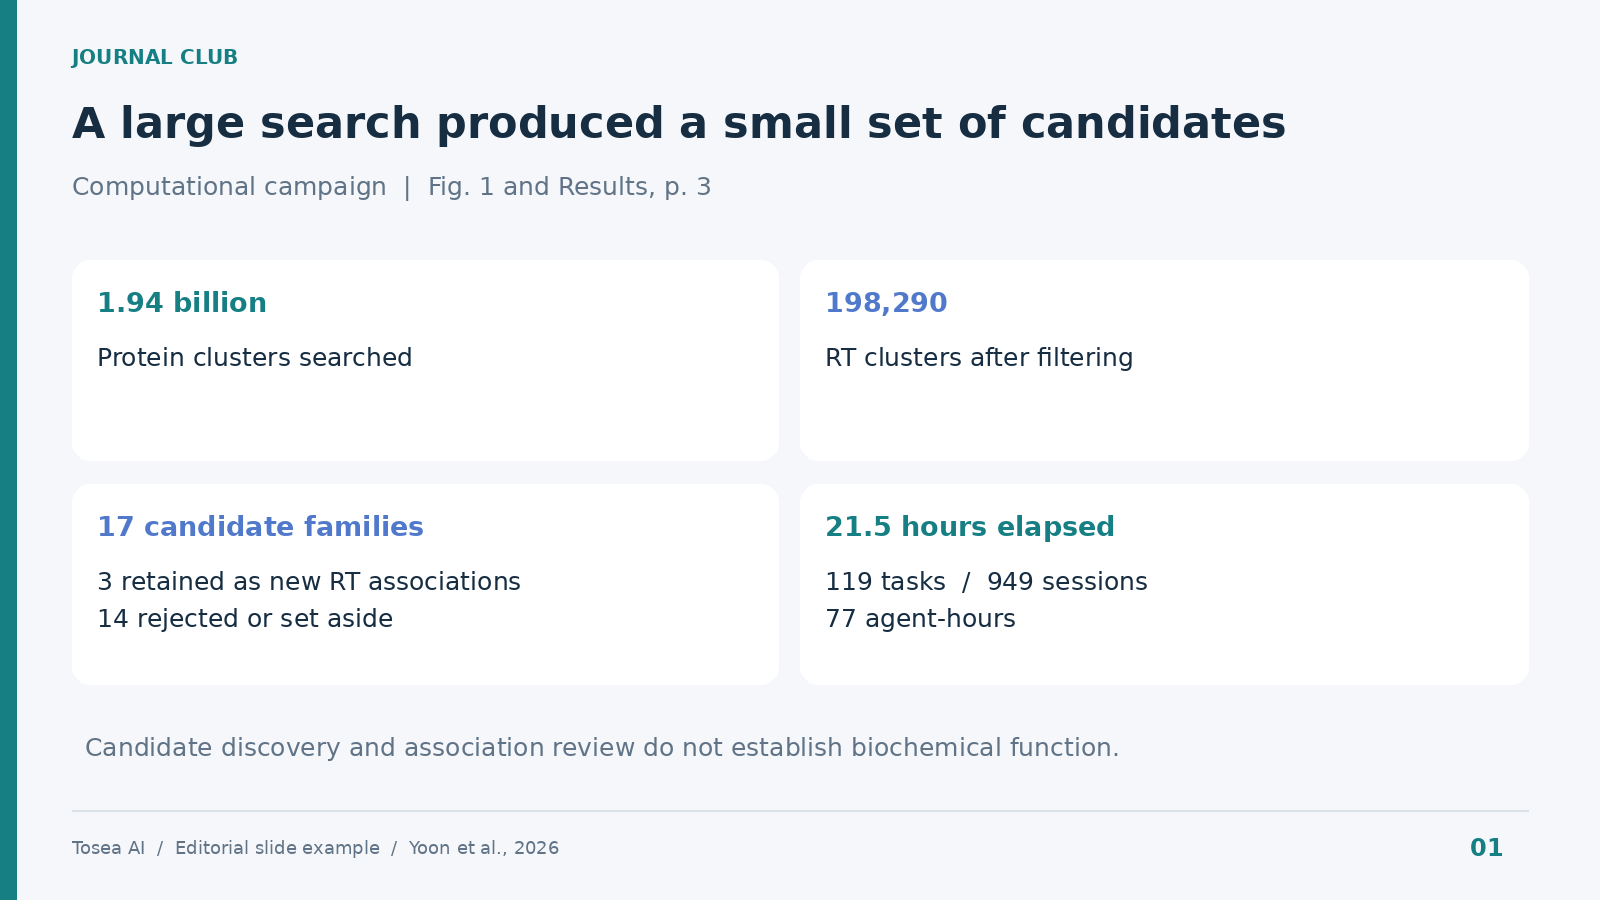
Example slide: Figure 1 and Results, page 3. The three retained associations are computational findings, not demonstrations of enzyme function.
Reusable AI prompt:
Using the uploaded Yoon et al. report, create a journal-club slide explaining the discovery campaign. Show 1.94 billion protein clusters searched, 198,290 RT clusters after filtering, 17 candidate partner families, and 3 retained new associations. Add 119 tasks, 949 sessions, 77 agent-hours, and 21.5 elapsed hours. Keep these units distinct. Cite Figure 1 and page 3. Explain the repeat-array observation without claiming biochemical validation.
2. Teaching presentation: show architecture without inventing mechanism
For students or a multidisciplinary audience, a locus schematic is easier to understand than a dense structural panel. Place the upstream array, RT gene, and downstream partner gene in their reported order. Explain that a genomic association describes where components occur; it does not prove how their products interact.
Label the diagram not to scale. When comparing ART with CRISPR, include spacer differences and the missing cas association. Distinguish predicted structures from solved structures.
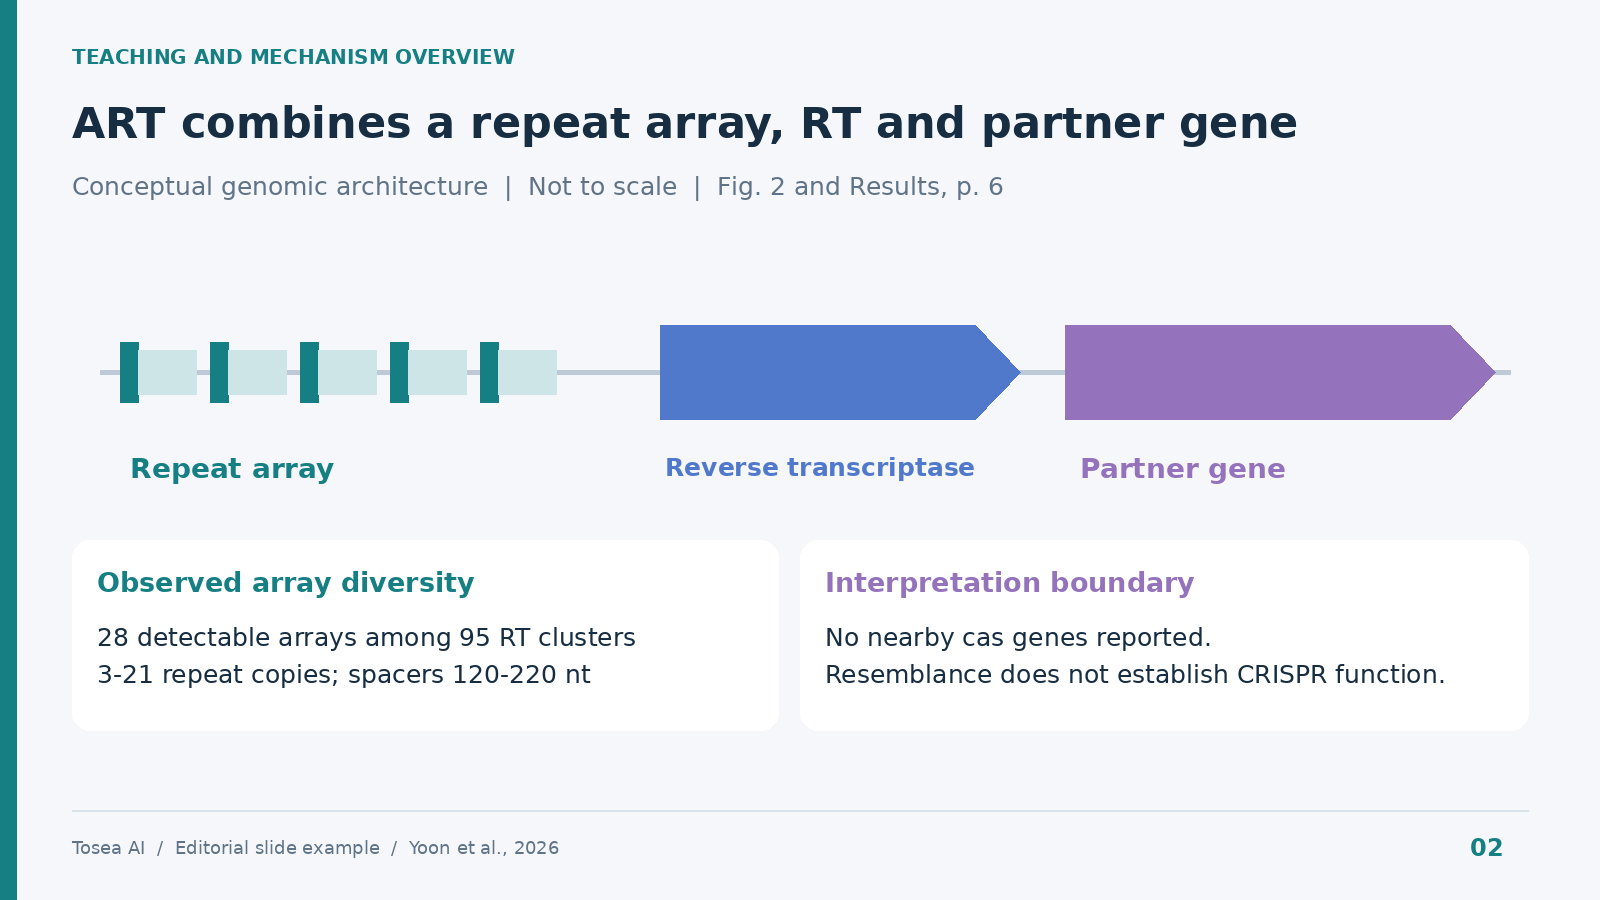
Example slide: conceptual locus organization based on Figure 2 and Results, page 6. It is not a validated reaction pathway.
Reusable AI prompt:
Create an educational slide illustrating ART genomic architecture from the uploaded paper. Show an upstream non-coding repeat array, the reverse transcriptase gene, and a downstream partner gene. Distinguish repeats from spacers and label the schematic not to scale. Include 28 detectable arrays among 95 RT clusters, 3-21 repeat copies, and 120-220 nucleotide spacers. Cite Figure 2 and page 6. Do not depict DNA editing or confirmed molecular interactions.
3. Lab meeting: separate RNA evidence from functional claims
A lab meeting needs the experiment, measurement, and interpretation on the same page. The SA1 infection analysis shows abundant array transcripts and reproducible shorter RNA species. The independent expression work supports the observation that array-derived short RNAs can form outside the infection context.
The 8% figure needs its denominator and time point: a share of phage RNAs at 15 minutes after infection. It is not editing efficiency, a share of infected cells, or a therapeutic response. Use original RNA-seq panels to discuss transcript boundaries and replicate behavior.
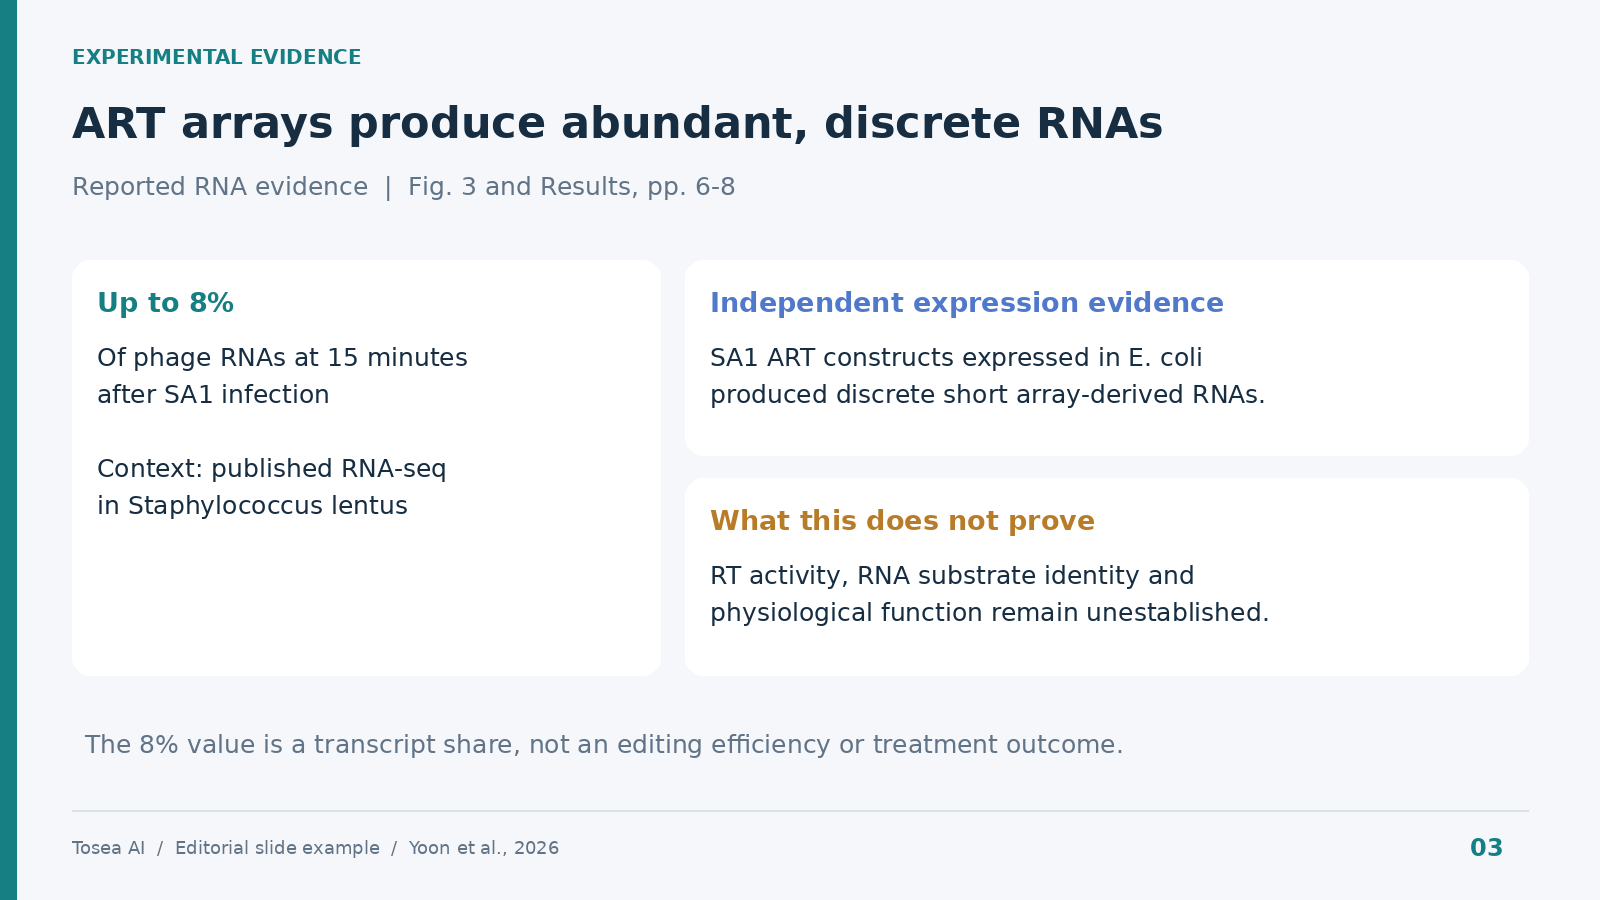
Example slide: Figure 3 and Results, pages 6–8. No new time-course values or error bars have been invented.
Reusable AI prompt:
Build a results slide from Figure 3 and the accompanying text. Highlight that SA1 array-derived RNAs account for up to 8% of phage RNAs at 15 minutes after infection. Separately summarize discrete short RNAs observed after expression of SA1 ART constructs in E. coli. Identify the experimental contexts and cite pages 6-8. State that RNA expression does not demonstrate RT activity or editing. Preserve original labels if using source panels.
4. Biotech research review: define the next evidence milestone
For an R&D review, organize the finding by evidence status: observed, proposed, and unresolved. This helps decision-makers assess the next research milestone.
The observed architecture and RNA expression justify further characterization. Retron-like complexes, a predicted RT–partner interface, and multiple RNA templates or baits remain proposed explanations. Before discussing genome-editing applications, the system needs evidence of enzymatic activity, relevant substrates, confirmed interactions, and biological function. Treat these as research milestones and avoid unsupported commercial or clinical claims.
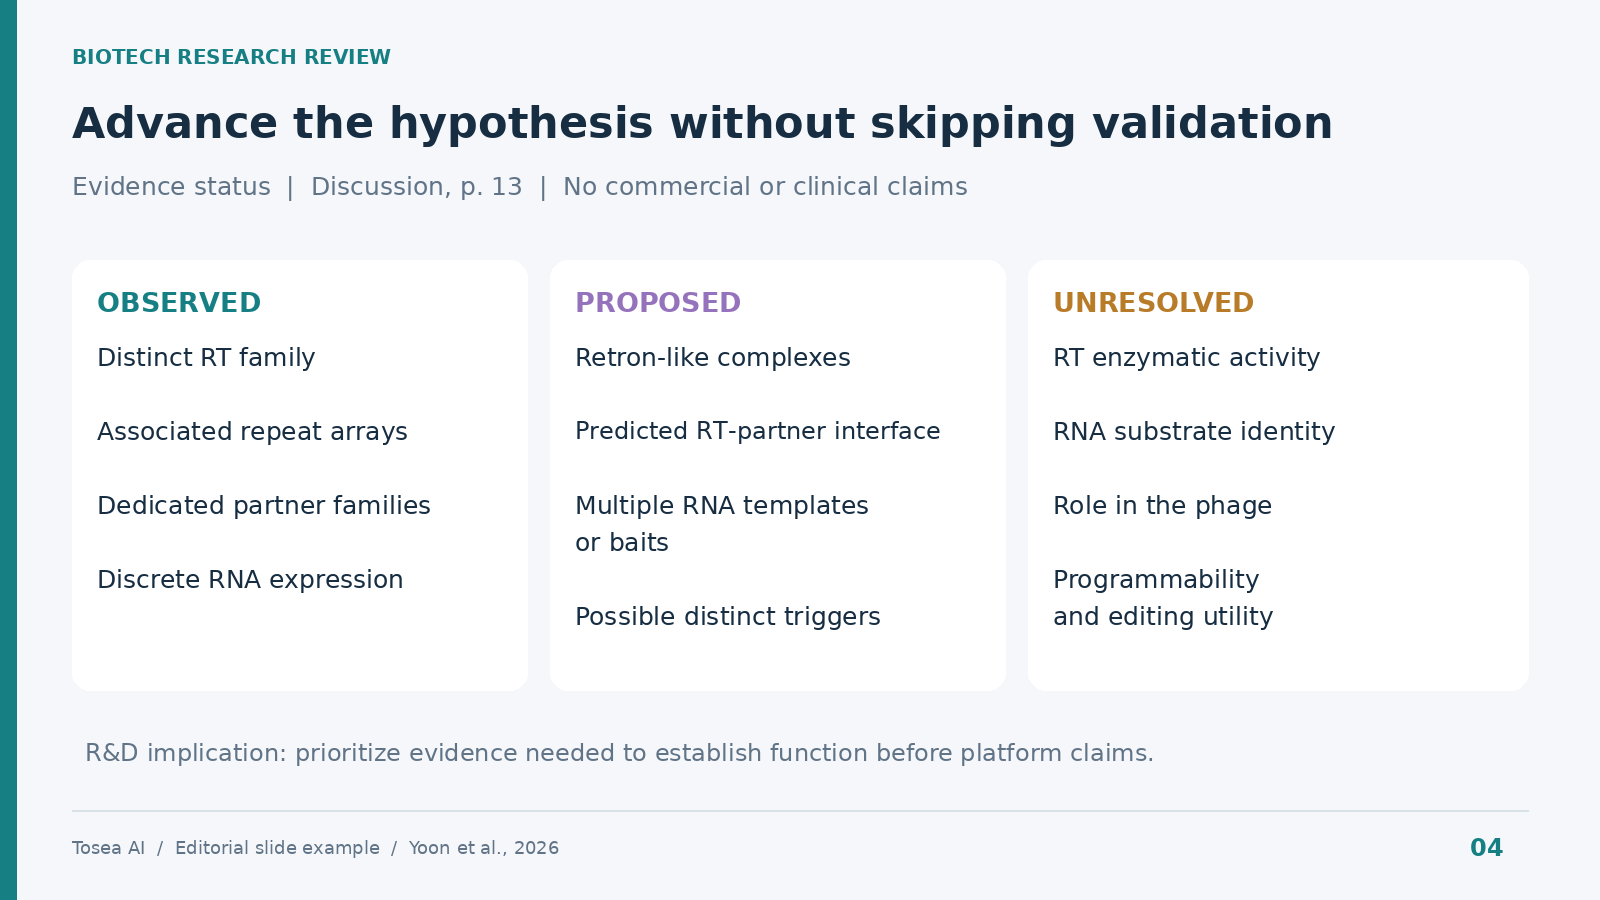
Example slide: evidence boundaries from the Discussion, page 13. Research priorities are editorial recommendations.
Reusable AI prompt:
Create an R&D review slide with three columns: observed, proposed, and unresolved. Place the distinct ART family, associated arrays, partner families, and RNA expression under observed. Place retron-like complexes, the predicted RT-partner interface, and multiple RNA templates or baits under proposed. Place RT activity, substrate identity, confirmed interaction, biological role, and editing utility under unresolved. Cite the Discussion on page 13. End with a research decision without asserting a working gene-editing platform.
Use Tosea AI to structure and lay out the presentation
Upload the paper to Tosea AI and define the audience, talk length, and desired level of detail. Ask for an evidence-led outline and retention of figure references, units, and limitations. Review extracted images before selecting the panels that support each conclusion. Our research paper to slides workflow covers the same process for a typical 30-page paper.
Tosea AI supports one-click layout and diagram choices during outlining and after rendering. At the outline stage, choose a comparison, component diagram, results layout, or evidence matrix. After rendering, continue changing layouts or diagrams to improve readability.
Use Layout Only when approved wording should remain intact. Compare the revised page with the source, including citations and qualifiers. Export the editable PPTX and verify the final file in PowerPoint. Presentation generation organizes the paper; it does not reproduce the genome-mining campaign or validate the biological mechanism. For a checklist on keeping every number traceable to its source, see our guide to zero-hallucination AI slides.
Frequently asked questions
Is ART a new CRISPR gene-editing tool?
The paper does not establish that. ART has repeat arrays resembling CRISPR, but its function and editing utility remain unknown. No nearby cas genes were reported.
Did AI complete the entire discovery without humans?
The computational campaign ran without human intervention after its setup. Scientists defined the research brief, reviewed findings, performed follow-up work, and conducted laboratory experiments.
Which Claude model ran the discovery campaign?
The original campaign ran on Claude Mythos 5. In the paper's follow-up benchmarks, Opus 5.5, Mythos 5.1, Mythos 5, and Opus 5 performed clearly better than Opus 4.6, Opus 4.8, and Sonnet 5 at describing the ART system.
Can Tosea AI redesign my existing PowerPoint without changing the content?
Yes. Export the PowerPoint as a PDF, upload it to Tosea AI, and request a redesign that keeps the original wording. Use Layout Only to refresh visual structure. Review every label, footnote, and slide element for completeness.
How do I upload a PowerPoint and ask Tosea AI to redesign each slide?
First export the PowerPoint as a PDF. Upload it and request preservation of content and sequence. Choose a template or describe the visual direction, generate the deck, and inspect each slide before exporting.
Can I upload my own PowerPoint template to Tosea AI?
Tosea AI supports custom templates on eligible paid plans. Follow the supported workflow, then verify required layouts, fonts, colors, logo placement, and master-slide requirements in the resulting presentation.
Can Tosea AI use custom brand colors, fonts, and a logo?
Yes. Specify required colors and fonts and provide the logo, or use a supported custom template. Custom logo and template features depend on plan eligibility. Verify fonts, color values, logo spacing, and contrast after export.
Can Tosea AI match the style of my old company presentations?
A representative deck can provide design guidance, without implying permanent model training. For stronger consistency, use an approved custom template and compare the result with company brand guidelines.
Does Tosea AI preserve PowerPoint formatting after export?
Editable PPTX export is designed to remain close to the generated preview. Fonts, complex graphics, and the application used to open the file can affect results. Test the deck in the delivery environment.
Can I tell AI to edit the layout only and keep the exact wording?
Yes. Layout Only changes visual structure without intentionally rewriting content. Compare the result with the approved source to verify labels, citations, footnotes, technical notation, and line breaks.
Turn emerging research into clear scientific slides
Array-associated reverse transcriptases offer a useful case study in AI-assisted discovery and careful scientific communication. Tosea AI helps transform the paper into a reviewable outline, refine layouts and diagrams, and export an editable presentation while keeping the evidence available for inspection.
Continue with How to Turn a Research Paper into a Presentation, Best Free AI Tool for Science Presentation in 2026, and Best AI Tool for Technical Presentations in 2026 for related guidance on figures, citations, layouts, and export review.
Sources
- Claude discovers a novel enzyme system with CRISPR-like repeats — Anthropic, September 23, 2026
- Autonomous AI agents discover reverse transcriptases with tandem repeat arrays — Yoon et al., Anthropic technical report, 2026
- BioProject PRJNA836150 — NCBI (SA1 phage infection RNA-seq dataset used in the report)