AI and Population Ageing: How to Present the BIS Findings in 4 Slides
What BIS Bulletin 135 finds on AI and population ageing, how its ageing-automation overlap index works, and four slide examples with reusable AI prompts.
AI and population ageing are increasingly part of the same strategic conversation: can technology sustain output when experienced workers retire and recruitment becomes harder? A September 2026 bulletin from the Bank for International Settlements (BIS) offers a conditional answer. Automation may help, but its usefulness depends on whether the industries losing workers are also industries where AI and robots can perform relevant tasks. This guide explains the research, shows where its index is favorable and where it is not, and turns the findings into four presentation scenarios, each with a slide illustration and a reusable AI prompt.
What the BIS research actually finds
Old workers, young machines: can AI and automation offset population ageing?, by Iñaki Aldasoro, Sebastian Doerr and Daniel Rees, was published on September 24, 2026 as BIS Bulletin No. 135. The eight-page publication includes six numbered research pages. Its authors combine workforce demographics for 135 economies with industry exposure measures for AI and industrial robots.
Their central insight is a mismatch. Agriculture and health employ substantial numbers of older workers, yet many of their tasks are difficult to automate. Manufacturing and finance have higher automation exposure, but generally younger workforces. A country can therefore lead in technology adoption while still facing shortages in the industries most affected by ageing.
The following figures come directly from the bulletin:
| Indicator | Reported finding | Location in the bulletin |
|---|---|---|
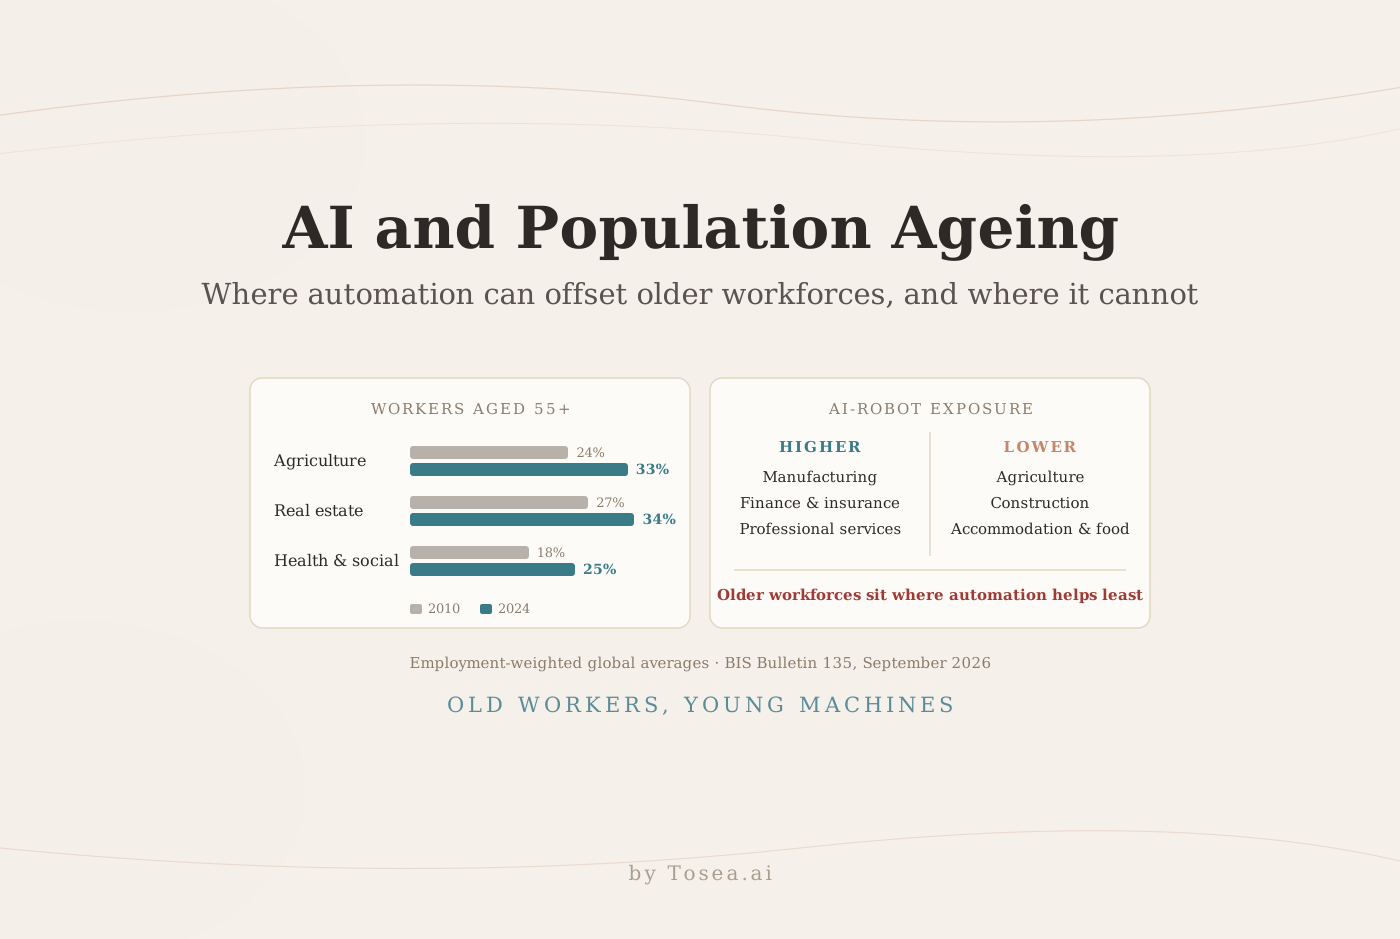
| Agriculture workers aged 55+ | 24% in 2010; 33% in 2024 | Printed p. 2 |
| Real estate workers aged 55+ | 27% in 2010; 34% in 2024 | Printed p. 2 |
| Health and social work workers aged 55+ | 18% in 2010; 25% in 2024 | Printed p. 2 |
| Advanced-economy population aged 65+ | Over 20% currently; projected 28% by 2050 | Printed p. 2 |
| Agriculture employment | Largest global employer, over 700 million workers | Printed p. 2 |
| Overlap vs. log GDP per capita | Correlation 0.14; 0.36 excluding sub-Saharan Africa | Printed p. 4 |
| Ageing-automation overlap trend | Declined in over half of sampled economies; median change −0.09 | Printed p. 4 |
The sector figures are employment-weighted global averages across jurisdictions. They do not describe every country, employer, or occupation. The change from 24% to 33% is nine percentage points. The population projection uses a 65+ threshold, while the workforce measure uses 55+; a presentation should keep those definitions separate.
What the index means, and what it cannot establish
The researchers build the technology side from two established measures. AI exposure comes from the AI Industry Exposure index of Felten et al. (2021), which matches AI capabilities to the task and ability content of occupations. Robot exposure comes from the industry-level robot density data of Acemoglu and Restrepo (2020). The authors standardize both measures across industries and average them with equal weights.
They then calculate an economy-level employment-weighted covariance between industry age shares and composite exposure. A higher ageing-automation overlap means older workers are more concentrated in industries amenable to automation. Because ageing concentrated in automatable sectors could partly reflect past displacement of younger workers, the authors also net out each economy's overall 55+ share.
This is an alignment indicator. It is not the percentage of jobs AI can replace, a prediction of retirement dates, or a measured productivity gain. Exposure can indicate support for workers as well as substitution. The analysis also uses existing technology measures and employment structures, which may change.
The bulletin draws on UN World Population Prospects 2024 and ILOSTAT, alongside the AI-exposure and robot-adoption research above. The BIS publication page provides an online annex and underlying data for readers who want to examine the method. The views are those of the authors and do not necessarily represent the BIS.
Where the overlap is favorable, and where it is not
The bulletin maps the index across economies. It is highest in North America, parts of northern and western Europe, and Australia, and some Gulf economies also score relatively well. It is low across much of southern and Southeast Asia and in parts of the Balkans and Caucasus. Most of Latin America and sub-Saharan Africa sits in the middle or lower part of the distribution.
Two sectors drive most of the variation. Agriculture has a low overlap score, employs about a fifth of workers on average, and has a much older workforce than the national average almost everywhere. Manufacturing is highly exposed but typically young, so its automation potential does little to relieve ageing pressure.
Income helps, but only modestly. The correlation between the overlap and log GDP per capita is 0.14, rising to 0.36 when the comparatively young economies of sub-Saharan Africa are excluded. Several fast-ageing advanced economies, including several Asian economies, have some of the most adverse overlaps. In East and Southeast Asia, rapid projected ageing coincides with low overlap, mostly because of large and young manufacturing sectors. As the authors put it, being a global leader in AI or robot adoption does not necessarily mean an economy is well placed to automate an ageing workforce.
The trend adds pressure. Compared with its 2010–2013 average, the overlap declined in over half of the sampled economies.
For a presentation, these regional patterns are safe to describe in words. Country rankings should come from the annex tables and the published dataset, not from reading colors off a map. Our guide to presenting market performance to executives covers how to keep that kind of cross-market comparison readable.
Four ways to turn the research into a useful presentation
The illustrations below are editorial examples created for this guide, not screenshots of a tested Tosea AI output. Reported numbers are attributed to the bulletin. Decision frameworks and proposed actions are clearly identified as applications of the research.
1. Policy briefing: locate the ageing pressure
A policy audience needs to understand where labor supply may tighten before discussing technology subsidies or migration. A paired-bar comparison makes uneven sector ageing visible without inventing national rankings. Agriculture increased by nine percentage points, while real estate and health and social work each increased by seven.
The policy implication is conditional: where ageing and automation align, adoption barriers deserve attention. Where they do not, participation, mobility, training, and immigration may become more important. The bulletin adds two complications: economies with a worse overlap tend to have a lower migrant stock, and labor mobility is only weakly correlated with the overlap. These options come from the bulletin; the right mix still requires local evidence.
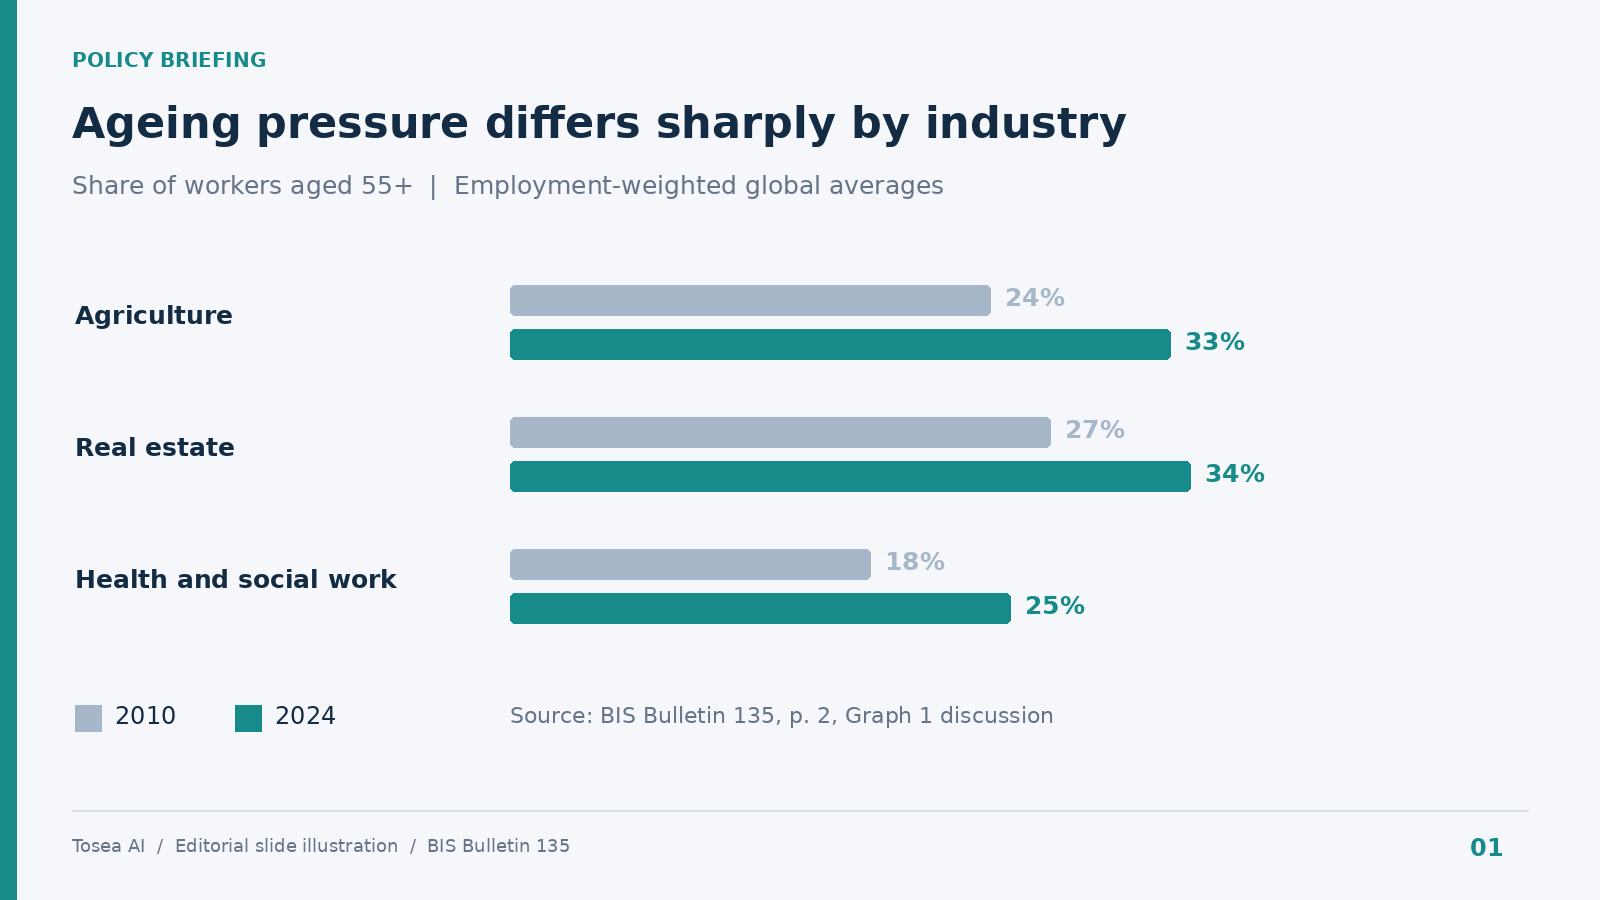
Slide example: employment-weighted global averages from printed page 2. These figures describe workforce age composition, not retirement probabilities.
Reusable AI prompt:
Using the uploaded BIS Bulletin 135, create a policy briefing slide comparing workers aged 55+ in 2010 and 2024: agriculture 24% and 33%, real estate 27% and 34%, health and social work 18% and 25%. Use paired horizontal bars, label percentages and years, and cite printed page 2. State that these are employment-weighted global averages. Add a conditional policy takeaway without inventing country rankings or causal effects.
2. Workforce planning: identify tasks that still need people
An employer needs a more granular answer than a national index provides. Which roles have succession risk? Which tasks could be assisted? Which responsibilities require direct human involvement?
Health and social work illustrates the challenge: the workforce is ageing while demand for care increases. A company presentation can use this finding to motivate task assessment, retention, and training. Documentation or scheduling assistance can be proposed for investigation, but the bulletin does not establish savings from those specific applications. Add internal age profiles, vacancies, workload data, and pilot results before making staffing decisions. For measuring those pilots once they run, see How to Build an AI Productivity Presentation.
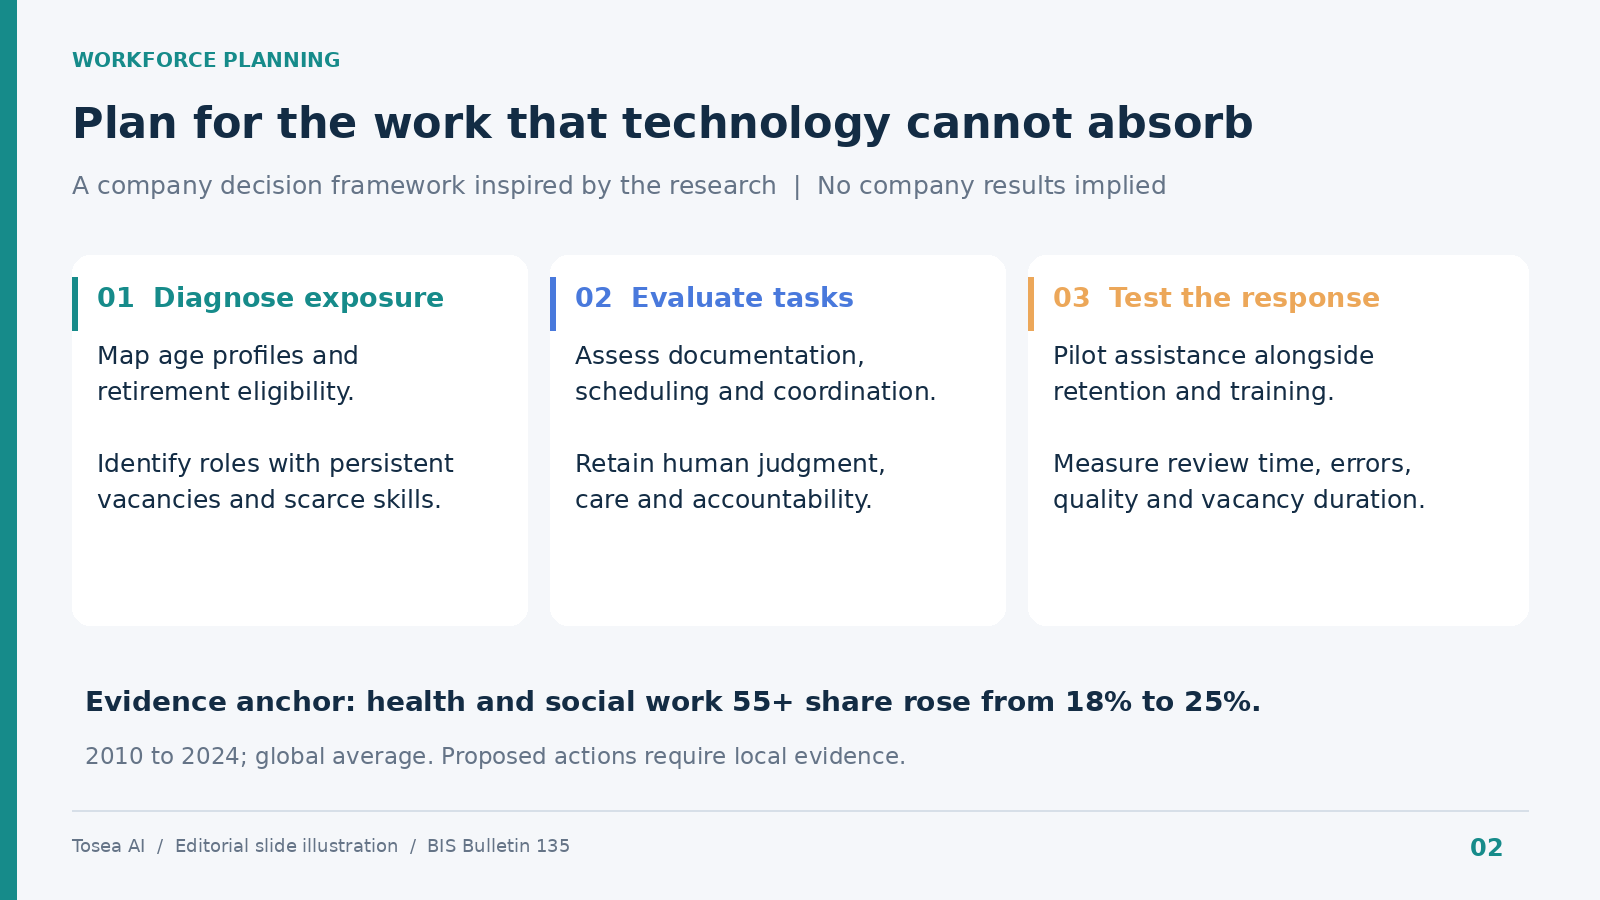
Slide example: an illustrative company framework. Suggested pilots and metrics are editorial recommendations, not BIS-tested interventions.
Reusable AI prompt:
Create a workforce planning slide using the uploaded bulletin and any internal workforce files supplied. Show three stages: diagnose age and vacancy exposure, assess tasks for assistance, and test interventions. Use the health and social work finding as context. Propose retention, training, and task-level pilots while separating suggestions from measured results. If company data is missing, list required inputs. Include review time, error rates, service quality, and vacancy duration as proposed metrics.
3. Market opportunity: distinguish exposure from customer demand
A strategy team can use the paper to screen sectors for further research. Manufacturing, finance and insurance, and professional and technical services rank highest on the composite exposure measure. Agriculture, construction, and accommodation and food services rank lowest.
Those classifications do not establish market size or commercial attractiveness. High exposure may coexist with integration costs and weak customer demand. Low exposure may leave room for narrow tools that support coordination or administration. A useful opportunity slide pairs the research with customer interviews, workflow volumes, buying constraints, and implementation economics. Avoid converting a relative index into a revenue forecast.
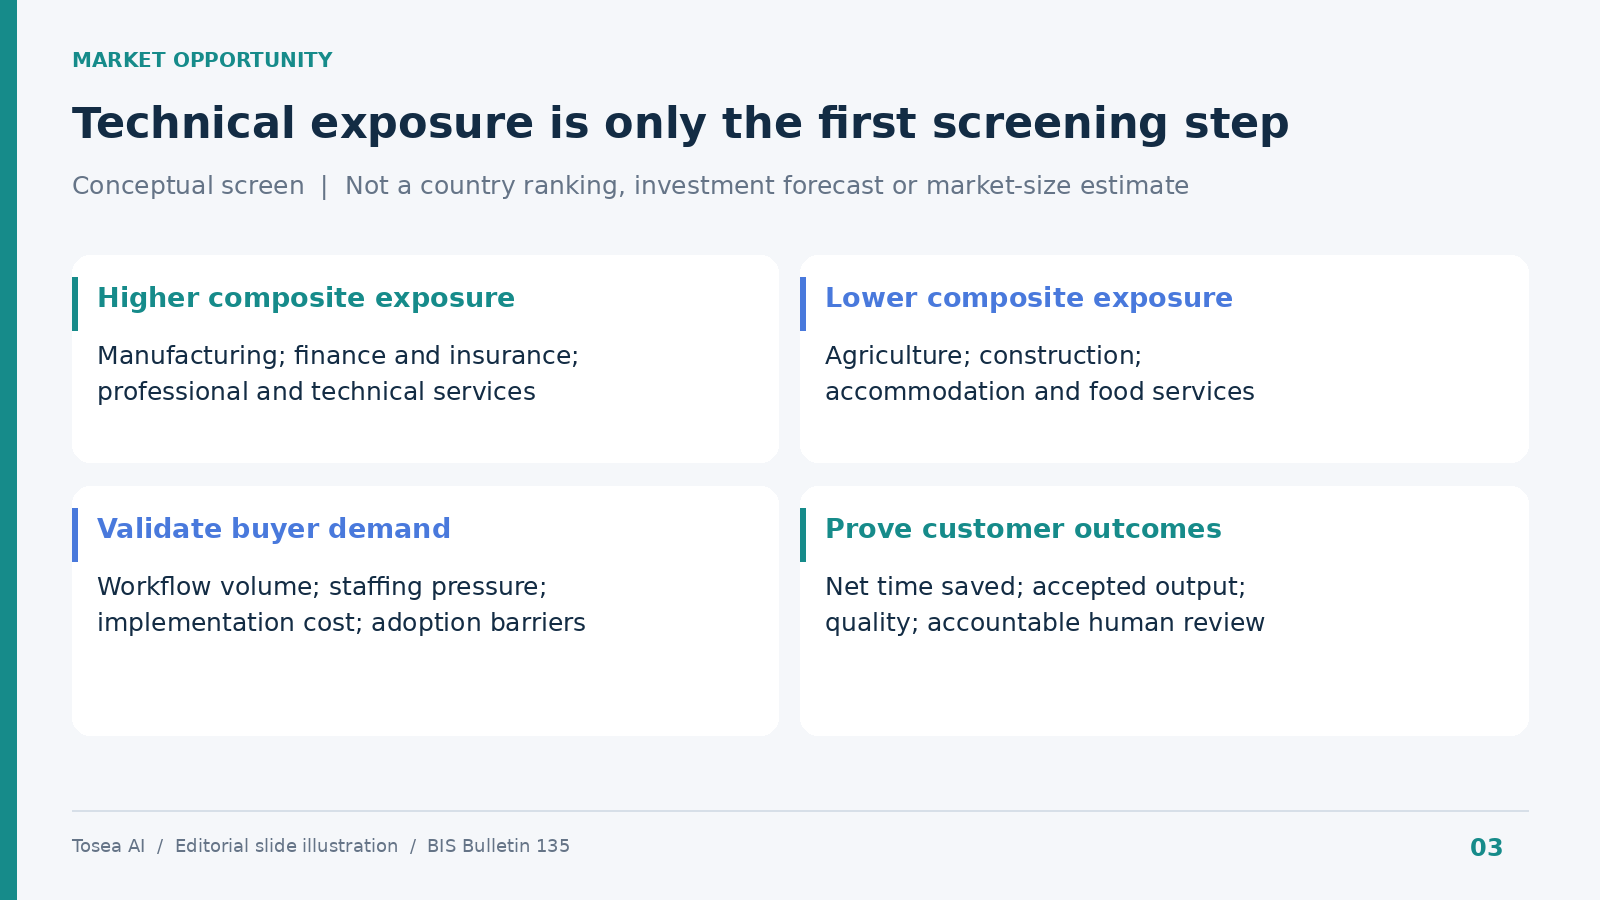
Slide example: a conceptual screening framework. Sector groupings follow printed pages 3–4; commercial validation criteria are editorial additions.
Reusable AI prompt:
Build a market opportunity slide grounded in BIS Bulletin 135. Separate sectors with higher composite AI-robot exposure from those with lower exposure, using the paper's classifications. Add a validation panel for customer demand, workflow volume, deployment cost, and adoption barriers. Explain that exposure does not establish market size or revenue potential. Label all commercial recommendations as hypotheses and include no unsupported TAM, ROI, or growth forecast.
4. Research presentation: explain the method before the conclusion
For a seminar or research review, the most valuable slide often explains how the index is constructed. Show technology inputs, workforce inputs, the aggregation step, and the interpretation boundary. This lets the audience evaluate what the result supports.
Use the accompanying dataset for exact country values rather than estimating them from a chart. Treat alternative technology weights and worker mobility as questions for further research.
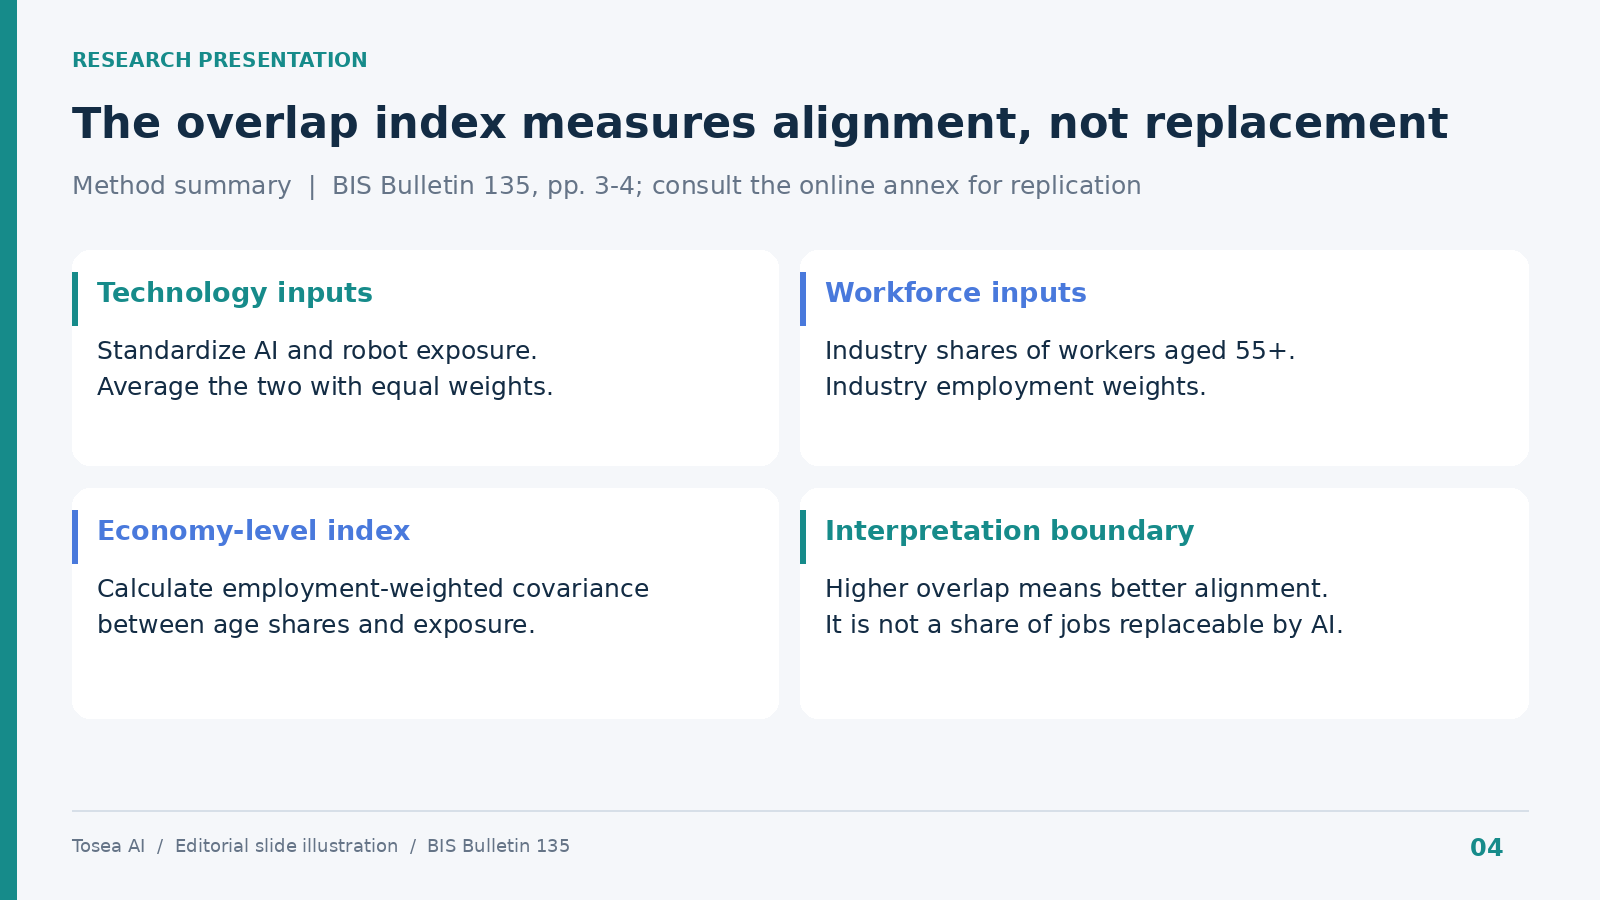
Slide example: a method summary based on printed pages 3–4. Consult the online annex for full definitions and replication details.
Reusable AI prompt:
Create a research-method slide from the uploaded bulletin. Explain standardized AI and robot exposure, their equally weighted composite, industry shares of workers aged 55+, and employment weights. Describe the overlap index as employment-weighted covariance. State that higher overlap indicates better alignment, not a replaceable-job percentage. Cite printed pages 3–4 and identify the online annex as necessary for replication. Separate methodological limitations from proposed sensitivity tests.
Build and refine the deck with Tosea AI
Upload the bulletin to Tosea AI, specify the audience and decision objective, and ask for a source-grounded outline. Keep findings, interpretations, and recommendations visibly distinct. Provide spreadsheets when exact values are needed beyond the figures explicitly reported in the text. If you are starting from the PDF alone, our PDF to PowerPoint guide explains what the conversion step preserves.
Tosea AI supports one-click layout choices at two stages. During outline creation, select a layout or diagram for each section before rendering: a comparison for sector data, cards for workforce actions, or a method diagram for research inputs. After slides are rendered, continue changing the layout or diagram to improve hierarchy and readability.
Use Layout Only when wording has already been approved. Inspect the revised slide for retained labels, footnotes, units, and citations. One-click layout accelerates visual restructuring; source checking remains part of the workflow. Before sharing an editable PPTX, open it in the delivery environment and check charts, fonts, and slide order.
Frequently asked questions
Can AI and automation fully offset population ageing?
The bulletin does not establish that they can. Their usefulness depends on industry age profiles, task exposure, employment shares, and adoption conditions. Technology can still improve productivity where demographic alignment is weak.
Can I use the overlap index to forecast job losses?
No. It measures alignment between workforce ageing and industry exposure. It does not estimate layoffs or distinguish every instance of worker assistance from replacement.
Where can I find country-level values for a slide?
Use the online annex and the dataset published with the bulletin. The annex lists the overlap and a high-exposure employment share for major economies. Avoid estimating country values from the map, which only shows value bands.
Can Tosea AI redesign my existing PowerPoint without changing the content?
Yes. Export the PowerPoint as a PDF, upload it to Tosea AI, and request a redesign preserving the original wording. Use Layout Only for visual restructuring. Review every label, footnote, and slide element for completeness.
How do I upload a PowerPoint and ask Tosea AI to redesign each slide?
Export the deck as a PDF and upload that file. Specify that content and sequence must remain intact. Choose a template or visual direction, generate the presentation, and inspect each slide before exporting.
Can I upload my own PowerPoint template to Tosea AI?
Tosea AI supports custom templates on eligible paid plans. Follow the product workflow and verify that required layouts, fonts, colors, logos, and master-slide requirements are represented in the resulting deck.
Can Tosea AI use custom brand colors, fonts, and a logo?
Yes. Specify brand colors and fonts and provide a logo, or use a supported custom template. Custom logo and template features depend on plan eligibility. Verify font availability, color values, logo spacing, and contrast after export.
Can Tosea AI match the style of my old company presentations?
A representative deck can provide design guidance. This does not imply permanent model training. Use an approved custom template for stronger consistency and compare the output with company brand guidelines.
Does Tosea AI preserve PowerPoint formatting after export?
Editable PPTX export is designed to remain close to the preview while supporting further editing. Fonts, complex graphics, and the viewing application can affect results. Test the exported file in the exact environment used for presentation.
Can I tell AI to edit the layout only and keep the exact wording?
Yes. Layout Only changes visual structure without intentionally rewriting content. Compare the revised slide with the approved source to confirm that wording, citations, labels, footnotes, and line breaks remain correct.
Turn demographic research into a decision-ready deck
The strongest AI and population ageing presentation connects industry evidence to a specific decision and makes its uncertainty visible. Tosea AI helps turn the research into a structured presentation, refine layouts during outlining and after rendering, and export an editable deck for review.
For related guidance, explore AI Think-Cell Alternative: Editable PowerPoint Charts for chart workflows and How to Build a BCG-Style Storyline for organizing the final strategy narrative.
Sources
- Old workers, young machines: can AI and automation offset population ageing? — BIS Bulletin No. 135, Bank for International Settlements, September 24, 2026
- BIS Bulletin No. 135 (full PDF) — Bank for International Settlements
- World Population Prospects 2024 — United Nations
- ILOSTAT — International Labour Organization