How to Create a Consulting PowerPoint with AI: Z-Score, DuPont, and IAM
Build a consulting PowerPoint with AI using the Altman Z-Score, DuPont ROE analysis, and the Intangible Assets Monitor: worked examples, slide checks, and copy-ready prompts.
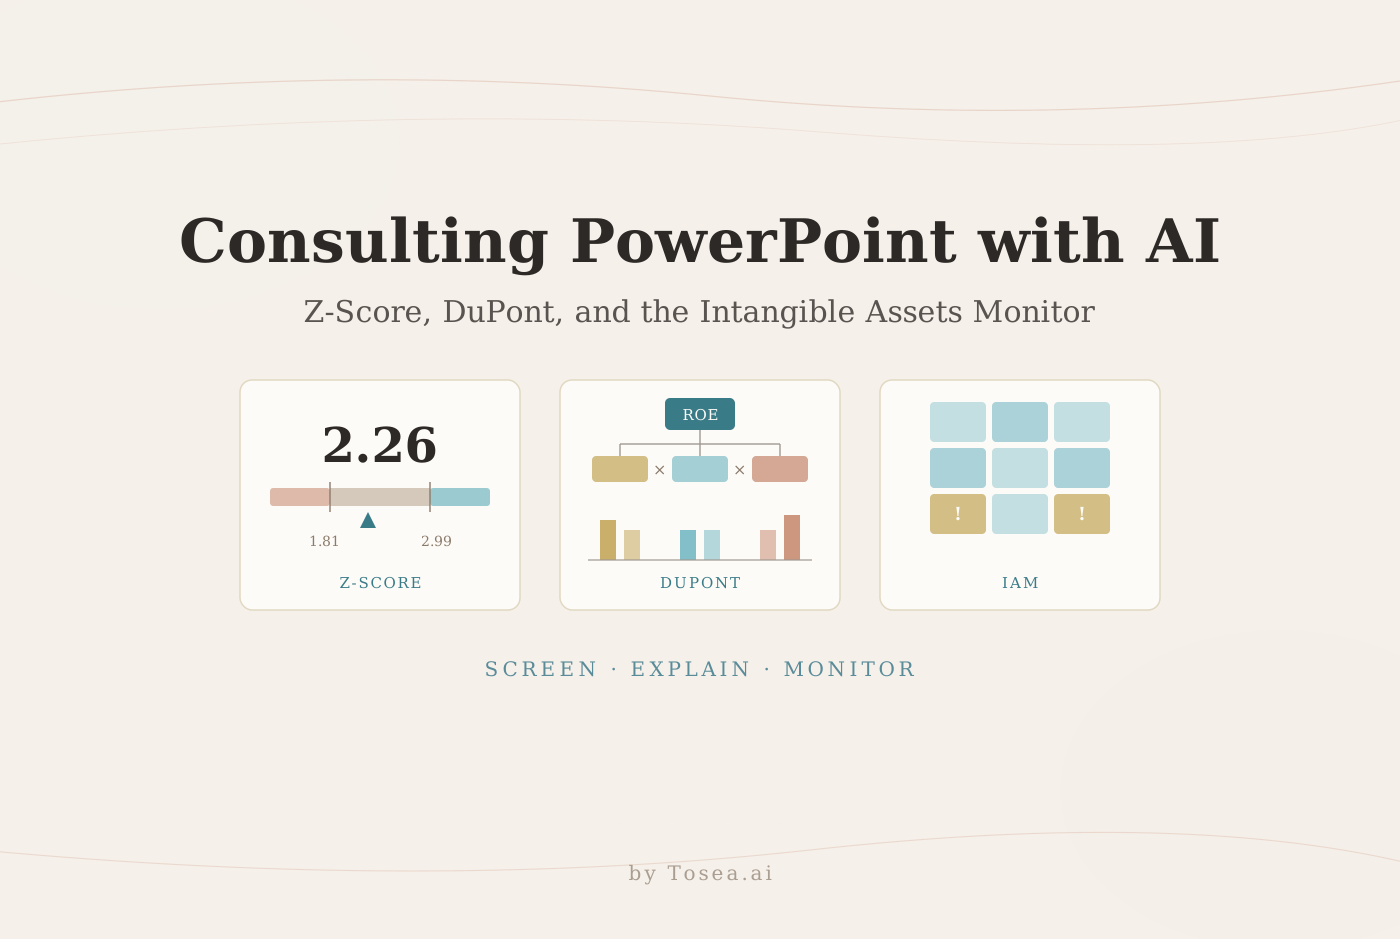
A consulting PowerPoint with AI should help an audience make a decision through a clear argument, traceable calculations, and readable evidence. Tosea AI helps you organize source documents, build an outline, create charts, and revise layouts in one presentation workflow. This guide shows finance teams, strategy analysts, and managers how to apply three useful frameworks: Altman Z-Score for financial distress screening, DuPont analysis for return drivers, and the Intangible Assets Monitor for organizational capabilities.
Quick answer: Define the decision, choose a model that fits the company, calculate from consistent source data, and give each slide one supported conclusion. Use AI to structure and visualize the analysis, then reconcile the output with your workbook before presenting.
Contents
- Choose the framework
- Z-Score: screen financial resilience
- DuPont: explain return on equity
- Intangible Assets Monitor: track capabilities
- Put the three models in one deck
- How we checked the example slides
- Build the deck in Tosea AI
- Pre-meeting checklist
- Frequently asked questions
Choose the framework
Match the model to the management question.
| Decision | Framework | Recommended slide | Main limitation |
|---|---|---|---|
| Which financial exposures deserve investigation? | Altman Z-Score | Score, weighted contributions, and follow-up actions | Model fit and accounting inputs matter |
| Why did shareholder returns change? | DuPont analysis | Driver tree with period comparisons | Higher leverage can raise ROE without better operations |
| Are capabilities becoming stronger or more fragile? | Intangible Assets Monitor | Indicator matrix with trends and owners | Indicators do not establish a monetary valuation |
Build each page around a finding, evidence, and decision. Use consistent margins, dark text, restrained accents, explicit units, and source references. If you need a refresher on conclusion-first titles and storyline order, our guide to McKinsey-style deck logic covers the pattern these slides follow.
Z-Score: screen financial resilience
What it does and when to use it
Edward Altman introduced a multivariate bankruptcy classification model in his 1968 Journal of Finance paper. It combines accounting and market ratios into a financial distress screening score. It can support supplier risk reviews, acquisition screening, or questions for a finance diligence workstream.
The original model was developed for publicly traded manufacturing companies. Private-company and non-manufacturing variants have different specifications. Name the version and confirm its suitability before calculating. A Z-Score is not a calibrated probability that a company will fail within two years.
Calculate and explain the score
Using decimal ratios, a commonly used original-model specification is:
Z = 1.2 × X1 + 1.4 × X2 + 3.3 × X3 + 0.6 × X4 + 1.0 × X5
Here, Z is the combined score. X1 is working capital divided by total assets; working capital means current assets minus current liabilities. X2 is retained earnings divided by total assets. X3 is earnings before interest and taxes, or EBIT, divided by total assets. X4 is market value of equity divided by book value of total liabilities. X5 is sales divided by total assets. The numbers multiplying each ratio are model coefficients; multiplication weights each input, and addition combines their contributions.
For the fictional example, X1 through X5 equal 0.20, 0.30, 0.20, 0.40, and 0.70. Their weighted contributions are 0.24, 0.42, 0.66, 0.24, and 0.70, producing Z = 2.26. Historical original-model reference bands commonly use 1.81 and 2.99 as boundaries; the example lies between them. These are screening conventions, not universal lending rules.
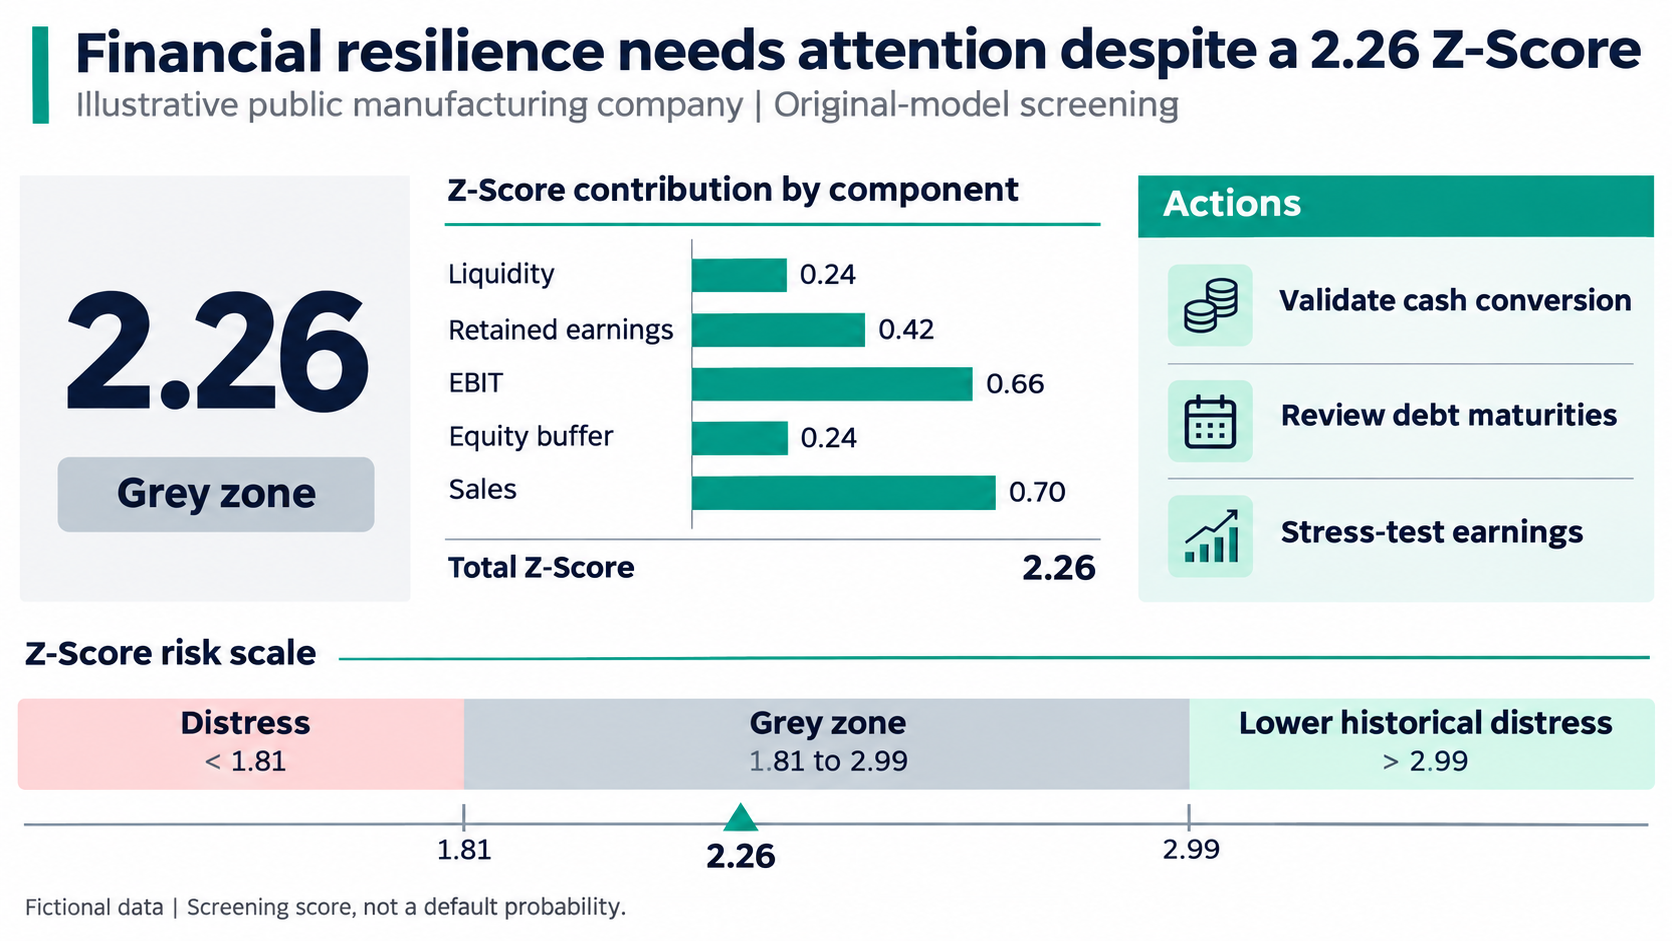
Original AI-generated slide with fictional data. The score prompts investigation of cash conversion, debt maturities, and earnings sensitivity.
Pick the right Altman variant
Altman's 2000 revisit of the model re-estimated it for companies the original sample did not cover. The variants are not interchangeable: each has its own coefficients and its own cutoffs.
| Variant | Built for | X4 (equity input) | Specification | Grey zone |
|---|---|---|---|---|
| Z (1968) | Public manufacturers | Market value of equity ÷ book liabilities | 1.2X1 + 1.4X2 + 3.3X3 + 0.6X4 + 1.0X5 | 1.81 to 2.99 |
| Z' | Private manufacturers | Book value of equity ÷ book liabilities | 0.717X1 + 0.847X2 + 3.107X3 + 0.420X4 + 0.998X5 | 1.23 to 2.90 |
| Z'' | Non-manufacturers; adapted for emerging-market credits | Book value of equity ÷ book liabilities | 6.56X1 + 3.26X2 + 6.72X3 + 1.05X4 | Different scale; use the cutoffs published with the version you cite |
Z'' drops the sales-to-assets ratio because asset turnover varies so much across industries. Altman also notes that the emerging-market version adds a constant of 3.25. Put the variant name in the slide subtitle, as the example does with "Original-model screening," so nobody compares a Z' score against the original 1.81 boundary.
How far is 2.26 from the boundary?
A score in the grey zone raises a better question than "safe or unsafe": what would have to change to cross a boundary? The example sits 0.45 points above 1.81 and 0.73 points below 2.99.
EBIT carries the largest coefficient, so it is the fastest route down. With everything else unchanged, EBIT to total assets would have to fall by 0.136 (0.45 ÷ 3.3), from 0.20 to about 0.064, to reach 1.81 on its own. That is roughly a two-thirds drop in EBIT. By contrast, the market-equity term contributes only 0.24 in total, so even a collapse in the share price cannot push the score below 1.81 by itself. That is exactly the kind of sentence that belongs under a "Stress-test earnings" action: it tells the committee which input deserves the diligence hours.
Two cautions from Altman's own testing are worth a footnote. He recommended the 1.81 lower boundary as a more realistic cutoff than the 2.675 value that minimized errors in the original sample. He also reported that by 1999 more than 20 percent of U.S. industrial firms in Compustat scored below 1.81, and that rising average scores were driven largely by stock prices lifting X4. A low score is a reason to investigate, and a high score in a rising market can flatter the balance sheet.
Common Z-Score slide mistakes
- Mixing scales. The 1968 paper printed coefficients (0.012, 0.014, 0.033, 0.006, 0.999) that expect X1 to X4 as percentages. The 1.2, 1.4, 3.3, 0.6, 1.0 form expects decimals. Mixing the two produces nonsense.
- Swapping equity inputs. Book equity in the original formula silently turns it into a different model.
- Calling the grey zone "safe." The grey zone is where the original study misclassified firms; present it as a range that needs follow-up work.
Copy-ready Z-Score prompt
Create one financial resilience screening slide from the uploaded financial statements and workbook.
First identify the company type and applicable Altman model. If suitability is uncertain, ask for the required company information before calculating.
Show the model version, reporting date, input definitions, source references, calculation, weighted contributions, and applicable reference bands.
Use a conclusion title, a contribution chart, and three follow-up diligence questions.
Keep currencies and periods consistent. Do not substitute book equity for market equity without changing the model explicitly. Do not express the score as a default probability or investment recommendation.
DuPont: explain return on equity
What it does and when to use it
DuPont analysis decomposes return on equity into profitability, asset use, and financial leverage. It suits annual operating reviews, peer comparisons, and discussions about whether higher returns reflect better execution or a smaller equity base.
The three-part identity is:
ROE = Net profit margin × Asset turnover × Equity multiplier
ROE means return on equity: net income divided by average equity. Net profit margin is net income divided by revenue. Asset turnover is revenue divided by average total assets. The equity multiplier is average total assets divided by average equity. The multiplication signs connect the ratios; revenue and average assets cancel algebraically, leaving net income divided by average equity. Use consistent income, equity, and consolidation definitions throughout. OpenStax explains the DuPont method.
Turn the calculation into a management finding
Consider fictional FY2025 results: an 8 percent margin, 1.20 times asset turnover, and a 2.00 times equity multiplier produce 19.2 percent ROE. In FY2026, a 6 percent margin, unchanged turnover, and a 3.00 times equity multiplier produce 21.6 percent ROE.
The return increased while profitability weakened. Translate the multiplier for a non-finance audience: because assets equal liabilities plus equity, a multiplier rising from 2.00 to 3.00 means liabilities grew from 1.0 times equity to 2.0 times equity. That is a useful discussion starter: examine margin recovery and financial exposure before celebrating the higher headline return. The identity describes the ratios; it does not prove why margins or leverage changed. Investigate pricing, costs, asset movements, debt, and repurchases separately.
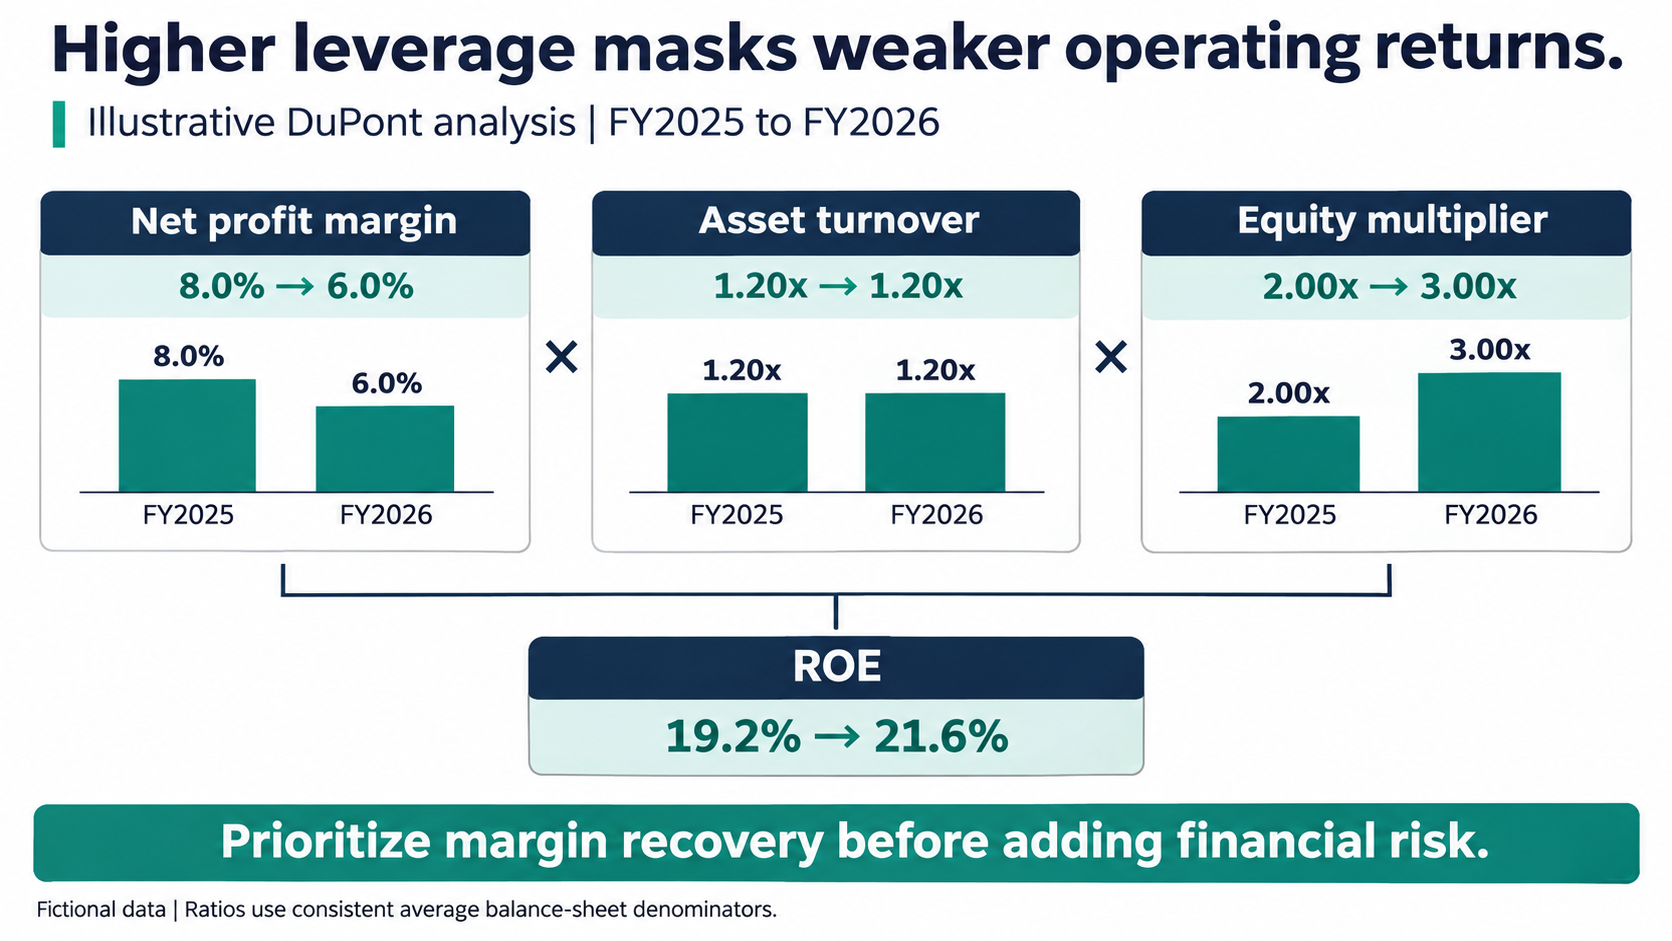
Original AI-generated slide with fictional data. Driver cards expose the difference between operating performance and financial leverage.
We used the same fictional case in our business frameworks guide, which presents it as a text-first editable layout. Putting the two treatments side by side is a quick way to decide how much chart your audience needs: paired bars make the direction of each driver obvious, while the text layout leaves more room for the management question.
When to use the five-step version
In the three-step view, "weaker margin" and "higher leverage" look like two separate stories. They may be one story. New debt adds interest expense, and interest expense lowers net margin. The five-step version separates the two:
ROE = Tax burden × Interest burden × EBIT margin × Asset turnover × Equity multiplier
Tax burden is net income divided by pre-tax income. Interest burden is pre-tax income divided by EBIT. EBIT margin is EBIT divided by revenue. The last two terms are unchanged from the three-step version, and the extra terms cancel back to the same ROE.
If the FY2026 margin decline came mostly from a lower interest burden while EBIT margin held steady, the recommendation changes. The slide stops saying "fix operations" and starts saying "the leverage that raised ROE is also eating the margin." Keep the five-step split as a backup page unless leverage moved materially; most audiences only need the three drivers on the main slide.
Copy-ready DuPont prompt
Build a two-period DuPont analysis from the approved workbook.
Use net profit margin, asset turnover, and equity multiplier with consistent average balance-sheet denominators. Reconcile their product to reported ROE and flag differences.
Create a slide titled with the supported finding, then display a three-driver tree, period values, and management implications.
If the equity multiplier changed materially, add a backup slide with the five-step split (tax burden, interest burden, EBIT margin, asset turnover, equity multiplier).
Separate mathematical decomposition from causal explanations. Label unsupported explanations as hypotheses.
Flag negative or unusually small equity, exceptional items, and inconsistent reporting definitions. Add source references and state any averaging convention.
Intangible Assets Monitor: track capabilities
What it does and when to use it
Karl-Erik Sveiby developed the Intangible Assets Monitor, or IAM, to organize indicators of employee competence, internal structure, and external structure. His 1997 IAM paper describes monitoring these organizational resources. The framework supports capability reviews, professional-services planning, and discussions about knowledge retention or customer dependence.
Employee competence includes skills and experience. Internal structure includes processes, systems, and reusable organizational knowledge. External structure includes customer and supplier relationships. Monitor growth and renewal, efficiency, and stability across these categories. Growth and renewal may also be presented separately when useful.
IAM is a management measurement framework. It does not directly calculate the monetary value of a workforce, a brand, or accounting-recognized intangible assets.
Build an indicator matrix that leads to action
Choose a small set of indicators tied to your decision. Define each numerator, denominator, reporting period, owner, and desired direction before assigning a status color. Sveiby's own guidance points the same way: the monitor should fit on one page, with only one or two indicators per category, as summaries of the method note. A nine-cell grid with one indicator each is the slide-sized version of that rule.
In the fictional example, knowledge reuse improves from 45 to 60 percent and project cycle time falls from 12 to 10 days. However, key-role retention drops from 91 to 86 percent, while the five largest clients account for 51 percent of revenue, up from 42 percent. The resulting discussion concerns retention and concentration alongside efficiency improvements.
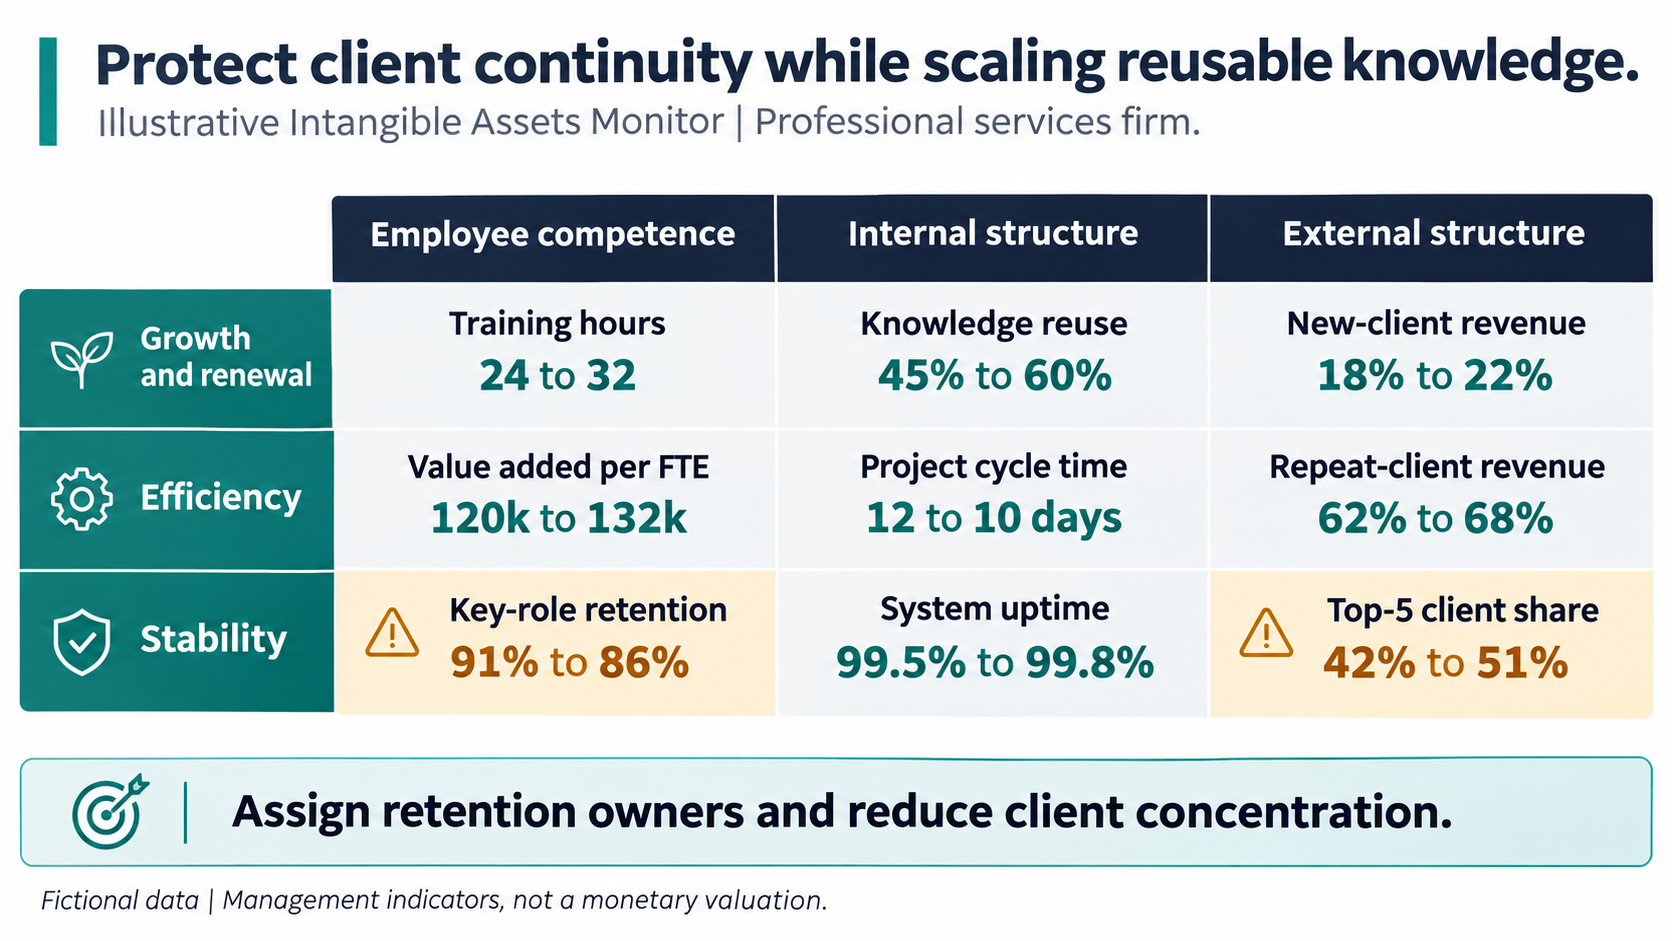
Original AI-generated slide with fictional data. Amber cells identify retention and concentration concerns rather than assigning an overall asset value.
Training hours measure activity, not demonstrated competence. Repeat-client revenue and top-client concentration describe different aspects of relationships. Avoid combining unlike indicators into one score unless the weighting and rationale are explicit. For a related way to put capability gaps on a single page, see our guide to key success factors, scenarios, and Org DNA slides.
Copy-ready IAM prompt
Create an Intangible Assets Monitor for [business and decision].
Use employee competence, internal structure, and external structure as columns. Use growth and renewal, efficiency, and stability as rows.
Select one decision-relevant indicator per cell from the supplied records. Include definition, period, current and prior value, source, accountable owner, and direction of improvement.
Highlight contradictions such as rising productivity with declining retention. Finish with two actions and review dates.
Do not infer causality or monetary asset values. Distinguish missing data from poor performance and proposed indicators from measured results.
Put the three models in one deck
The three models answer different questions, so they work best in sequence: screen first, explain second, look forward last. Do not average them into a single score. If the audience wants one ranking across several companies, a weighted composite such as the Wall method is the better tool, and it comes with its own weighting debates.
| # | Main slide | What it answers | Backup page |
|---|---|---|---|
| 1 | Executive summary | What should we decide, and why? | Scope, data sources, reporting dates |
| 2 | Z-Score screen | Is financial resilience a concern? | Ratio inputs, variant choice, distance-to-boundary math |
| 3 | DuPont driver tree | Why did returns move? | Five-step split and reconciliation to reported ROE |
| 4 | IAM matrix | Are the capabilities behind future returns getting stronger? | Indicator definitions, owners, prior-period values |
| 5 | Risks and next steps | Who does what, by when? | Open diligence questions |
The examples in this guide use separate fictional companies so each model can be shown at its clearest. In a real engagement, all three slides describe the same company, and the links between them become the story. A rising equity multiplier on slide 3 usually shows up as a weaker X4 on slide 2. A drop in key-role retention on slide 4 is a risk to the margin recovery that slide 3 recommends.
Keep every calculation in the backup pages, not in the speaker's head. In review meetings, the hardest questions usually go to the denominators rather than the headline.
How we checked the example slides
The three example slides are AI-generated, so we recalculated every figure before publishing.
- Z-Score: 1.2 × 0.20 = 0.24, 1.4 × 0.30 = 0.42, 3.3 × 0.20 = 0.66, 0.6 × 0.40 = 0.24, and 1.0 × 0.70 = 0.70. The contributions sum to 2.26.
- DuPont: 8.0% × 1.20 × 2.00 = 19.2% and 6.0% × 1.20 × 3.00 = 21.6%.
- IAM: every value in the matrix matches the narrative above.
One correction was needed. In the generated Z-Score slide, the marker on the risk scale sat at roughly 2.38 rather than 2.26. We moved it to the to-scale position between the 1.81 and 2.99 ticks. Two smaller observations remain visible. The contribution bars are close to proportional but not exact, and the IAM example's new-client and repeat-client revenue shares add to 90 percent, so a real slide should label the remaining 10 percent or tighten the definitions.
The lesson for your own deck: AI drafts the visual quickly, but positions, bar lengths, and category totals still need the same audit as the numbers. Charts drawn from the data, rather than placed by hand, remove most of these errors.
Build the deck in Tosea AI
Upload the approved workbook, financial statements, and management context to Tosea AI. State the audience and decision, then use the relevant prompt. Review the outline before rendering so the headline, evidence, and recommendation agree.
Select a business template and choose layouts or diagrams during outline preparation. After rendering, adjust individual layouts when a driver tree, matrix, or contribution chart would communicate the finding more clearly.
Data Studio supports chart data and styling edits from recognized source figures or imported Excel and CSV files. Verify extracted values against the workbook; image recognition does not validate a financial model. Keep calculation detail and source tables in backup pages. Our walkthrough of editable PowerPoint charts in Data Studio shows the chart-editing steps in more detail.
For an existing deck, Beautify PPT/PDF can redesign uploaded PDF or PPTX pages using a selected template. Choose Keep source pages when content and sequence are approved. Use Layout Only for subsequent visual changes, then compare numbers, labels, footnotes, and images with the source. Our guide to beautifying a PowerPoint without changing its content covers that workflow, and Tosea AI product updates list current availability.
Pre-meeting checklist
- The slide subtitle names the model version (Z, Z', or Z'') and the reporting date.
- Every ratio uses the same currency, period, and consolidation scope.
- The DuPont product reconciles to reported ROE, and any gap is footnoted.
- Causal explanations are labeled as hypotheses unless evidence supports them.
- Each IAM indicator has a definition, an owner, and a direction of improvement.
- Chart positions, bar lengths, and category totals match the workbook.
- Backup pages hold the calculations, sources, and open questions.
- The final slide names owners and dates for every action.
Frequently asked questions
Can Tosea AI redesign my existing PowerPoint without changing the content?
Yes. Upload the PPTX (or a PDF export) through Beautify PPT/PDF and choose Keep source pages. Use Layout Only for later visual changes. Review every label, footnote, number, and slide element afterward.
How do I upload a PowerPoint and ask Tosea AI to redesign each slide?
Upload the PPTX or an exported PDF through Beautify PPT/PDF. Request preservation of content and sequence, choose a template or describe the design, then inspect each slide before exporting the revised presentation.
Can I upload my own PowerPoint template to Tosea AI?
Tosea AI supports custom templates on eligible paid plans. Check required layouts, fonts, colors, logo placement, and master-slide rules in the generated slides and exported presentation before distribution.
Can Tosea AI use custom brand colors, fonts, and a logo?
Yes. Specify brand colors and fonts, supply the approved logo, or use a supported custom template. Feature access depends on the plan. Verify font availability, color values, logo clear space, and contrast in PowerPoint.
Can Tosea AI match the style of my old company presentations?
A representative company deck can provide design guidance without implying permanent model training. Use an approved custom template for stronger consistency, then compare generated pages with current brand guidelines.
Does Tosea AI preserve PowerPoint formatting after export?
Editable PPTX export aims to remain close to the generated preview. Fonts, complex graphics, and the application used to open the file can affect results. Test it in the exact PowerPoint environment used for delivery.
Can I tell AI to edit the layout only and keep the exact wording?
Yes. Layout Only changes visual structure without intentionally rewriting content. Compare the revised slide with the source, including labels, citations, footnotes, line breaks, and financial definitions.
Continue your consulting presentation workflow
Explore Tosea AI guides on business presentation prompts, ChatGPT prompts for financial presentations, and business dashboard presentations for related structures and chart choices.
A useful consulting PowerPoint with AI gives the audience a supported finding and a practical next step. Tosea AI helps translate your sources and analytical framework into a structured, editable presentation. Start with the management question, verify the model and calculations, then refine the visuals until the decision is clear.
Sources
- Financial Ratios, Discriminant Analysis and the Prediction of Corporate Bankruptcy — Edward I. Altman, Journal of Finance, September 1968
- Predicting Financial Distress of Companies: Revisiting the Z-Score and ZETA Models — Edward I. Altman, NYU Stern School of Business, July 2000 (archived copy)
- Profitability Ratios and the DuPont Method — OpenStax, Principles of Finance
- The Intangible Assets Monitor — Karl-Erik Sveiby, Journal of Human Resource Costing & Accounting, 1997
- Intangible Assets Monitor (method summary) — ValueBasedManagement.net