How to Build a Bain-Style Strategy PowerPoint with AI: KSF, Scenario Analysis and Org DNA
Build a Bain-style strategy PowerPoint with critical success factors, scenario analysis and Organizational DNA: worked scoring examples, AI prompts, and an editable PPTX workflow.
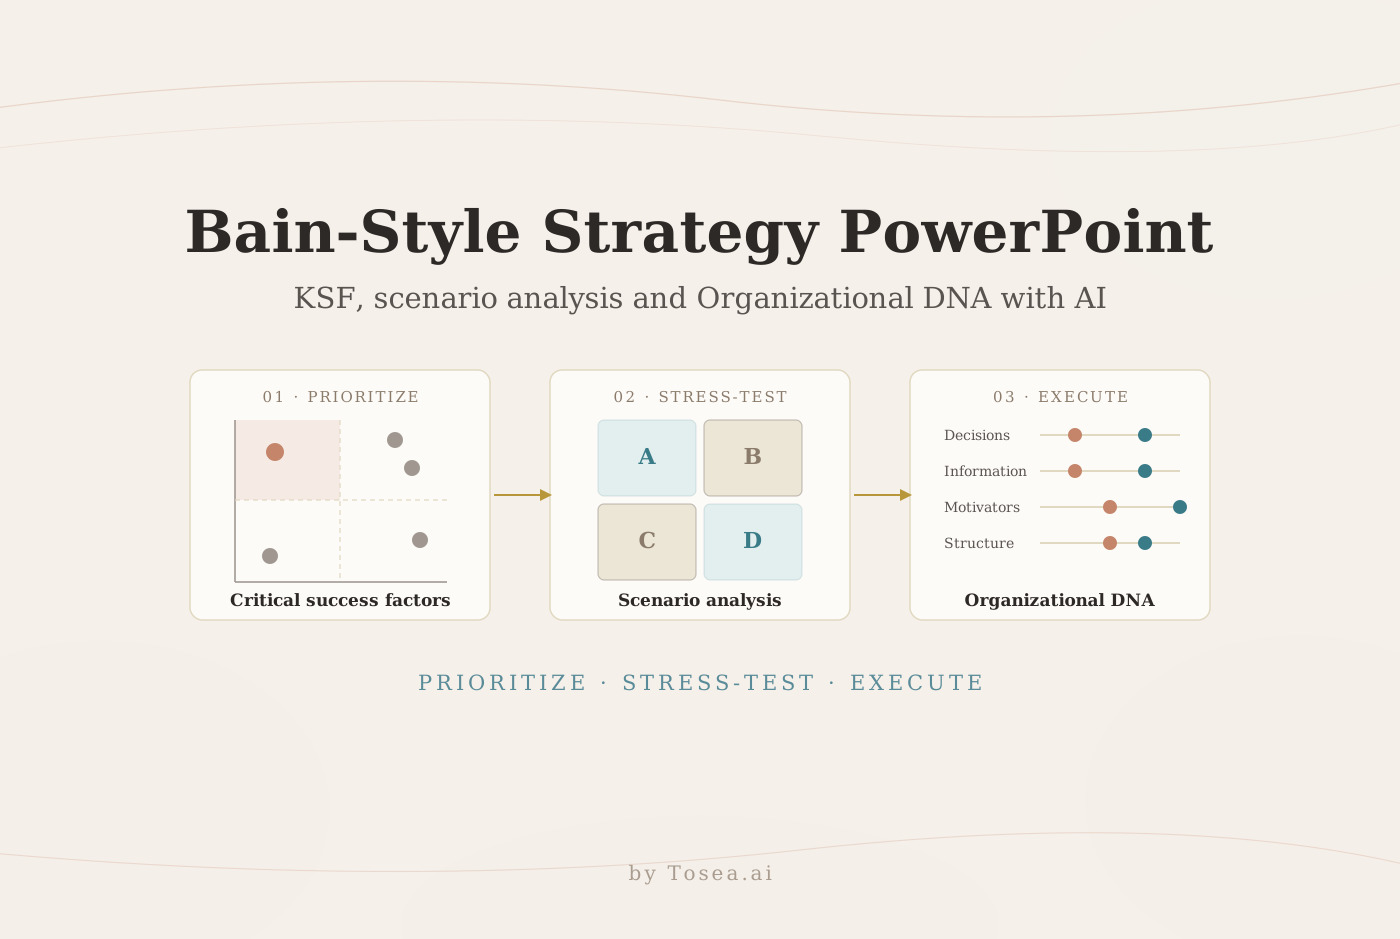
A Bain-style strategy consulting PowerPoint should help an executive decide where to invest, how to prepare for uncertainty, or what is blocking execution. Critical success factors, scenario analysis, and Organizational DNA answer those three questions. Tosea AI helps analysts turn the source material behind each framework into a reviewable outline, editable charts, controlled layouts, and an editable PPTX without losing the evidence trail.
This guide explains when to use each framework, shows how to score them so a reviewer can challenge the numbers, and gives a reusable AI prompt for each slide.
Quick answer: Use critical success factors to direct resources toward the few capabilities that matter most. Use scenario analysis when major uncertainties could produce materially different futures. Use Organizational DNA when the strategy is clear but decisions, information, incentives, or structure are slowing delivery.
The examples below use fictional companies and illustrative scores. They are not Bain & Company templates, and Tosea AI is not affiliated with or endorsed by Bain & Company. "Bain-style" describes the conclusion-led, evidence-first page format used throughout this series. The frameworks themselves have other origins: critical success factors come from John F. Rockart's work at MIT Sloan, and the Org DNA building blocks come from Strategy& (formerly Booz & Company).
Choose the framework from the management question
| Management question | Best starting framework | Recommended slide output |
|---|---|---|
| Which capabilities deserve scarce investment? | Critical success factors | Importance versus strength matrix and ranked priorities |
| Which moves remain sensible across uncertain futures? | Scenario analysis | Scenario matrix, implications, and no-regret actions |
| Why is a sound strategy failing in execution? | Organizational DNA | Current versus target diagnostic and intervention plan |
Use critical success factors to set priorities, scenario analysis to stress-test them, and Organizational DNA to test execution readiness. In a full strategy review, the three pages often appear in that order: what must go right, whether it still holds under different futures, and whether the organization can deliver it.
If your deck needs a broader toolkit, the companion guides cover 10 Bain-style decision-making frameworks and 18 finance, project, and supply chain frameworks.
1. Critical success factors: move resources to what must go right
John F. Rockart developed the critical success factor approach at the MIT Sloan School of Management to identify executive information needs. His 1979 Harvard Business Review article defines CSFs as the limited number of areas where results must be satisfactory for the business to perform, and which therefore need continued management attention. It was not a universal strategy scoring system. See the indexed abstract in the National Library of Medicine.
In strategy work, teams commonly adapt the idea to compare two dimensions:
- Industry importance: how strongly a factor affects competitive success.
- Company strength: how well the company currently owns or performs that factor.
The most urgent factors sit in the high-importance, low-strength quadrant. A consumer goods company might compare brand, distribution, innovation, cost, and customer data. The method forces a choice about management attention and investment, which is why it works best when the slide ends in a resource shift rather than a list of everything that matters.
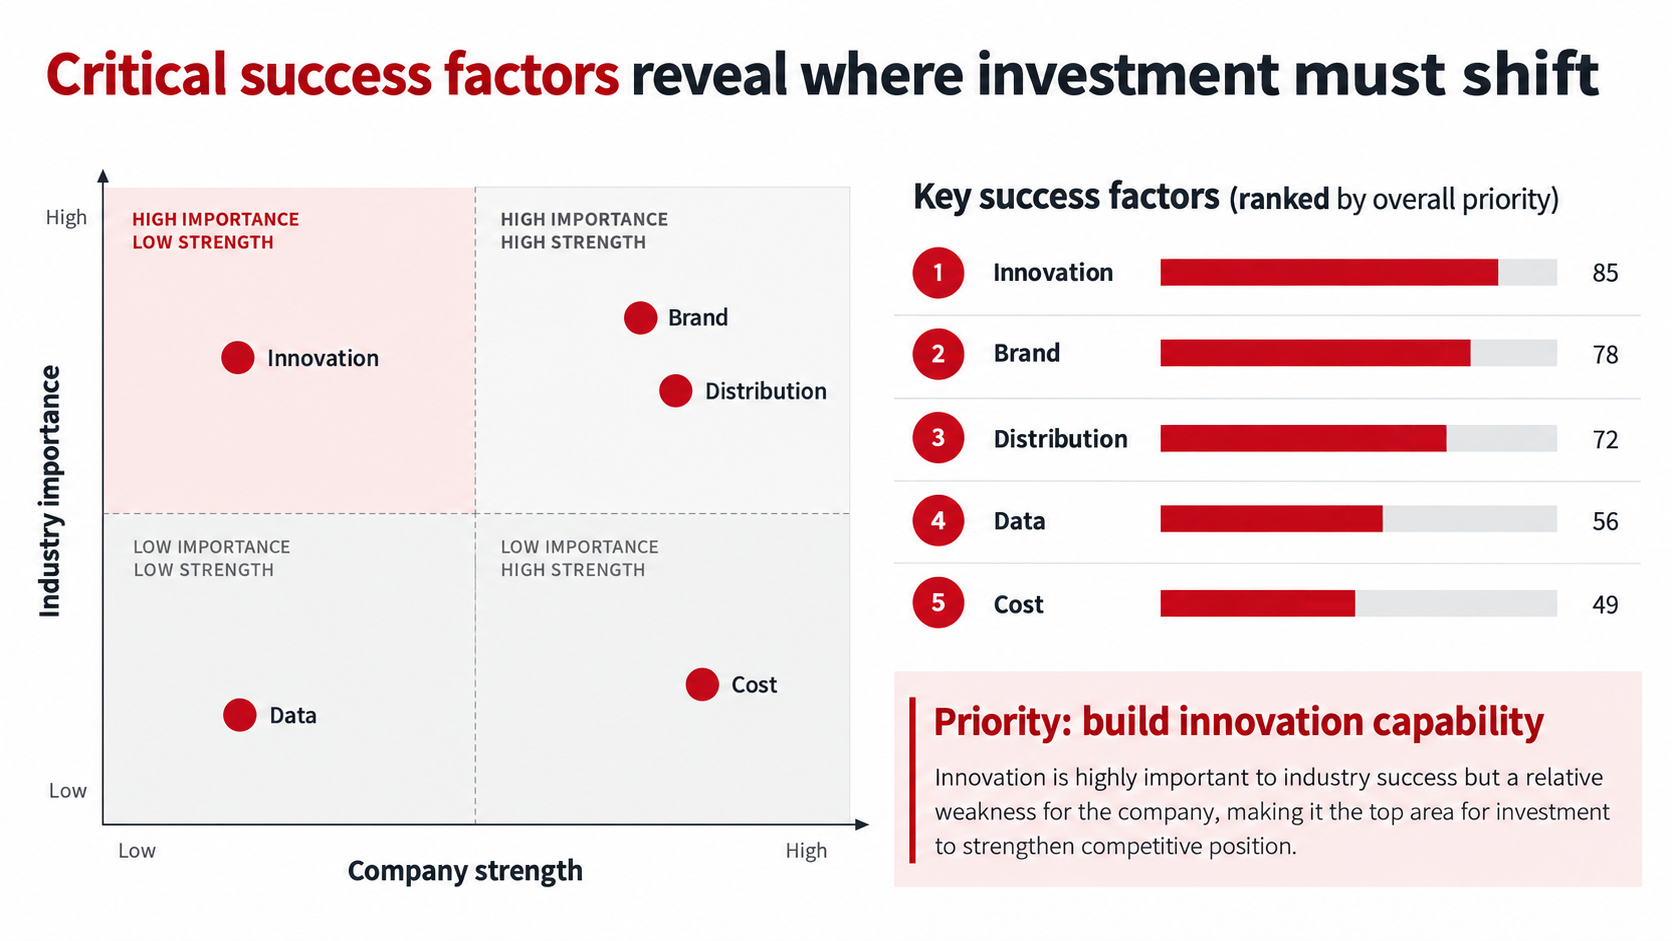
Original editorial example for a fictional consumer goods company. Scores are illustrative; the priority bars use a 0–100 scale.
A practical scoring method
Start with five to eight factors supported by industry evidence, customer research, competitor analysis, and interviews. Define each factor in one sentence so that everyone scores the same thing, then rate importance and strength on one documented scale.
For workshops, teams sometimes use a 0, 1, 2 pairwise rule for importance: 2 when factor A is more important than B, 1 when they are equal, and 0 when A is less important. Sum each row and divide by the total points. This is a facilitation convention, not a Rockart standard, so test how small judgment changes affect the ranking.
Worked example: pairwise weights for five factors
The table below scores the five factors from the example slide. Each pair distributes 2 points, so ten pairs produce 20 points in total.
| Factor | vs Brand | vs Innovation | vs Distribution | vs Cost | vs Data | Total | Weight |
|---|---|---|---|---|---|---|---|
| Brand | – | 1 | 2 | 2 | 2 | 7 | 35% |
| Innovation | 1 | – | 2 | 2 | 2 | 7 | 35% |
| Distribution | 0 | 0 | – | 2 | 2 | 4 | 20% |
| Cost | 0 | 0 | 0 | – | 1 | 1 | 5% |
| Data | 0 | 0 | 0 | 1 | – | 1 | 5% |
| Total | 20 | 100% |
Importance alone does not set priority. Combine the weight with the strength gap. With company strength scored 1 to 5 (Innovation 2, Brand 4, Distribution 4, Data 2, Cost 4), a simple index of weight × (5 − strength) gives Innovation 1.05, Brand 0.35, Distribution 0.20, Data 0.15, and Cost 0.05. That reproduces the order on the slide: Innovation first, Cost last.
Now run the sensitivity check. If the workshop moves the Brand-versus-Innovation judgment from "equal" to "Brand more important," the weights become 40% and 30%. Innovation's index falls to 0.90 and Brand's rises to 0.40. The ranking survives, but the margin narrows. Show this on a backup slide so that reviewers can see the conclusion does not hinge on a single vote.
Disclose the rubric, source, date, and owner for every score. Keep importance separate from company performance; one unexplained index hides the gap management needs to see.
Reusable AI prompt for a KSF slide
Build one KSF slide for [industry] from the attached evidence. Identify two capabilities for incremental investment.

List five to eight factors. Score industry importance and company strength separately from 1 to 5. If pairwise scores exist, show the 0, 1, 2 rule, totals, and normalized weights, and check that each pair sums to 2.

Add an importance-versus-strength matrix, ranked factors, and a resource-shift recommendation. Cite scores and mark evidence gaps. Do not invent survey results.
2. Scenario analysis: prepare for several plausible futures
Scenario analysis applies when a decision depends on external variables the company cannot control. The goal is not to predict the future. It is to define plausible futures, test the strategy against each one, and find actions that remain useful across them.
The U.S. Climate Resilience Toolkit describes a four-step version for decision-making under deep uncertainty: define the decision, identify the uncertainties you cannot control, develop scenarios, and build an adaptive plan. See its guide to decision-making under deep uncertainty. The same logic transfers well to commercial strategy.
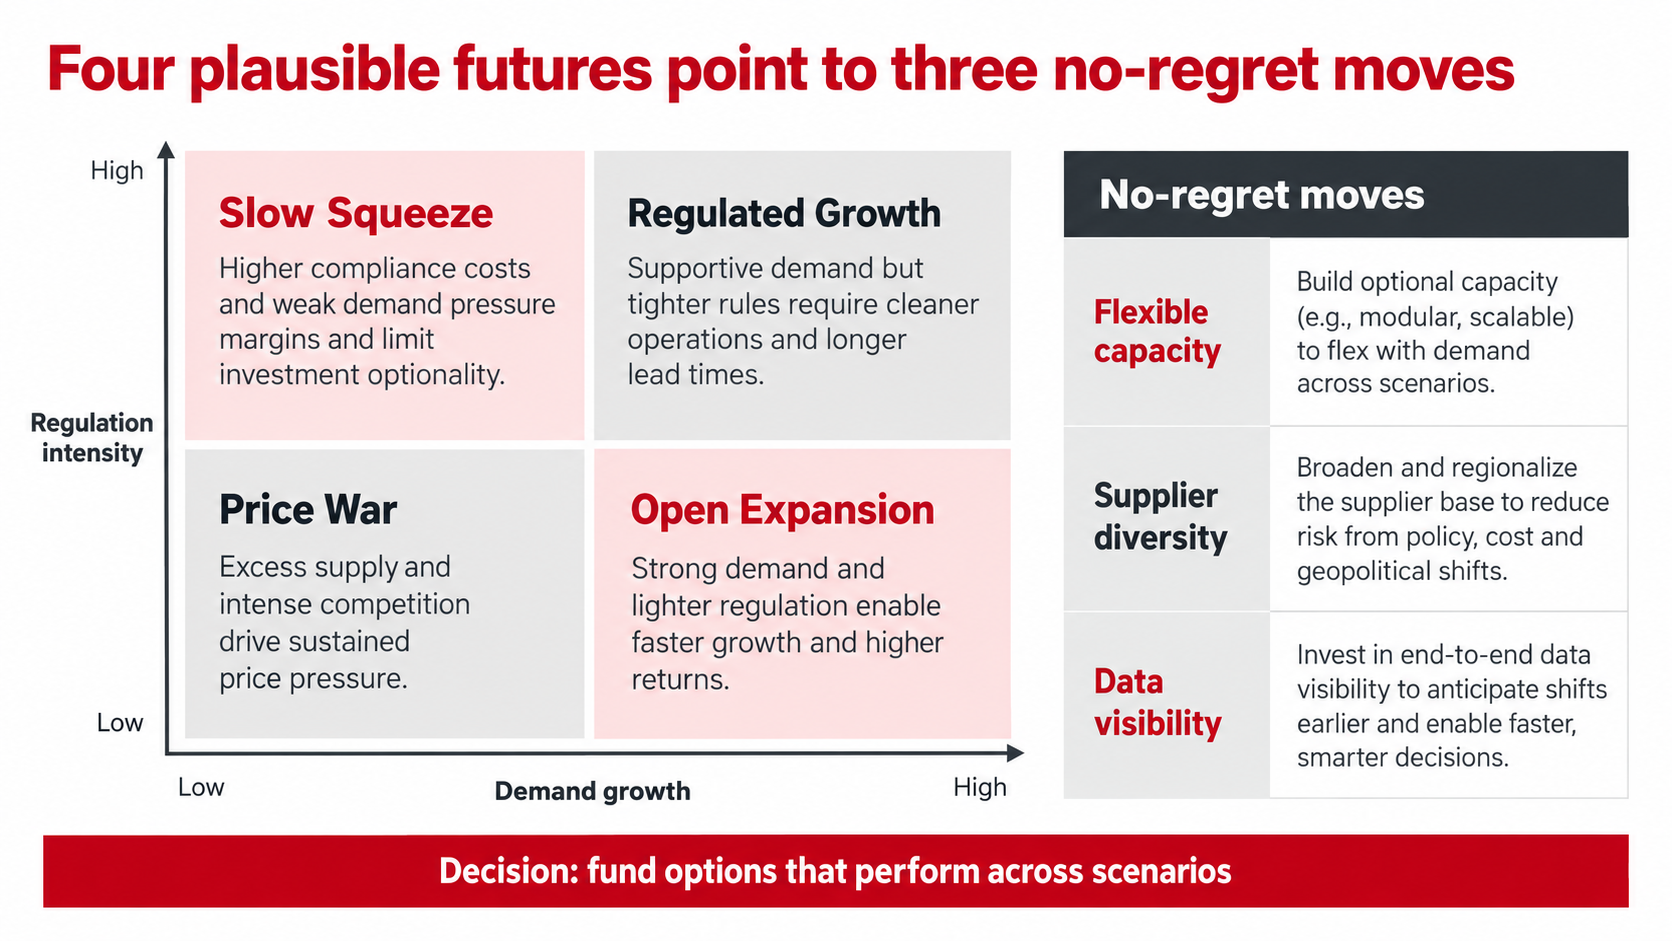
Original scenario slide for a fictional industrial company. All assumptions are illustrative.
Build a scenario page that leads to action
Begin with the decision and time horizon. Separate predetermined trends from genuine uncertainties, then choose two high-impact, sufficiently independent axes for a 2x2 matrix. In the example, demand growth and regulation intensity create four futures: Slow Squeeze, Regulated Growth, Price War, and Open Expansion.
Name each quadrant plainly. Describe demand, economics, competition, regulation, technology, and operational consequences. Add supported estimates, leading indicators, trigger thresholds, and management actions.
End with no-regret moves, options to preserve, and moves that should wait. Black swan and gray rhino labels may prompt discussion, but the deck still needs named drivers, measurable triggers, and owners.
Turn each scenario into signposts
A scenario page earns its place when management knows what to watch. Pair each future with one or two indicators and a trigger that would change the plan. The values below are placeholders for the fictional company; replace them with thresholds your team can defend.
| Scenario | Leading indicator | Illustrative trigger | Action if triggered |
|---|---|---|---|
| Open Expansion | Order backlog growth | Two consecutive quarters above plan | Release the second modular capacity phase |
| Regulated Growth | Draft emissions rules | Final rule published with a compliance date | Fund cleaner-process retrofit |
| Slow Squeeze | Compliance cost per unit | Rising for three quarters while volume is flat | Defer expansion, protect margin |
| Price War | Competitor capacity announcements | New capacity above a set share of the market | Shift to supplier-cost programs and key accounts |
The three no-regret moves on the slide (flexible capacity, supplier diversity, and data visibility) are useful in every quadrant, which is why they can be funded now. Scenario-specific moves wait for their trigger.
Reusable AI prompt for a scenario analysis slide
Build a four-scenario slide for [company] through [year]. Decide which investments to fund, preserve, or defer.

Use the attached evidence. Separate trends from uncertainties, rank the uncertainties, and select two independent axes.

For each scenario, add a name, implications, indicators, and triggers. End with no-regret moves, preserved options, and scenario actions. Do not invent probabilities or market forecasts that the sources do not contain.
3. Organizational DNA: diagnose why execution is slow
Organizational DNA examines the operating mechanisms that shape daily behavior. The classic Strategy& model uses four building blocks: decision rights, information, motivators, and structure. The current Strategy& Org DNA Profiler presents related paired concepts, including decisions and norms, information and mindsets, motivators and commitments, and structure and networks.
Use the framework when the strategy looks sound but execution remains inconsistent. Watch for repeated escalation, unclear ownership, late information, duplicated approvals, misaligned incentives, and slow structural layers.
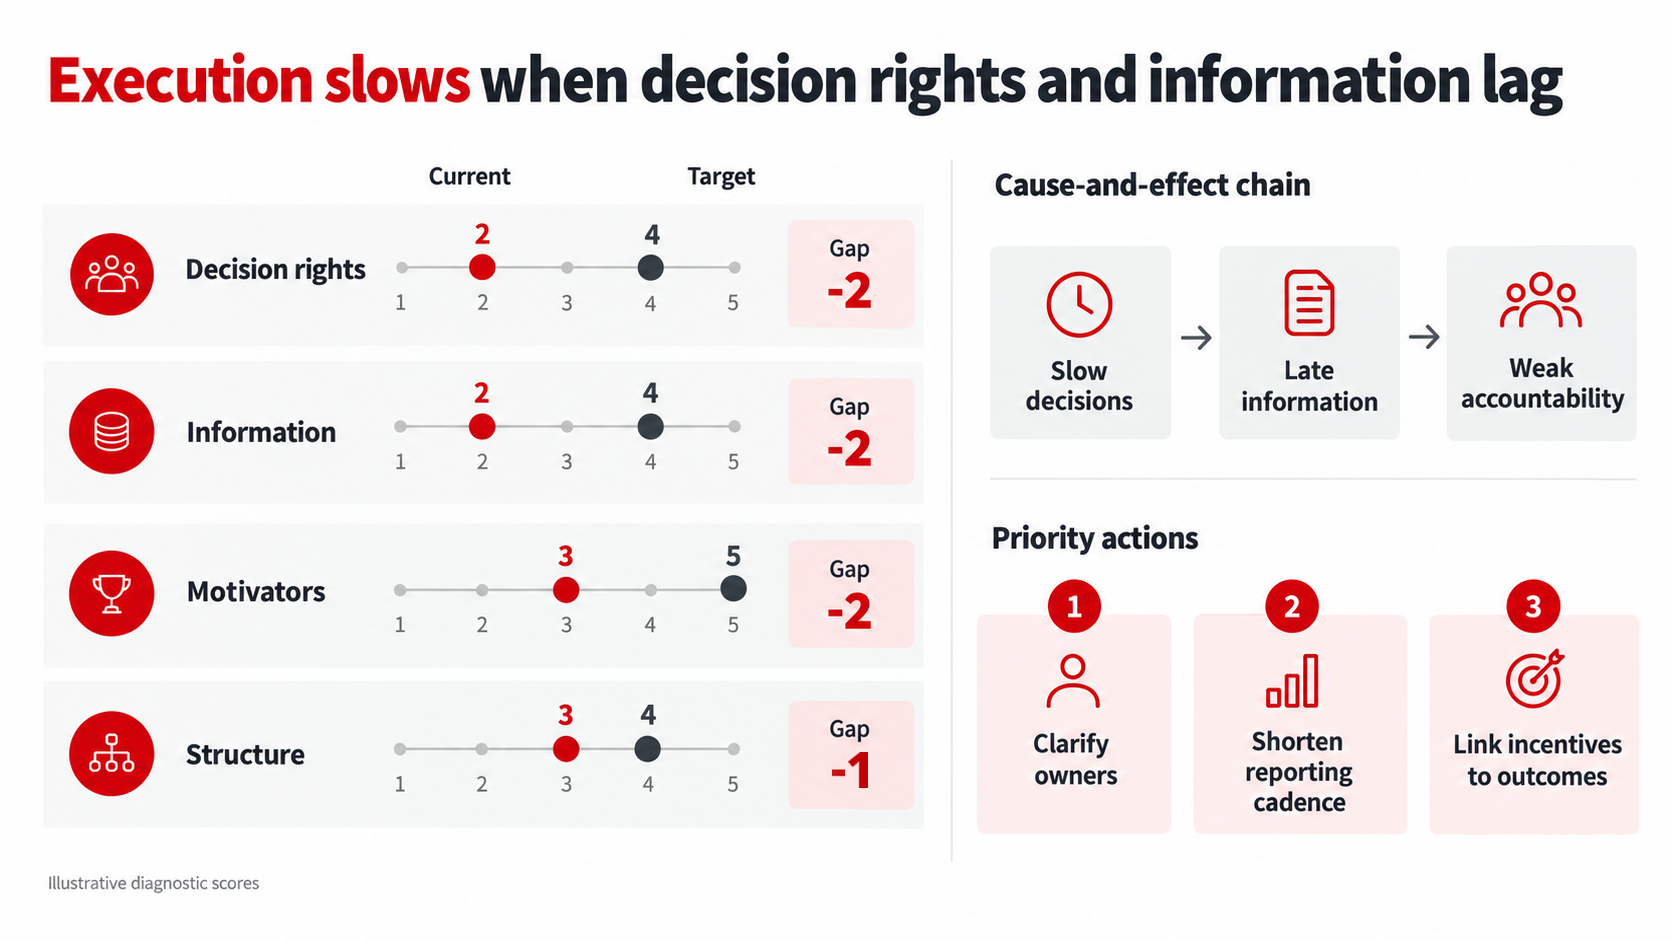
Original editorial diagnostic. The 1 to 5 scores are illustrative, not benchmark data.
Diagnose mechanisms, not personalities
Use interviews, workflow records, decision logs, reports, incentive plans, and organization charts. Define a 1 to 5 rubric before scoring. Report the distribution when leaders and frontline teams disagree; an average can erase the warning.
Connect each symptom to a mechanism. Slow approval may come from unclear decision rights, late information, or both. Show current and target states, evidence, interventions, owners, timing, and measures.
Do not treat the four blocks as independent. A new structure will fail if decision rights stay vague, and faster dashboards will not help a meeting that lacks authority to act.
Make the scores traceable
The example slide reads cleanly because the numbers support the title. Decision rights and information score lowest (2 of 5), so the title names them. The three largest gaps (decision rights, information, and motivators, each −2) receive actions. Structure is closer to target (3 versus 4) and waits for a later wave. Put the evidence behind each score in a backup table:
| Block | Current | Target | Gap | Evidence | Priority action |
|---|---|---|---|---|---|
| Decision rights | 2 | 4 | −2 | Approvals above budget threshold escalate twice | Clarify owners |
| Information | 2 | 4 | −2 | Weekly figures arrive after the decision meeting | Shorten reporting cadence |
| Motivators | 3 | 5 | −2 | Bonus metrics reward volume, not delivery | Link incentives to outcomes |
| Structure | 3 | 4 | −1 | Two layers duplicate sign-off on minor changes | Review after first wave |
When titles, scores, and actions disagree, executives notice. A diagnostic that scores structure as weakly as decision rights but proposes no structural action invites the question "why not?" Check that every red score either has an action or an explanation.
Reusable AI prompt for an Organizational DNA slide
Build one Organizational DNA slide from the attached evidence. Identify three interventions to improve execution.

Score decision rights, information, motivators, and structure from 1 to 5. Show current and target scores, evidence, and response ranges. Link symptoms to mechanisms.

Recommend three actions with owner, timing, measure, and dependency. Check that the title names the lowest-scoring blocks and that every large gap has an action or an explanation. Mark conflicts and avoid personality diagnoses or single-factor conclusions.
Common mistakes on these three pages
- Merging importance and strength into one score. A single composite hides the gap that the KSF matrix exists to show.
- Presenting workshop weights as data. Pairwise totals reflect judgment. Label them, show the rule, and keep the sensitivity check.
- Choosing correlated scenario axes. If demand growth and price both move with the same macro driver, the four quadrants collapse into two.
- Scenarios without signposts. Narratives with no indicators or triggers are interesting, but they do not change a decision.
- Scoring Org DNA from one interview group. Leaders and frontline teams often disagree; show the range.
- Titles that contradict the chart. Recalculate after every edit. If a score changes, the title and the action list may need to change too.
Build the Bain-style strategy consulting PowerPoint in Tosea AI
Upload research, spreadsheets, PDFs, slides, and interview notes to Tosea AI. Review the outline before rendering. Each page needs a conclusion-led title, evidence, intended visual, and management implication.
At the outline stage, choose a layout or diagram for each message: a matrix and ranking for KSF, a 2x2 or trigger roadmap for scenarios, and a scorecard or cause flow for Organizational DNA. After rendering, use Layout / Diagram to try another structure. Use Layout Only when the wording is approved. The layout and diagrams guide explains the controls.
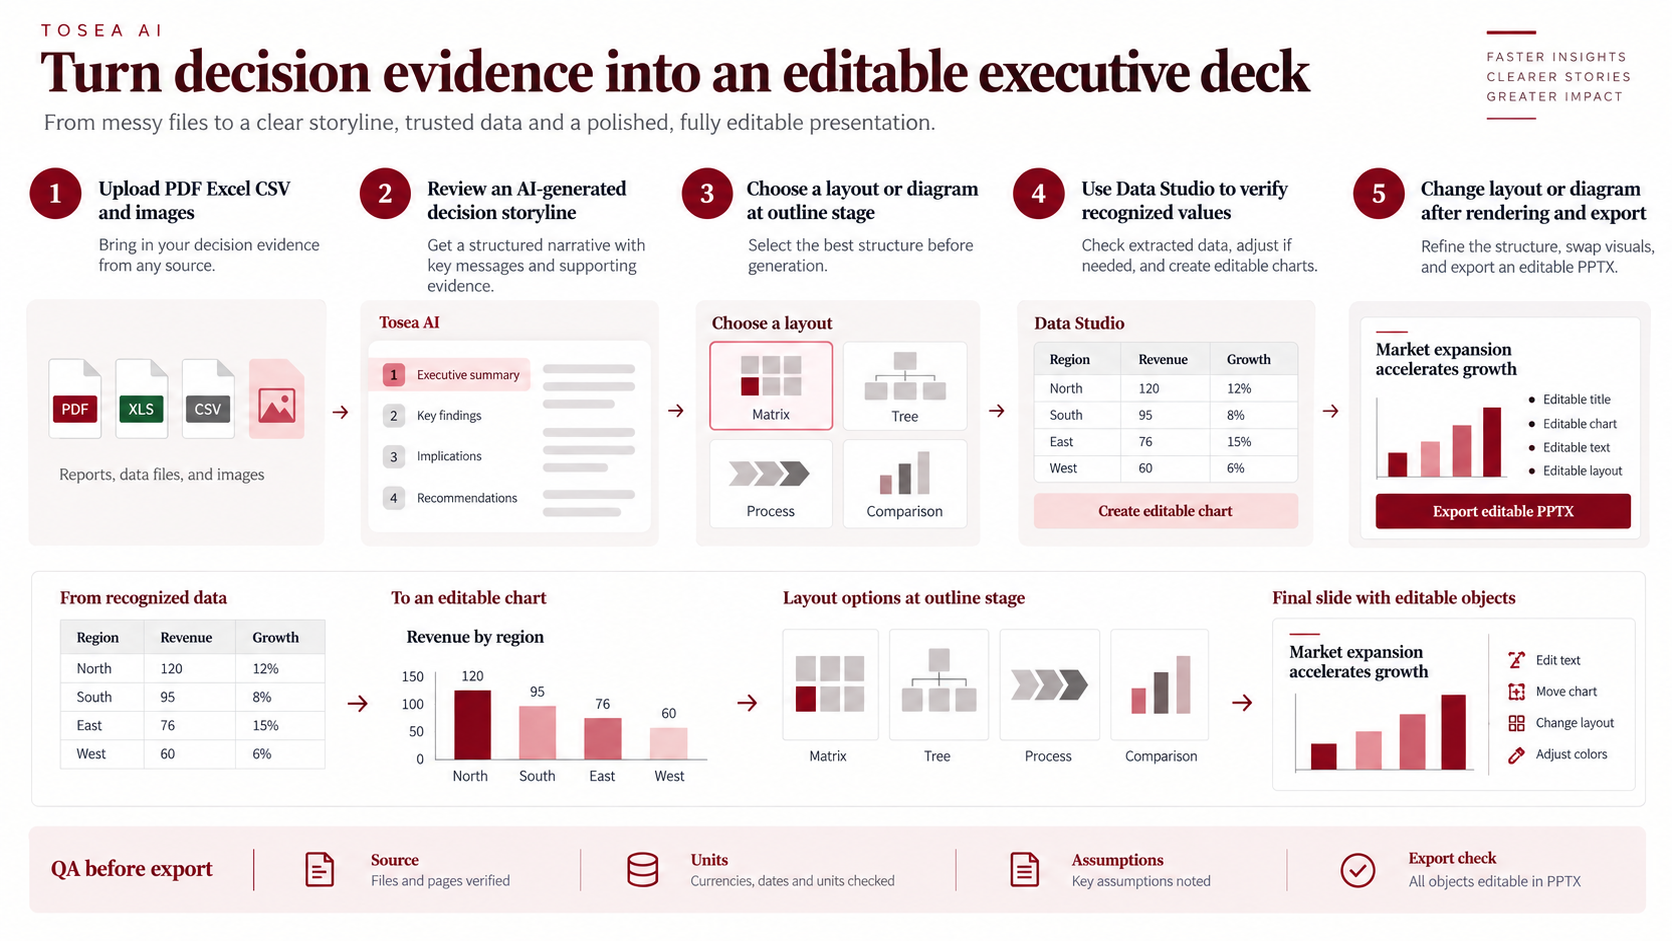
Choose a visual structure during outlining, then change it after rendering if the message is still buried.
Use Data Studio for editable evidence
Tosea AI Data Studio recognizes data in charts and tables or imports Excel and CSV. In the editable grid, correct values, change series mapping or chart type, adjust labels and axes, and apply the deck palette. See the Data Studio documentation and our guide to editable PowerPoint charts with Data Studio.
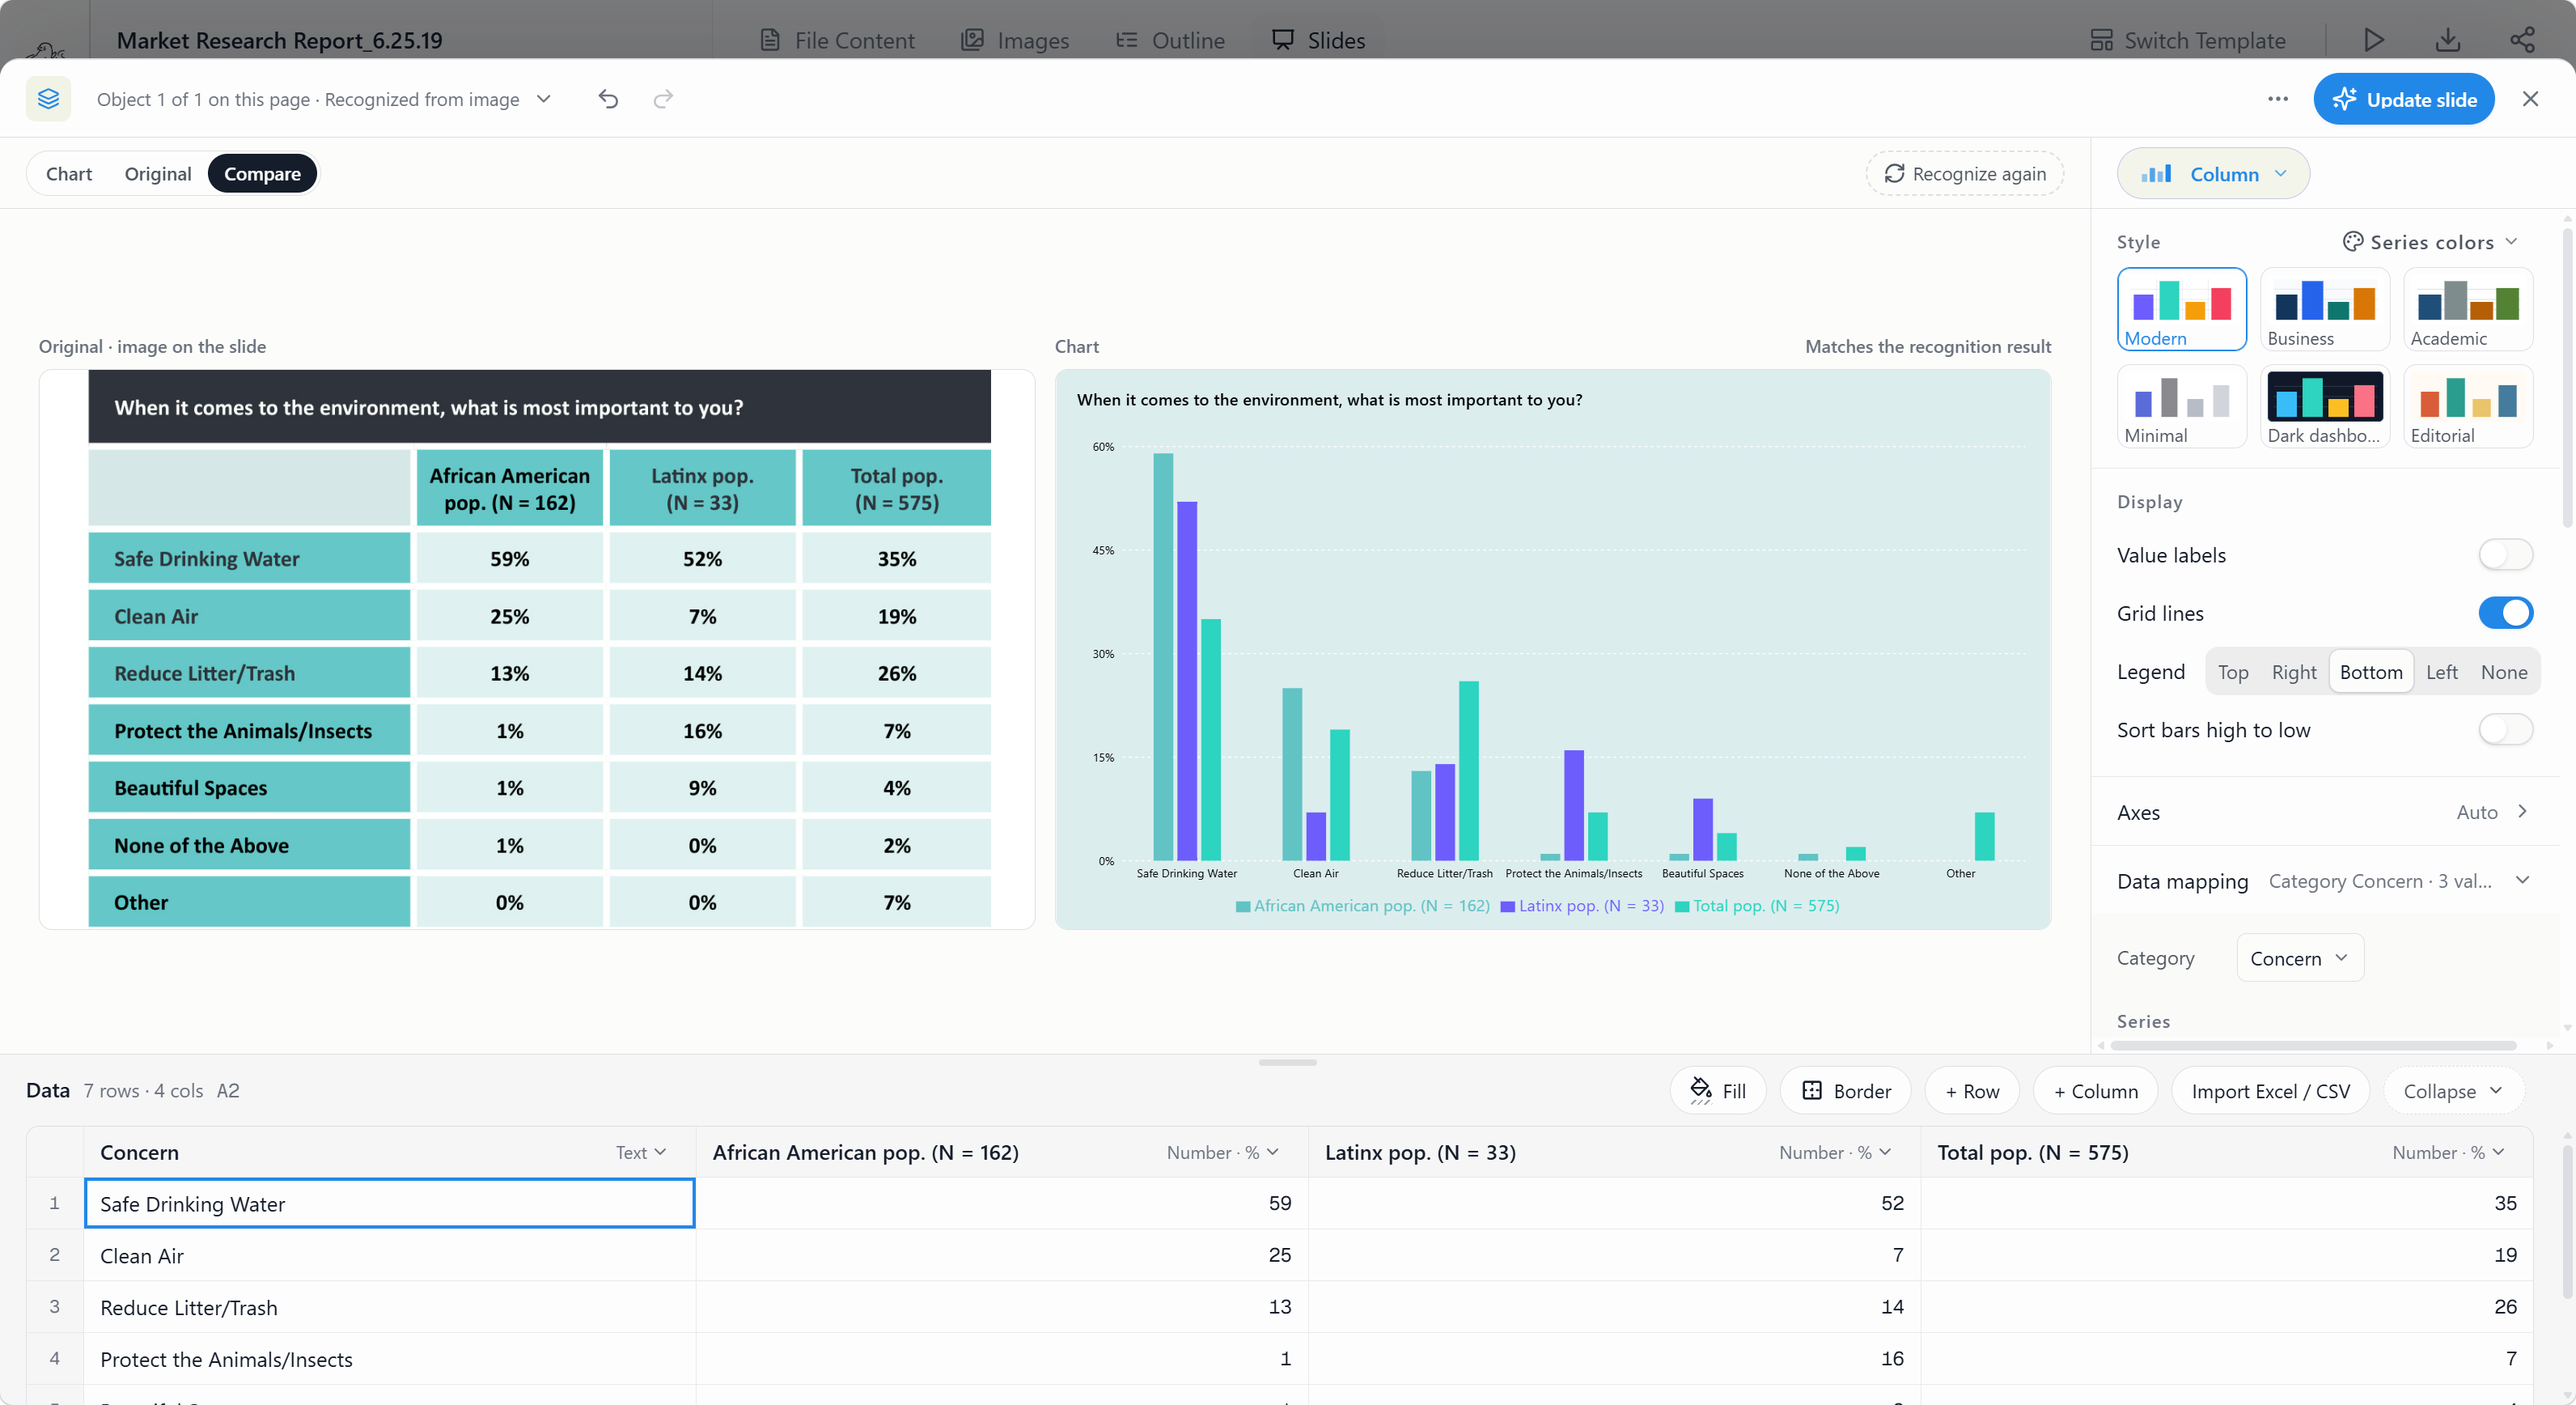
Recognition accelerates chart rebuilding, but the analyst still owns the numbers.
Recalculate pairwise totals, normalized weights, scenario economics, and diagnostic gaps before export. Verify units, dates, denominators, signs, and rounding against the source. Export the deck as editable PPTX, then test fonts, line breaks, chart labels, citations, and object positions in the software used for delivery.
For the storyline that connects these pages, see how to build a BCG-style storyline. For two more structured strategy pages, see the Bain-style SPACE Matrix and Bain-style SCP analysis guides.
Pre-export quality checklist
- Does every page title state a conclusion rather than a topic?
- Can each number be traced to a named source, period, unit, and owner?
- Do pairwise totals add up, and do the weights sum to 100%?
- Is the scoring rubric visible enough for a reviewer to challenge?
- Are facts, assumptions, workshop judgments, and recommendations separated?
- Does the scenario page contain indicators, triggers, and actions, not only narratives?
- Does the Organizational DNA page link symptoms to mechanisms, and does every large gap have an action?
- Do actions include an owner, date, dependency, and success measure?
- Has the final PPTX been checked in the delivery environment?
Frequently asked questions
Are critical success factors the same as KPIs?
No. Critical success factors identify the few areas that must perform well for the strategy to succeed. KPIs are measures used to monitor performance. One CSF may require several KPIs, and a KPI is not automatically critical simply because the company already reports it.
Is the 0, 1, 2 pairwise scoring rule mandatory?
No. It is a practical workshop convention for comparing factors. Rockart's original CSF work did not prescribe one universal strategic scoring formula. State the rule, test sensitivity, and keep qualitative evidence visible so the ranking does not appear more objective than it is.
How many scenarios should a strategy deck include?
Four is common when two major uncertainties form a 2x2 matrix. Use fewer when additional quadrants would be redundant, and use more only when the decision needs them. Every scenario must be plausible, internally consistent, distinct, and tied to an action or trigger.
Is Organizational DNA a Bain framework?
No. The four building blocks were popularized by Strategy& (formerly Booz & Company), now part of PwC. This guide uses it inside a Bain-style page format because it answers the execution question that often follows a strategy recommendation.
Can Tosea AI redesign my existing PowerPoint without changing the content?
Yes. Upload the PPTX or a PDF with Beautify PPT/PDF (available on Pro and above) and keep the default "Keep source pages" option, which preserves the page count, order, and content while redesigning the layout. Use Layout Only for later visual changes. Check labels, citations, footnotes, and page elements after rendering.
How do I upload a PowerPoint and request a slide-by-slide redesign?
Choose Beautify PPT/PDF, upload the PPTX or PDF, keep the source pages, and choose a template or describe the visual direction. Generate the deck, inspect every page, and export the revised presentation as PPTX.
Can I upload my own PowerPoint template to Tosea AI?
Tosea AI supports custom templates on eligible paid plans. Confirm that the template contains the required layouts, fonts, colors, logo positions, and master-slide rules. Review the exported deck in the same PowerPoint environment used for delivery.
Can Tosea AI use brand colors, fonts, and a logo?
Yes. Specify the brand colors and fonts in the instructions, then upload the logo or use a supported custom template. After export, check font availability, exact color values, logo clear space, contrast, and fallback behavior on another computer.
Can Tosea AI match an old company presentation style?
It can use a representative company deck or page as design guidance. That does not mean permanent model training. For stronger consistency, use an approved custom template and compare the result with the company's brand and accessibility standards before distribution.
Does Tosea AI preserve PowerPoint formatting after export?
Editable PPTX export is designed to stay close to the generated preview while keeping elements available for editing. Fonts, complex graphics, and the application used to open the file can affect the result. Test the exported file in the actual presentation setup.
Can I change only the layout and keep the exact wording?
Yes. Layout Only changes the visual structure without intentionally rewriting approved copy. Compare the result with the source and verify statistics, citations, footnotes, labels, and line breaks before sending the deck.
Turn the three frameworks into one decision-ready deck
A Bain-style strategy consulting PowerPoint should make three things easy to inspect: why the priorities matter, how they behave under uncertainty, and whether the organization can execute them. KSF analysis, scenario analysis, and Organizational DNA provide that sequence when the deck keeps the scoring rules, evidence, assumptions, and ownership visible.
Use Tosea AI to move from source files to an outline, editable data visuals, controlled layouts, and an editable PPTX. For more frameworks in the same format, see the PwC-style management consulting frameworks and the McKinsey 3C and value chain guide.
Sources
- Chief executives define their own data needs — J. F. Rockart, Harvard Business Review, 1979 (indexed abstract, National Library of Medicine)
- Decision-Making Under Deep Uncertainty — U.S. Climate Resilience Toolkit
- Org DNA Profiler — Strategy&, part of PwC
- Data Studio and Layout and diagrams — Tosea AI Help Center