How to Build a PwC-Style Management Consulting PowerPoint with AI: 6 Practical Frameworks
Build a PwC-style management consulting PowerPoint with AI using six frameworks: BSP, capability assessment, GMSS, decision matrix, stakeholder analysis, and force field analysis.
A PwC-style management consulting PowerPoint turns a management question into a traceable decision: the evidence is visible, the logic is testable, and the recommended action has an owner. Tosea AI helps professionals reach that standard faster by turning source files into an editable outline, letting them select a layout or diagram before rendering, converting data into reusable charts, and supporting further layout changes after slides are generated.
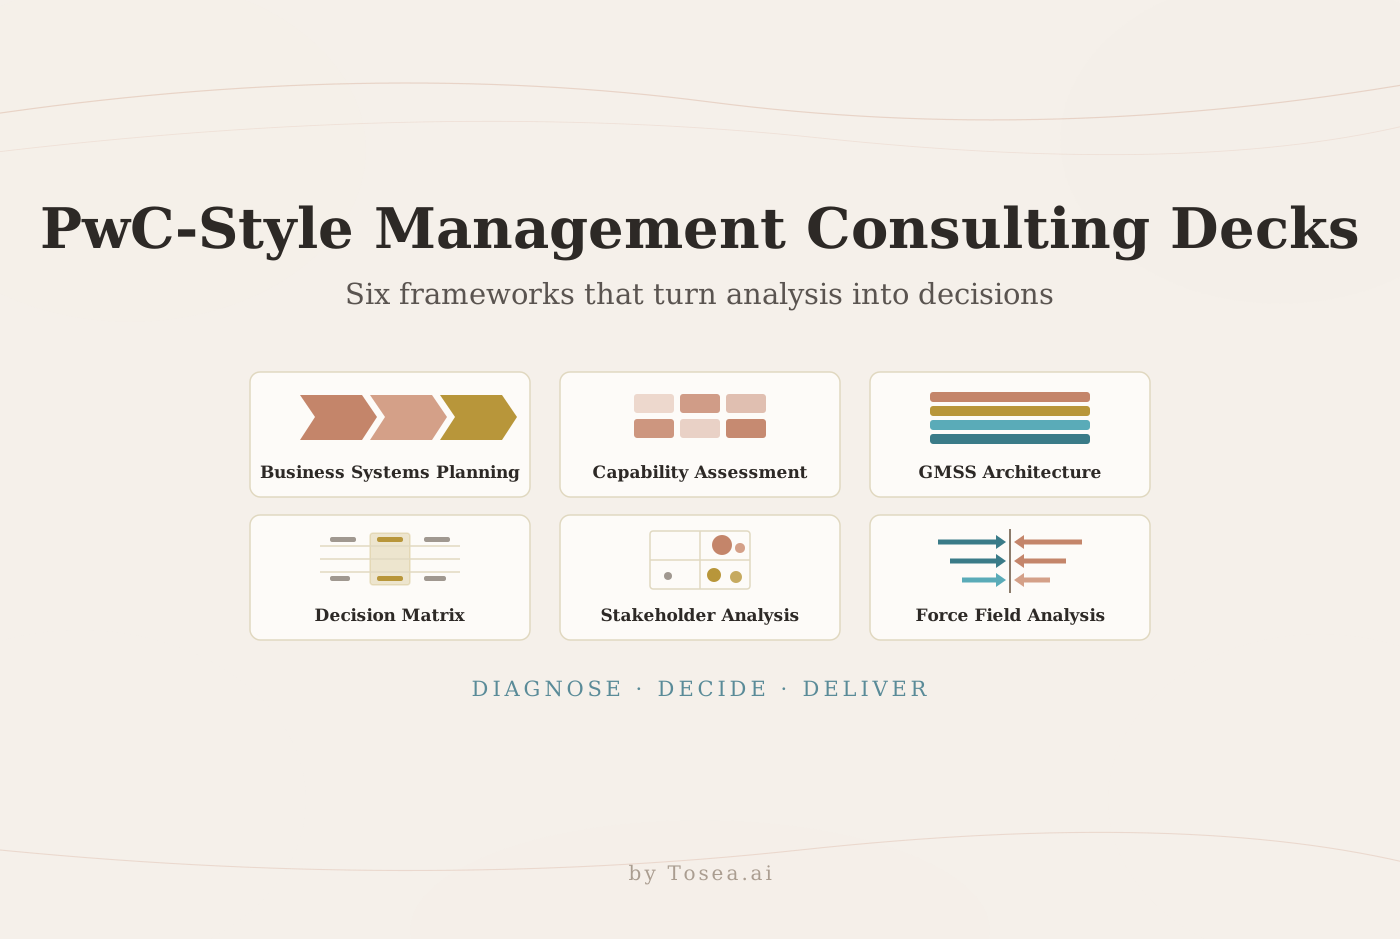
This guide covers six tools for planning, capability diagnosis, option selection, stakeholder engagement, and change delivery. Each section includes an original slide and a reusable prompt.
The slide examples below are original editorial references built with illustrative data. They are not PwC templates, and Tosea AI is not affiliated with or endorsed by PwC.
Quick answer: match the framework to the decision
| Management question | Best starting framework | Primary output |
|---|---|---|
| Which processes and data should an information systems roadmap prioritize? | Business Systems Planning | Process and data roadmap |
| Which internal capabilities could block the strategy? | Enterprise self-assessment | Capability gap heatmap |
| How should management signals reach decision makers? | GMSS architecture | Decision support stack |
| Which option performs best against agreed criteria? | Decision matrix | Weighted option ranking |
| Who can affect delivery and how should they be engaged? | Stakeholder analysis | Power-interest map and engagement plan |
| What will accelerate or restrain the change? | Force field analysis | Prioritized change actions |
Every slide still needs defined measures, sources, assumptions, an action title, and a management implication.
1. Business Systems Planning for an information systems roadmap
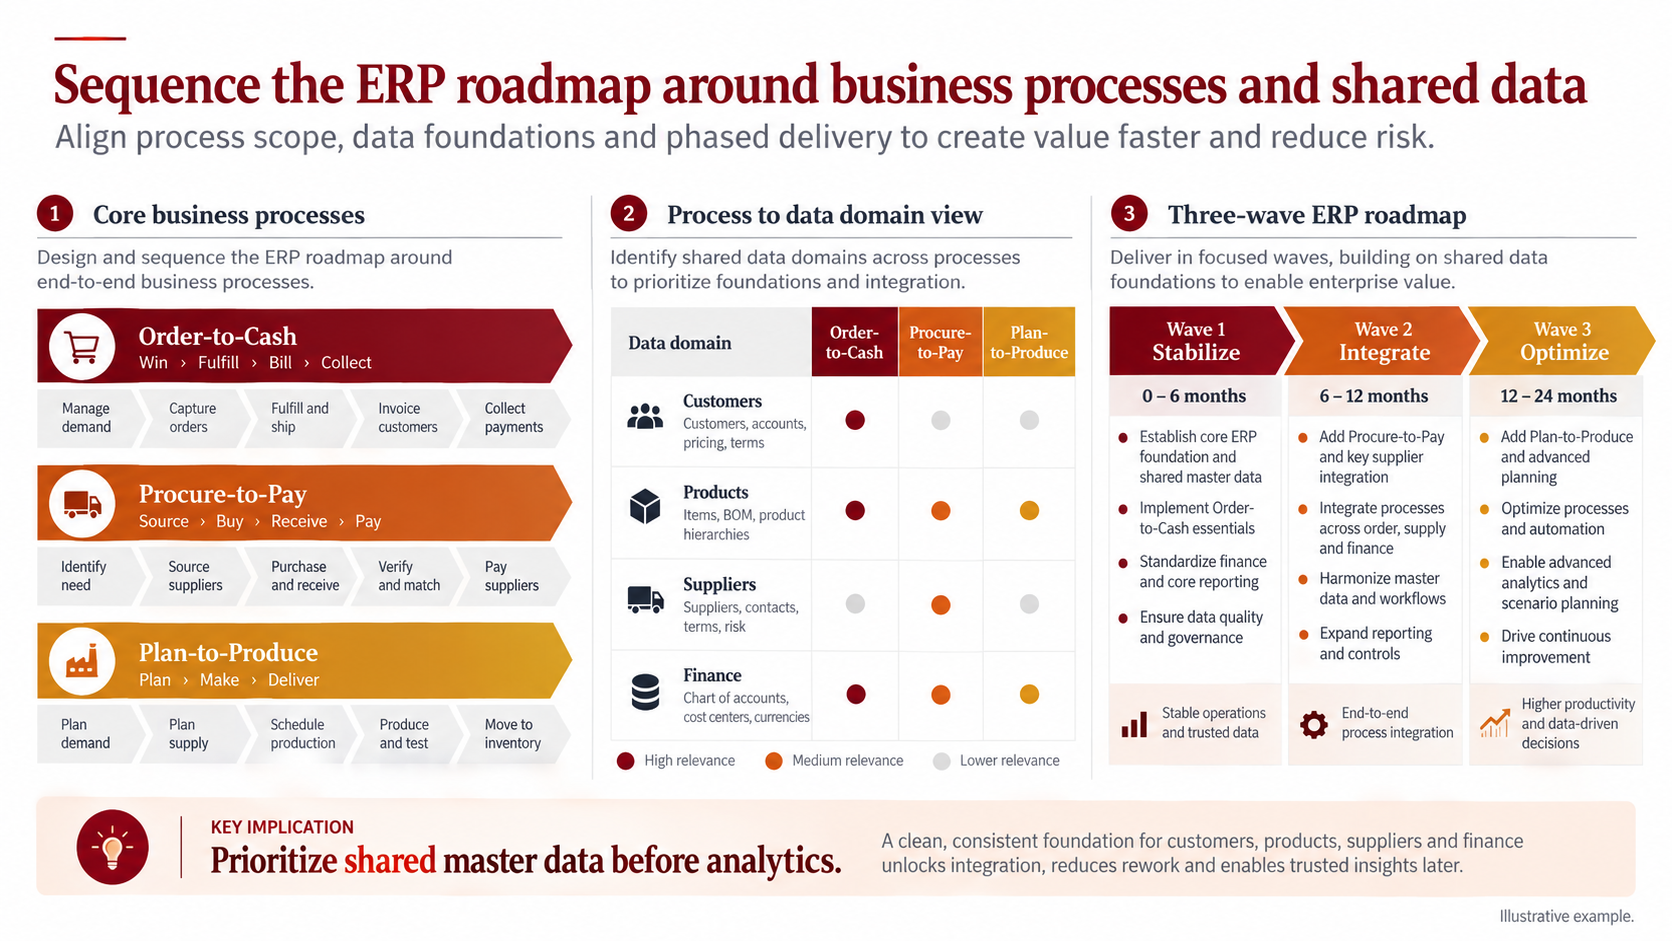
Business Systems Planning, or BSP, is an IBM-associated approach for aligning information systems with business processes and information needs. It identifies processes and data classes, studies information support, and converts gaps into an implementation plan. See the historical IBM Information Systems Planning Guide.
Use BSP to sequence an ERP program, data platform, or application portfolio. Collect process ownership, pain points, dependencies, data domains, constraints, and delivery capacity. Connect end-to-end processes, shared data, and implementation waves to explain why one capability precedes another.
The most persuasive BSP slides make the dependency logic explicit. If customer, product, supplier, and finance master data are shared across order-to-cash, procure-to-pay, and plan-to-produce, the first wave should stabilize that shared foundation before analytics or optimization. A roadmap that starts with dashboards usually inherits inconsistent definitions and has to be reworked.
Reusable AI prompt
Create one 16:9 information systems roadmap slide from the supplied process inventory, application map, data domains, risks, and timing. Show core processes, a process-to-data matrix, and three implementation waves. Write an action title, flag missing evidence, label assumptions, and never invent dependencies. Use burgundy, orange, amber, charcoal, and white.
2. Enterprise self-assessment for capability gaps
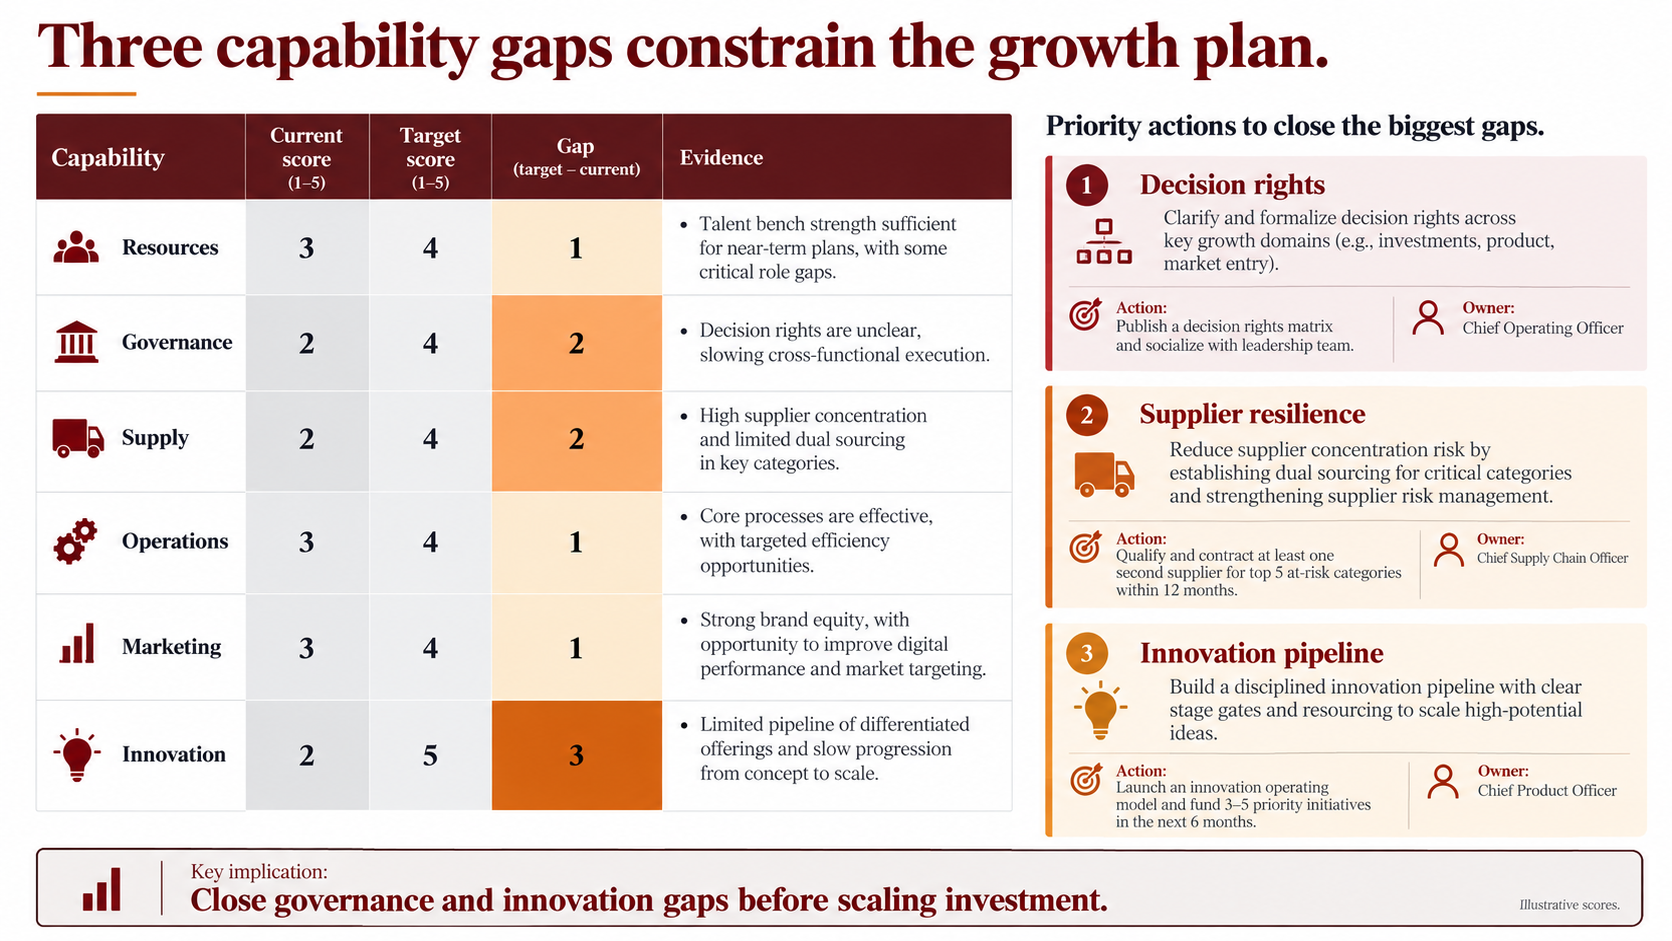
An enterprise self-assessment is not one standardized branded framework. It compares current capabilities with the level required by the strategy across resources, governance, supply, operations, marketing, innovation, risk, and technology.
Use it before a transformation, market entry, or operating model change. Define the scoring rubric first, request evidence, and separate current from target state. Highlight only material gaps, then add an action, owner, and timing.
In the example slide, the gap column is simply target minus current score: governance and supply each show a gap of 2, and innovation a gap of 3, which is why those three capabilities become the priority actions. Showing the arithmetic lets a reviewer challenge a score rather than the conclusion. When interviewees disagree, mark the score as disputed instead of averaging conflicting views into a false consensus.
Reusable AI prompt
Create a capability assessment slide from the interviews and operating data. Score six named capabilities from 1 to 5 using the supplied rubric. Compare current and target scores, cite evidence, and highlight the three largest gaps. Add an action and owner. Mark disputed scores instead of averaging conflicting evidence.
3. GMSS as an integrated management support architecture
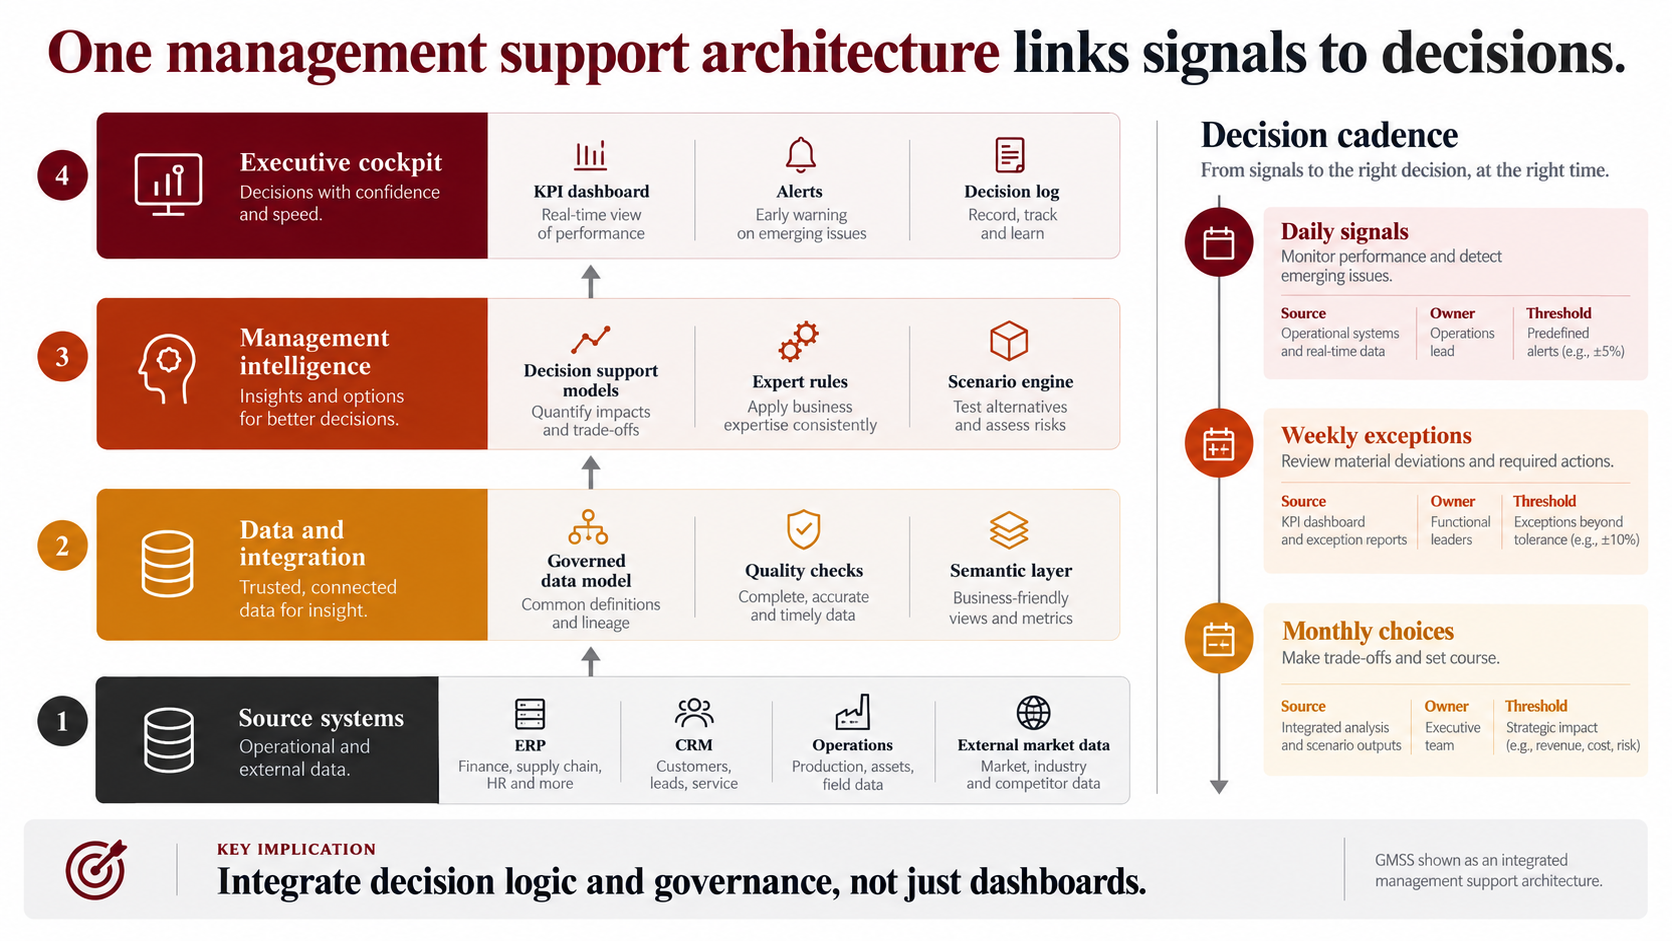
Global Management Support System, or GMSS, is best treated as an architecture concept, not a universally accepted method. It combines decision support, expert rules, and executive information. The question is how raw signals become trusted information, modeled options, alerts, decisions, and recorded outcomes.
Use it for multinational reporting, control towers, or executive decision rooms. Document sources, definitions, controls, model owners, thresholds, decision rights, and cadence. Show the chain from source to action and where human review is required.
A useful test for a GMSS slide is whether a reader can trace one metric from its source system to the meeting where it changes a decision. If the slide shows dashboards but not thresholds, owners, or a decision log, it describes reporting rather than management support.
Reusable AI prompt
Create an integrated management support architecture with four layers: sources, governed data, decision support and expert rules, and executive cockpit. Add daily, weekly, and monthly cadence with source, owner, and threshold. Separate automated alerts from human approvals. Show lineage and control gaps. Do not present GMSS as a standardized product.
4. Decision matrix for transparent option selection
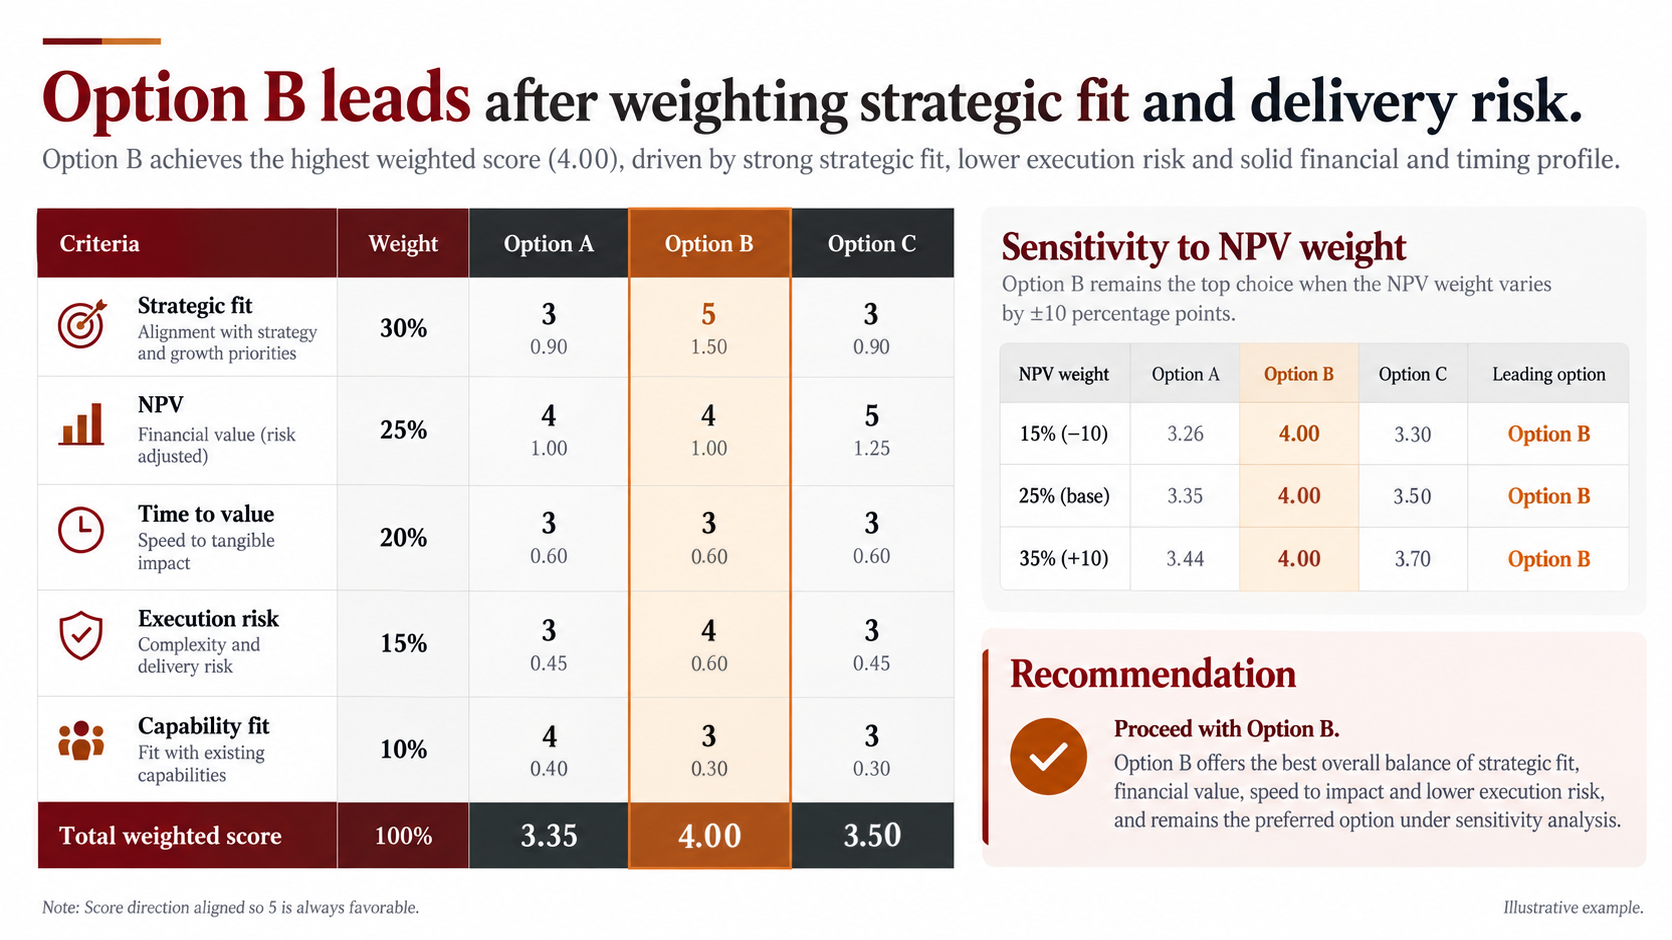
A decision matrix compares alternatives against weighted criteria. The American Society for Quality describes it as a tool for evaluating and prioritizing options. Normalize weights to 100 percent, align scoring direction, multiply scores by weights, and sum the results.
Use it for vendor selection, site choice, market entry, or portfolio prioritization. Agree on criteria before scoring and test sensitivity. A high total supports discussion but does not replace judgment about dependencies, threshold risks, or evidence quality.
A worked example. The slide below weights five criteria at 30, 25, 20, 15, and 10 percent. Option B scores 5, 4, 3, 4, and 3, so its weighted total is 1.50 + 1.00 + 0.60 + 0.60 + 0.30 = 4.00. Option A totals 3.35 and Option C 3.50. The sensitivity panel moves the NPV weight 10 points in each direction and rescales the other four weights proportionally so they still sum to 100 percent. Option C, which has the strongest NPV score, rises from 3.30 to 3.70 as the NPV weight increases but never overtakes Option B. Option B stays at 4.00 because its NPV score equals the weighted average of its other scores. That is a useful reminder: sensitivity depends on how an option's strengths are distributed, not only on its total.
Reusable AI prompt
Build a weighted decision matrix for three options using supplied criteria, weights, evidence, and 1-to-5 rules. Show each weighted contribution and verify that weights total 100 percent. Test the two most uncertain weights. Highlight the leader, threshold risks, and why management should accept or reject the ranking.
Before publishing any matrix, recompute every row and total from the displayed scores and weights. Totals that do not reconcile with the visible cells are the fastest way to lose a steering committee's trust.
5. Stakeholder analysis for delivery risk
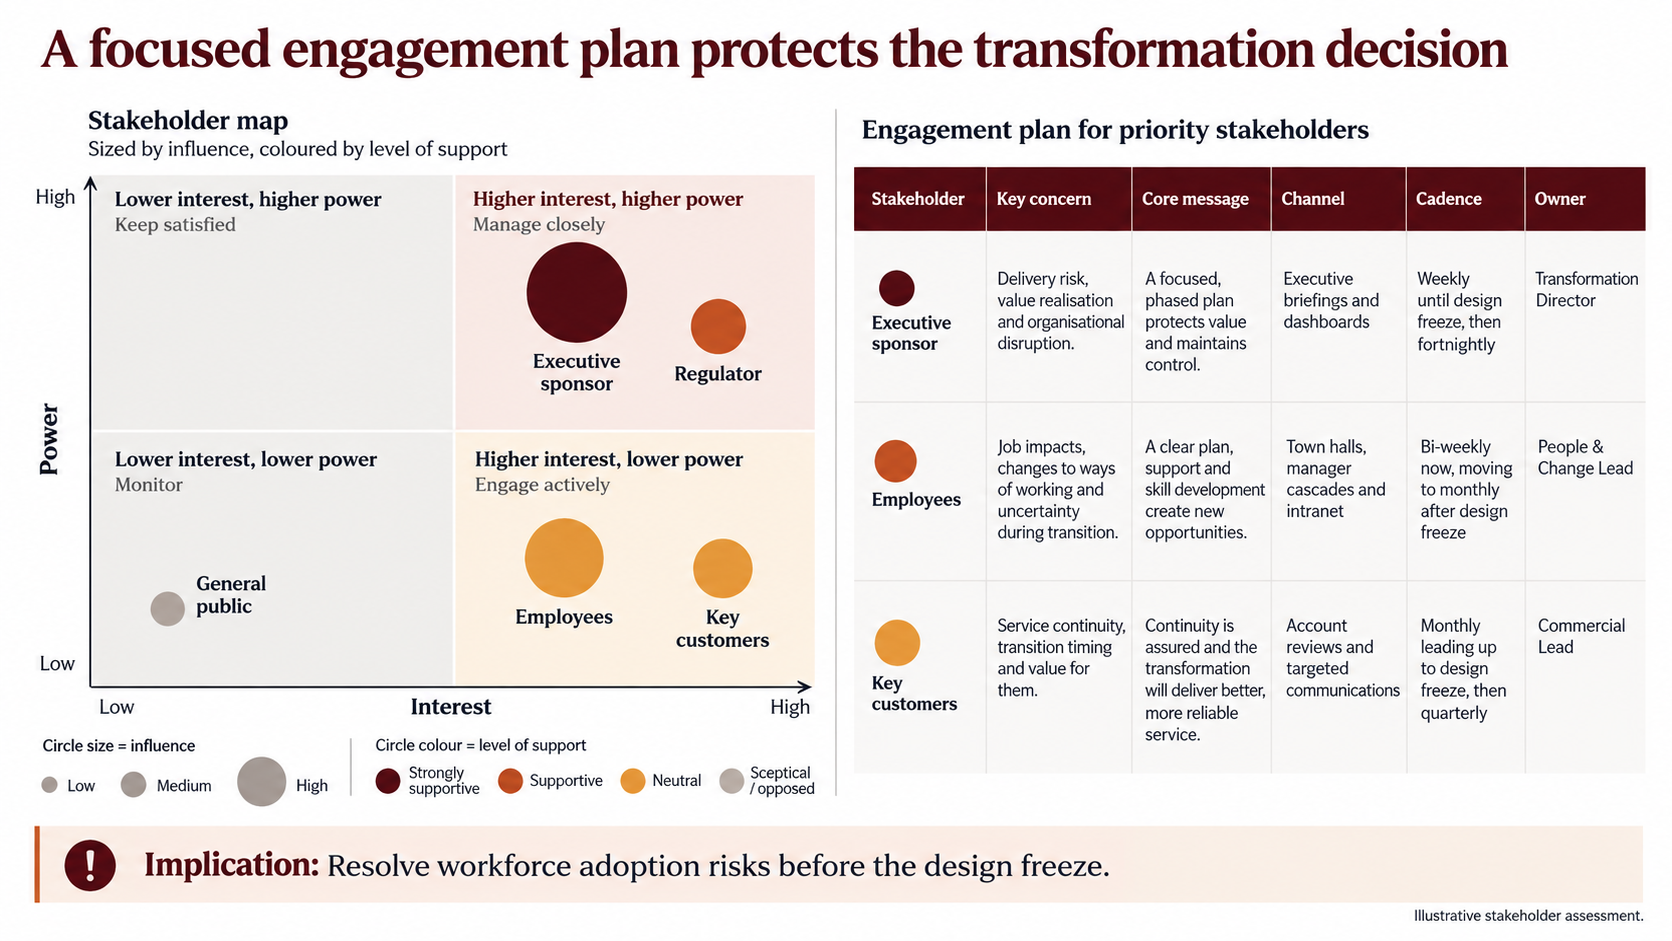
Stakeholder analysis identifies who can affect or is affected by a decision, then assesses interests, influence, concerns, support, and engagement needs. A Project Management Institute conference paper on stakeholder management links the analysis directly to project risk, influence, and communications planning.
Use it for transformations, policy changes, integrations, and restructurings. Beyond a power-interest map, add concern, message, channel, cadence, owner, and changing sentiment. Reassess at major decision gates, because the map is dynamic: a regulator with low interest today can become the most important stakeholder after a scope change.
Reusable AI prompt
Create a stakeholder slide from the transformation plan. Map power and interest, size markers by influence, and color them by support. Add an engagement plan with concern, message, channel, cadence, and owner. Cite evidence for each placement. Flag missing voices and conflicts between formal and informal influence.
6. Force field analysis for practical change actions
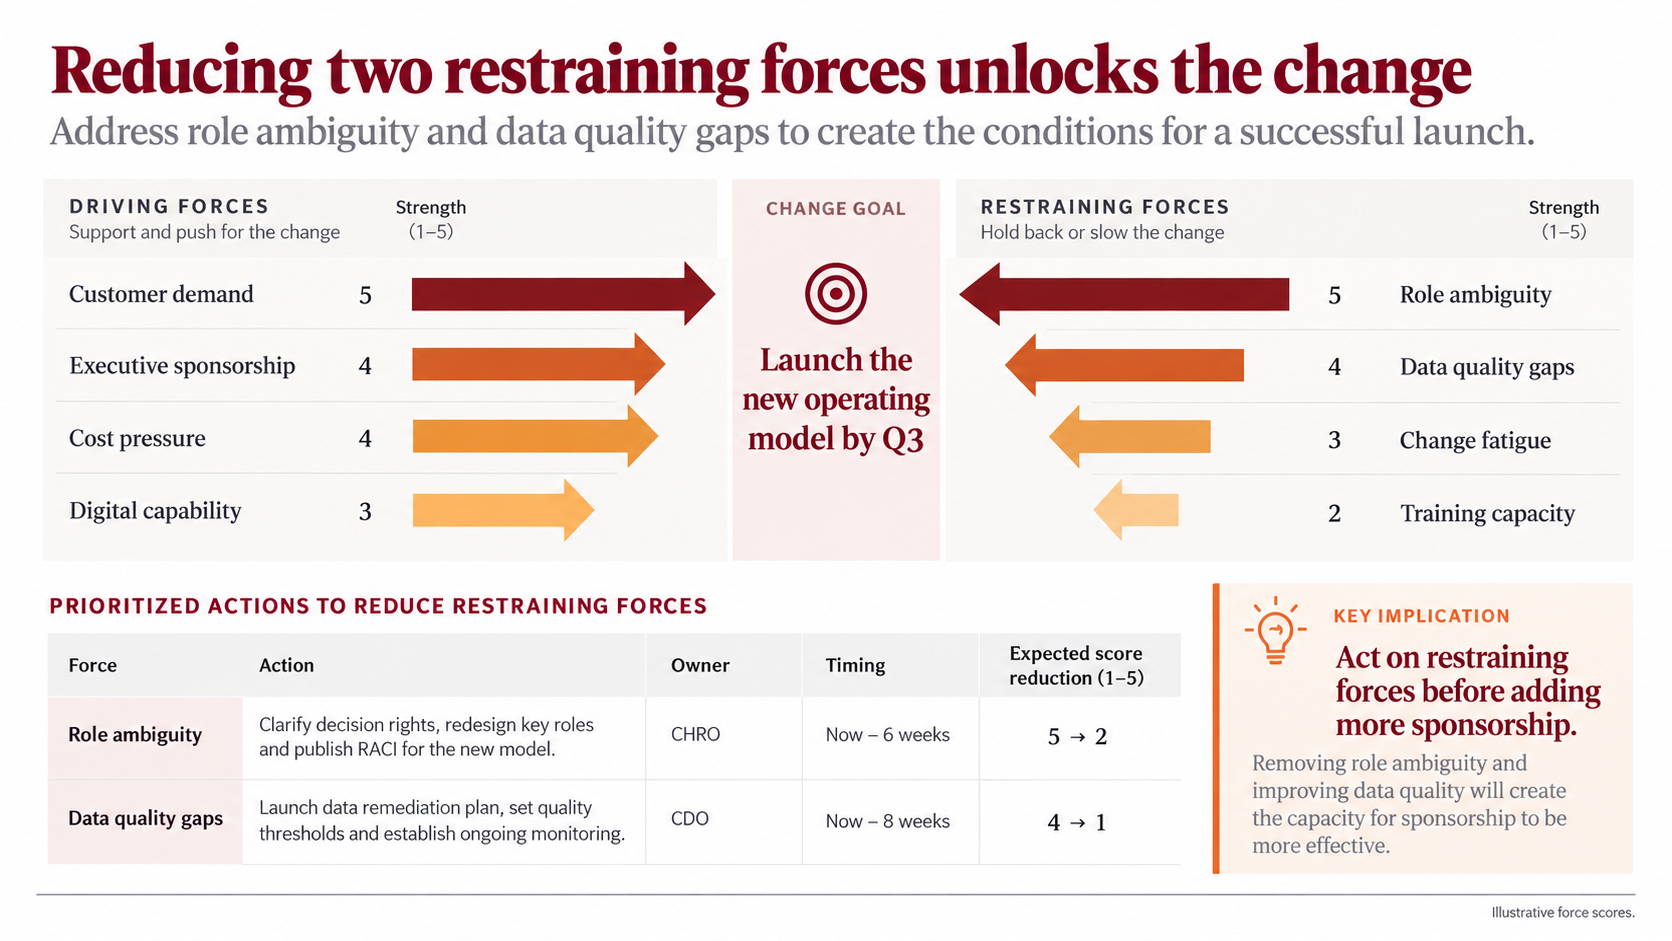
Force field analysis separates forces that drive change from those that restrain it. Associated with Kurt Lewin, its driving and restraining logic also appears in a Joint Commission International infection-prevention toolkit.
Use it when a sponsored change remains stuck. Define one goal, score evidence-backed forces consistently, and focus on forces the team can influence. Re-score after intervention so the page becomes a management instrument, not a workshop souvenir. In the example, driving forces total 16 and restraining forces 14; reducing role ambiguity from 5 to 2 and data quality gaps from 4 to 1 would cut the restraining total to 8, which is a clearer argument than adding more sponsorship.
Reusable AI prompt
Create a force field slide for the stated goal. Separate evidence-backed driving and restraining forces, score each from 1 to 5, and scale arrow length to strength. For the two most actionable restraints, add action, owner, timing, and expected reduction. Separate facts from perceptions and cite each score.
How the six frameworks fit one storyline
The frameworks are most useful when they answer consecutive questions in one deck rather than appearing as six disconnected pages. A practical sequence for a transformation steering committee looks like this:
- Diagnose: the capability assessment shows which gaps constrain the strategy.
- Design: BSP sequences the systems and data work those gaps require, and the GMSS architecture defines how progress signals will reach decision makers.
- Decide: the decision matrix compares the delivery options against agreed criteria.
- Mobilize: stakeholder analysis shows who must be engaged for the chosen option to land.
- Deliver: force field analysis identifies the restraints to remove first.
Each page should end with an implication that sets up the next page. For more on building that connective narrative, see our BCG-style storyline guide and the cognitive architecture of McKinsey deck logic.
Five mistakes that weaken framework slides
- Naming the framework instead of the finding. "Stakeholder analysis" is a label; "Workforce adoption is the main delivery risk" is a title.
- Scores without a rubric. A 3 out of 5 means nothing unless the slide or appendix defines what 3 requires.
- Totals that do not reconcile. Weighted sums, gaps, and force totals must recompute from the visible cells.
- Illustrative data presented as fact. Label estimated, forecast, and example figures on the page.
- No owner or timing. A framework slide without an action, owner, and date is analysis without a decision.
Use Tosea AI Data Studio for evidence, not screenshots
A pasted chart image cannot be audited, restyled, or updated efficiently. Tosea AI Data Studio can recognize chart values and accept Excel or CSV data. Users review the grid, choose a chart, apply the deck palette, and keep the visual reusable.
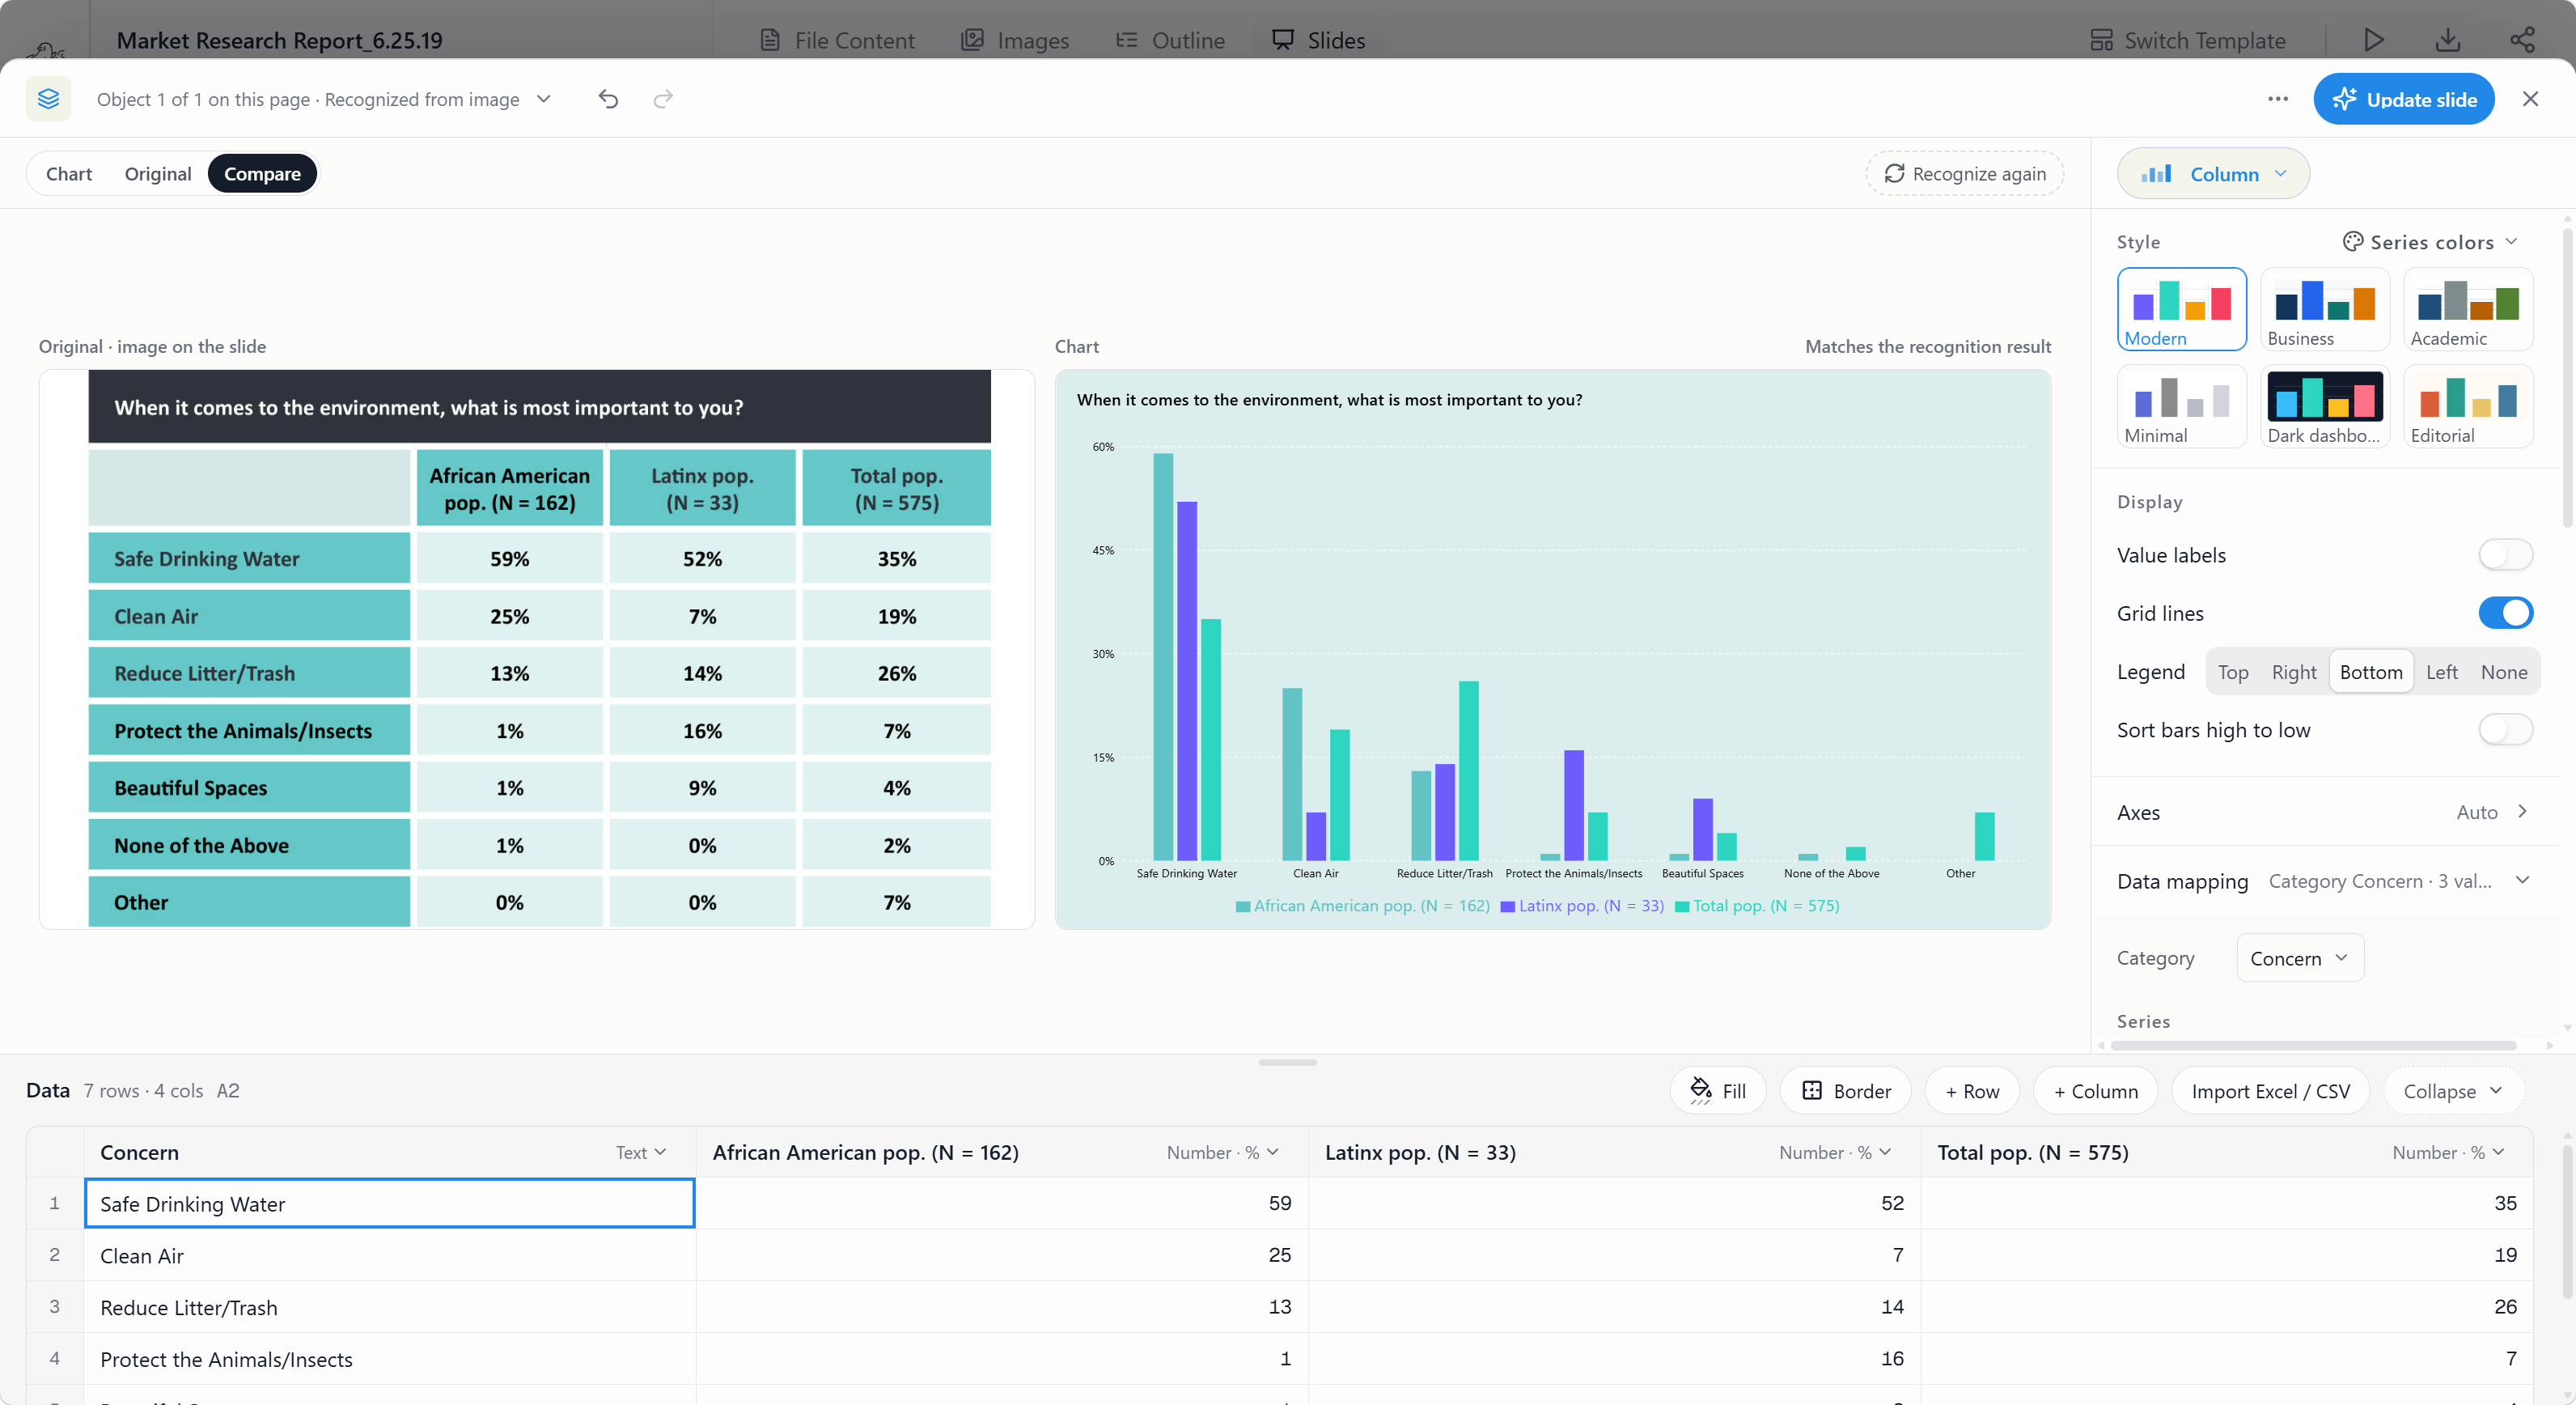
Use it for capability scores, option weights, stakeholder surveys, and force ratings. Reconcile values, units, periods, samples, and definitions before publication.
Choose layouts before rendering and refine them afterward
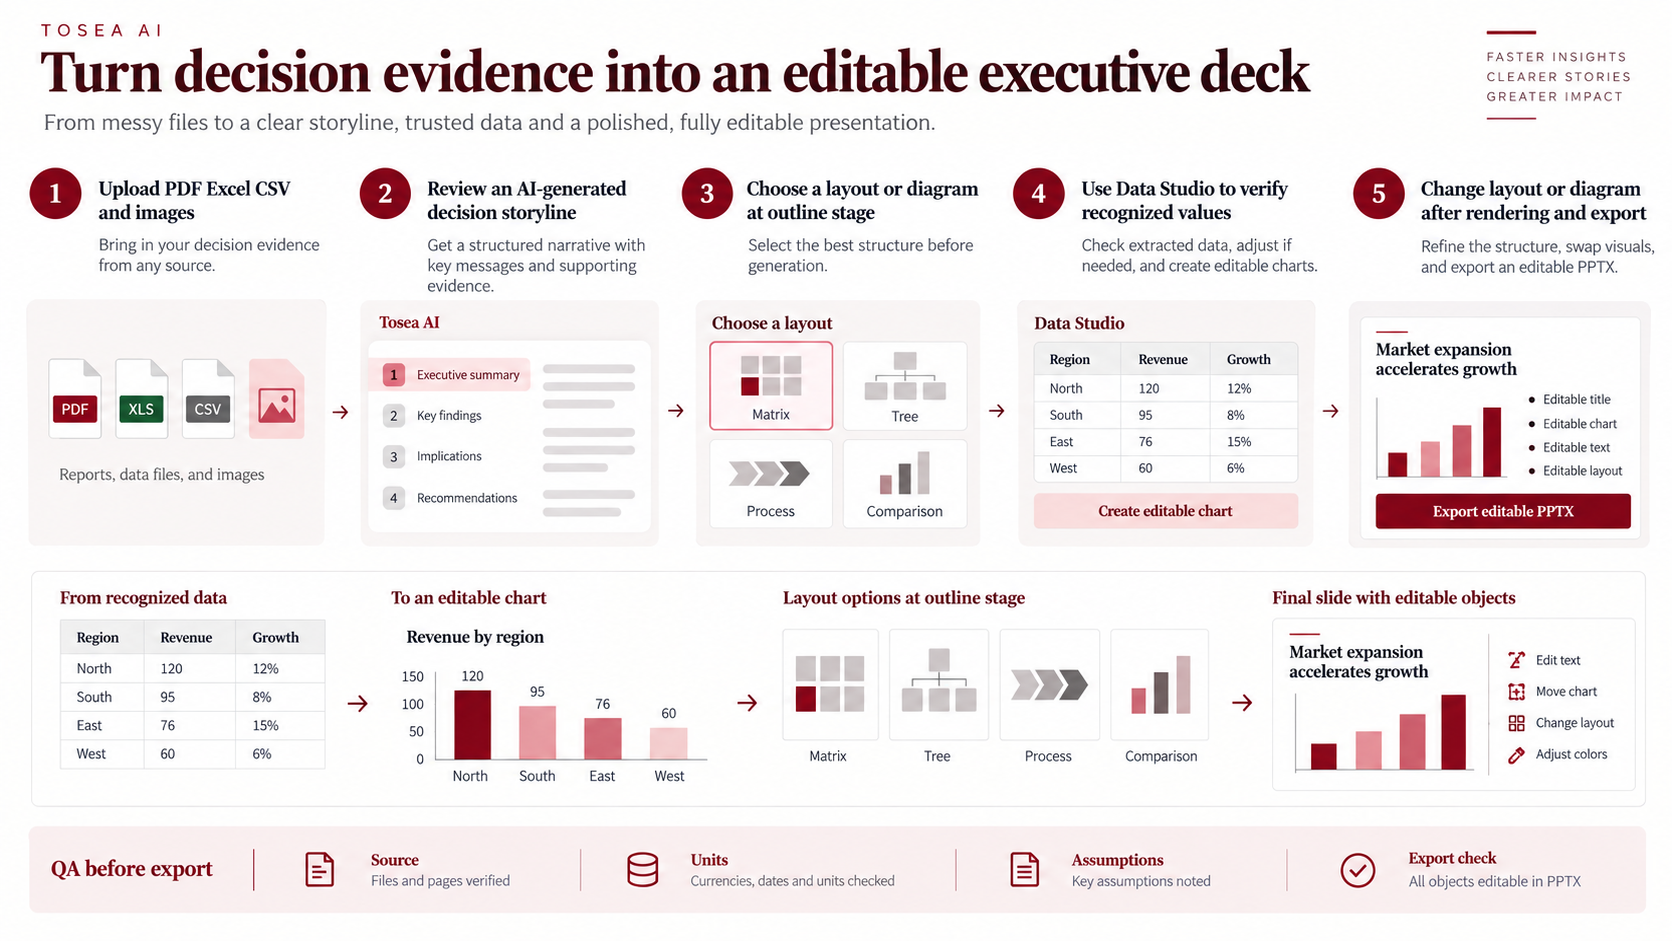
During the outline stage, select a layout that matches the reasoning: matrix for options, heatmap for gaps, layered architecture for GMSS, or opposing arrows for force analysis.
After rendering, use Layout / Diagram to change structure without rebuilding. Use Layout Only when wording must remain unchanged. Recheck labels, notes, citations, and element completeness.
Final quality check for a PwC-style management consulting PowerPoint
- Make the title state the finding, not merely name the framework.
- Show the evidence that supports the conclusion on the same page.
- Define scales, weights, scoring direction, and thresholds.
- Label illustrative, estimated, forecast, and externally sourced figures.
- Add the decision implication, owner, timing, and unresolved risk.
- Keep the warm accent palette selective; color should signal meaning.
- Open the exported PPTX in the delivery environment and inspect every slide.
Frequently asked questions
Can Tosea AI redesign my existing PowerPoint without changing the content?
Yes. Export the PowerPoint as a PDF, upload it, and request a redesign that preserves the wording. Use Layout Only to refresh structure without rewriting. Confirm that labels, footnotes, and elements remain complete.
How do I upload a PowerPoint and ask Tosea AI to redesign each slide?
Export it as a PDF, upload it, and request slide-by-slide redesign while preserving content and sequence. Choose a template or visual direction, generate, and inspect every slide before export.
Can I upload my own PowerPoint template to Tosea AI?
Tosea AI supports custom templates on eligible paid plans. Configure one in the product workflow, then verify layouts, fonts, colors, logo placement, and master-slide rules.
Can Tosea AI use custom brand colors, fonts, and a logo?
Yes. Specify colors and fonts, then upload the logo or use a supported custom template. Verify fonts, color values, logo clear space, and contrast after export.
Can Tosea AI match the style of my old company presentations?
Tosea AI can use a representative deck as guidance, but this does not imply permanent model training. Use an approved custom template and compare results with current brand guidelines.
Does Tosea AI preserve PowerPoint formatting after export?
The editable PPTX is designed to stay close to the preview while keeping elements editable. Fonts, complex graphics, and applications can affect results, so test the delivery environment.
Can I tell AI to edit the layout only and keep the exact wording?
Yes. Layout Only changes visual structure without intentionally rewriting content. Compare with the source to verify labels, citations, footnotes, and line breaks.
Turn the frameworks into a working management deck
A PwC-style management consulting PowerPoint earns trust through disciplined reasoning, not through copied branding. Choose the framework that answers the management question, connect it to evidence, make uncertainty visible, and end with a decision or action.
Start with Tosea AI to convert reports and spreadsheets into an editable outline, select layouts and diagrams, build reusable charts in Data Studio, refine pages after rendering, and export an editable PPTX. For related guidance, read the practical PwC-style consulting deck guide, five advanced PwC-style strategy frameworks, six PwC-style enterprise management models, and the AI Think-Cell alternative guide.
Sources
- Business Systems Planning: Information Systems Planning Guide, second edition (GE20-0527-2) — IBM, October 1978, archived at bitsavers.org
- Decision matrix — American Society for Quality
- Stakeholder management — Deborah Vogwell, PMI Global Congress 2003—EMEA, Project Management Institute
- Evidence-Based Principles and Practices for Preventing Surgical Site Infections — Joint Commission International, 2018 (includes force field analysis)