How to Make a McKinsey Strategy Consulting PowerPoint with AI: 3C and Value Chain
Build a McKinsey-style strategy PowerPoint with AI using 3C and value chain analysis: four decision-ready slide examples, copyable prompts, a deck storyline, and an editable PPTX workflow.
A McKinsey strategy consulting PowerPoint works when every slide helps the audience make a decision. Design should make the logic easier to follow, but it cannot replace the logic. This guide shows how to turn the 3C model and value chain analysis into four decision-ready slides, sequence them into a strategy deck, reuse copyable AI prompts, and build the deck faster with Tosea AI Data Studio and one-click layout tools.
"McKinsey-style" is used descriptively here. The slide examples below are original editorial references built with fictional data. They are not McKinsey & Company templates, and Tosea AI is not affiliated with or endorsed by McKinsey & Company.
What the 3C Model and Value Chain Analysis Solve
The two frameworks answer different questions.
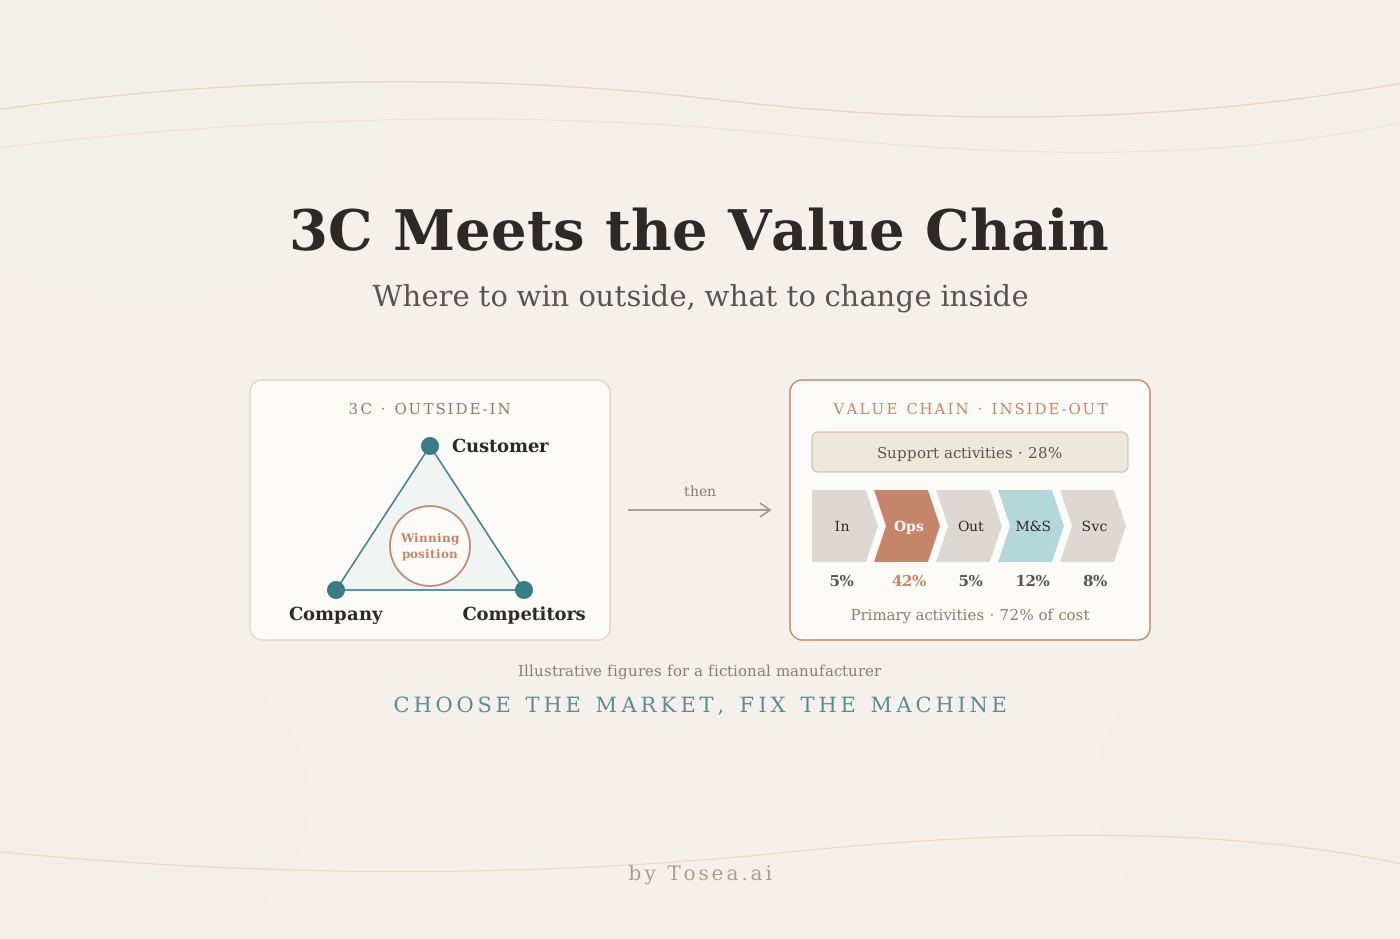
The 3C model tests whether a strategy can win in the market. It connects the customer, the company, and competitors. Kenichi Ohmae, who headed McKinsey's Tokyo office, set out this strategic triangle in The Mind of the Strategist; his official site describes the book as "a masterful analysis of company, customer, and competition." He also presented the model in the 1982 European Management Journal article The strategic triangle: A new perspective on business unit strategy. The practical question it asks is where company strengths, customer needs, and competitor offerings leave a position worth owning.
Value chain analysis looks inside the business. Michael Porter developed the framework to separate a company into strategically relevant activities and identify where costs, differentiation, and operational advantage are created. The Harvard Business School Institute for Strategy and Competitiveness describes it as a tool for disaggregating a company into those activities to find the specific ones that result in higher prices or lower costs.
Use 3C for market choice, positioning, customer segments, or competitive response. Use the value chain for cost reduction, process redesign, sourcing, service quality, or capability investment.
3C, Value Chain, Five Forces, or SWOT: Which Frame Fits the Slide?
Consultants rarely fail because they picked a bad framework. They fail because they picked one that answers a different question from the one on the table. A quick comparison helps before you open PowerPoint:
| Framework | Question it answers | Unit of analysis | Best slide form |
|---|---|---|---|
| 3C model | Where can we win, and against whom? | Customer segment, company, named rivals | Three evidence columns ending in one recommendation |
| Value chain | Which activities create our cost or differentiation gap? | Internal activities and their cost, time, or quality | Activity map with hotspots and an initiative table |
| Five Forces | How attractive is this industry structurally? | Industry and its bargaining relationships | Force-by-force rating with an industry verdict |
| SWOT | What should leadership keep in mind? | Mixed internal and external factors | Summary grid, usually in an appendix |
The 3C model and the value chain pair well because one looks outward and the other looks inward. Five Forces sits a level above both: it tells you whether the industry is worth fighting in at all. If the deck needs industry structure in more depth, our Bain-style SCP analysis guide covers that layer, and the GE McKinsey matrix guide handles portfolio prioritization across several business units.
How to Build a Strong 3C Analysis Slide
A useful 3C slide is not three lists around a triangle. It shows where the three perspectives overlap and states the strategic consequence.
Start with one decision question. Select only evidence that changes the answer: customer needs and purchase criteria, company capabilities and gaps, and competitor positions and likely responses. End with one management implication. If the reader cannot tell what to do differently, the framework is unfinished.
Each column should carry one quantified piece of evidence. The customer column needs market size, growth, or ranked purchase criteria. The company column needs a capability score or unit economics. The competitor column needs a positioning map or share data. Bullet points support the evidence; they do not replace it. For a longer treatment of evidence sources for each C, see our 3C strategy deck guide.
Use Case 1: 3C Market Entry Analysis
Market entry is a natural 3C application because attractiveness alone is not enough. A market can be large while remaining unattractive for a company without local distribution, regulatory readiness, or a credible point of difference.
The example evaluates entry into Germany. Customer demand is attractive: the fictional mid-market segment grows from €5.2 billion to €8.1 billion by 2027, a 16% compound annual growth rate, and healthcare and industrial services score highest on attractiveness. The company has a strong product, and competitors leave room in a compliance-led mid-market position. The constraint is local sales capability, which scores 2.0 out of 5. The recommendation becomes a partner-led launch in healthcare and industrial services rather than a broad national rollout.
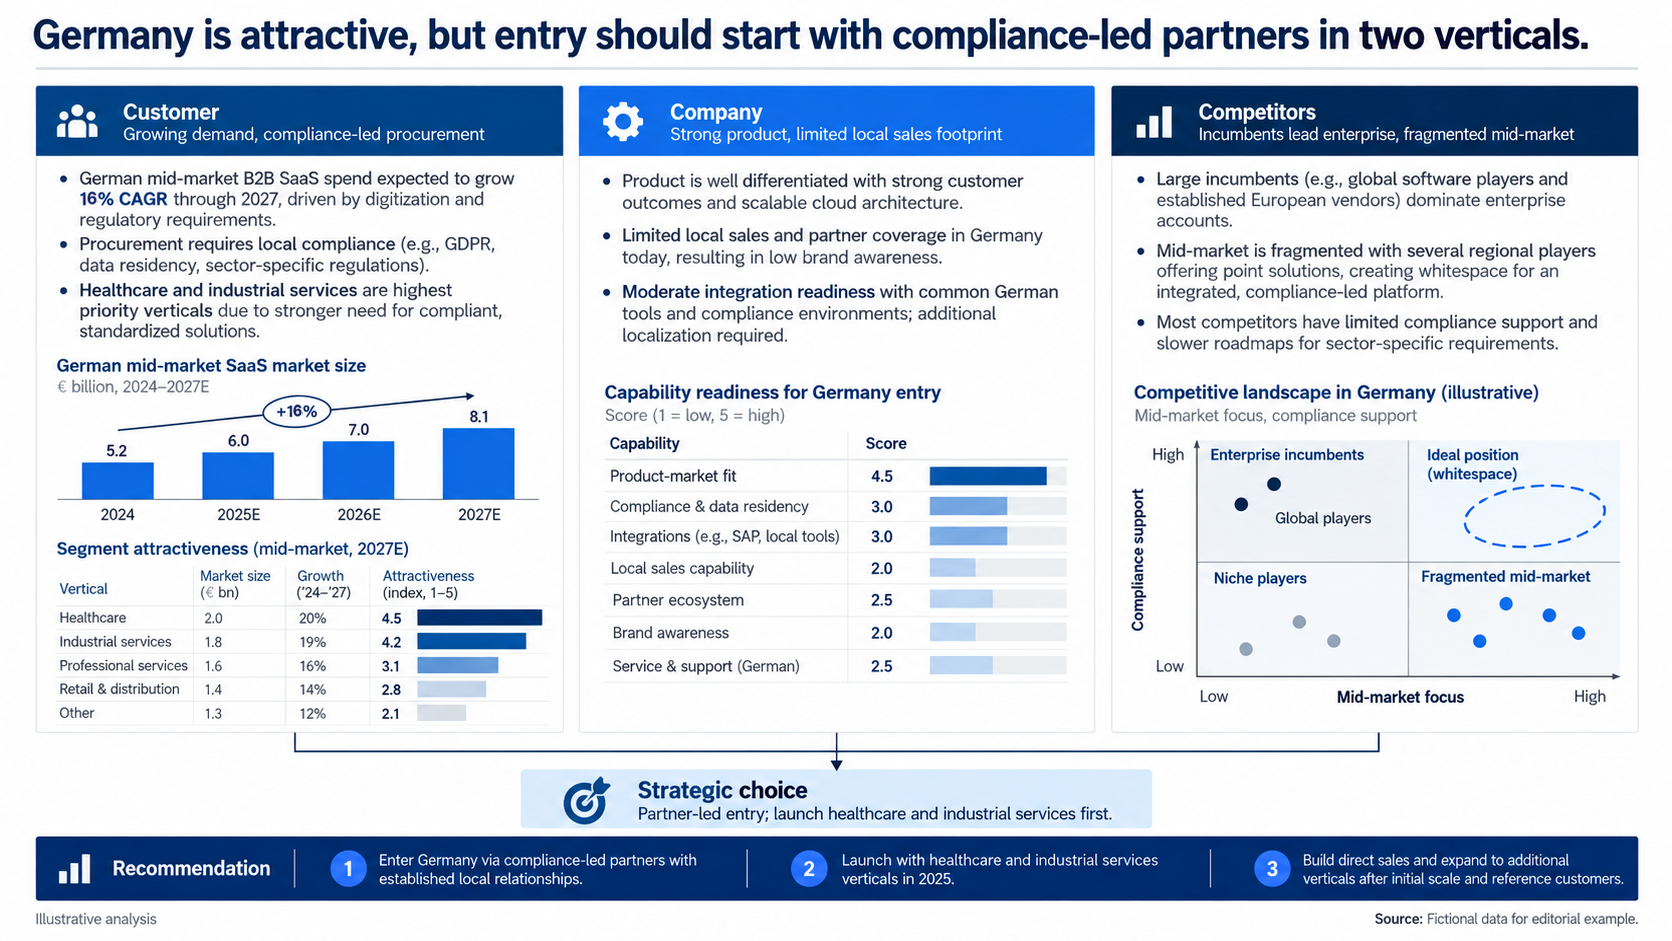
Illustrative example: fictional data. The five segment sizes add up to the €8.1 billion 2027E total, and the growth chart reflects the stated 16% CAGR.
Copyable AI Prompt for a 3C Market Entry Slide
Create one 16:9 executive strategy slide using a 3C analysis for market entry.

Decision: Should our company enter Germany, where should it start, and which route to market should it use?
Audience: CEO and growth committee.

Use Customer, Company, and Competitors sections plus a recommendation bar. Cover demand, priority segments, company economics and capabilities, leading competitors, channel advantages, and underserved spaces.

Use a conclusion-led title, navy and light blue, white background, and compact sources. Do not invent figures. Check that segment values add up to the market total and that growth labels match the chart. Mark missing evidence as data required.
Use Case 2: 3C Product Positioning
For positioning, the key overlap is not what customers want in general. It is the need your company can meet credibly and competitors do not already own.
The slide below applies this to a fictional urban EV charging subscription. Fleet customers rate uptime and reliability at 94 and coverage at 88 on a 100-point survey index, while the lowest price scores 55. The company has strong uptime analytics and a dense urban footprint, but weak fleet billing integration. Low-cost networks compete on price, while premium networks focus on individual consumers. The proposed position becomes reliable fleet charging with guaranteed uptime and consolidated billing, with fleet billing integration named as the execution risk to fix.
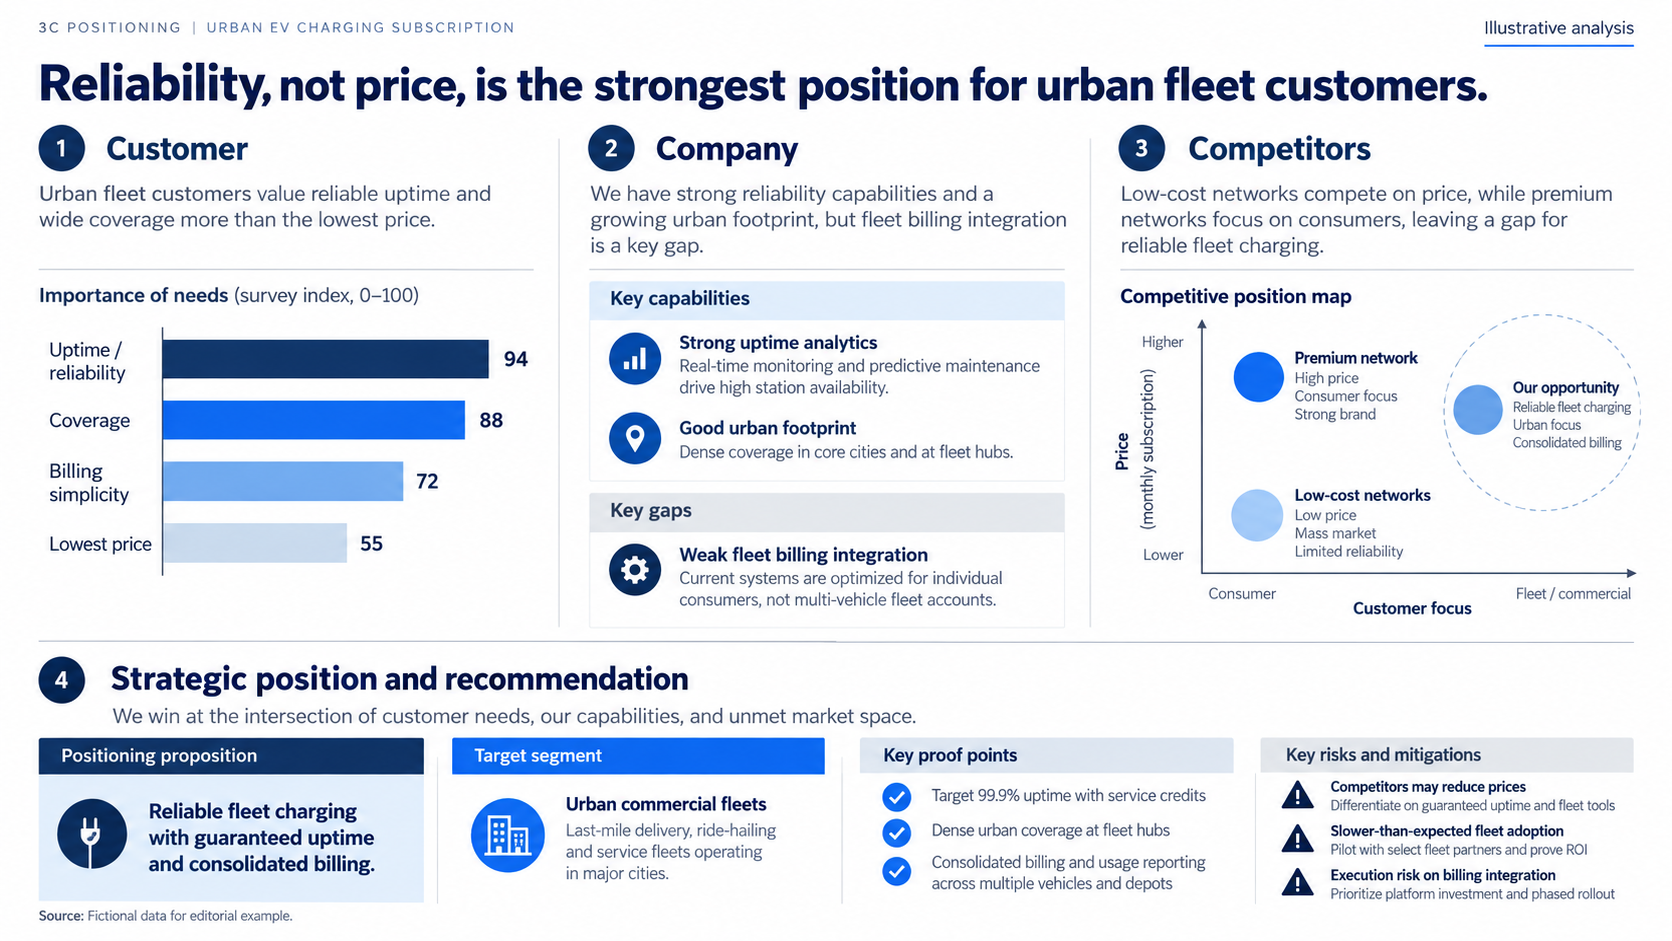
Illustrative example: fictional survey data. The gap in fleet billing appears as both a company weakness and a launch risk, which keeps the recommendation honest.
Copyable AI Prompt for a 3C Positioning Slide
Build one 16:9 product positioning slide using the 3C framework.

Decision: Which position should our EV charging subscription own with urban fleet operators?

Show ranked customer criteria, a company capability scorecard with gaps, and competitors on a two-axis map. Finish with one value proposition, three proof points, and the main risks with mitigations. Preserve numbers, units, dates, and sources. If evidence is insufficient, mark the position unproven. Use navy, cyan, and gray with a conclusion-led headline.
How to Build a Value Chain Analysis Slide
Porter's value chain separates primary activities from support activities. Primary activities are inbound logistics, operations, outbound logistics, marketing and sales, and service. Support activities are firm infrastructure, human resource management, technology development, and procurement.
A value chain slide becomes useful when each activity carries a number. Follow four steps:
- Define the business unit. A value chain for a whole conglomerate is too abstract to act on.
- Assign one metric per activity. Use cost share, cycle time, defect rate, or revenue contribution, and keep the metric consistent across activities.
- Compare with a reference point. A target, an internal best site, or a credible external benchmark turns a description into a gap.
- Connect the largest gaps to initiatives. Each initiative needs an owner, an estimated impact, and a readiness or risk rating.
Check that activity shares add up to 100% before anyone else does. A value chain where support activities say 28% and primary activities quietly add up to more than 72% loses the room immediately.
Use Case 3: Value Chain Cost Reduction
Cost programs often fail when management cuts every function by the same percentage. Value chain analysis exposes which activities drive the cost gap and which levers are operationally ready.
In this fictional medical-device example, operations carries 42% of total cost, and supplier design, line balancing, and demand planning explain most of the addressable gap. The slide separates support activities (28% of cost) from primary activities (72%), flags hotspots such as single-source components and low line utilization, and converts the analysis into three initiatives. Supplier redesign and line balancing carry low quality risk and are ready to launch. Demand planning carries medium risk because it requires process and system changes, so the recommendation is to pilot it first.
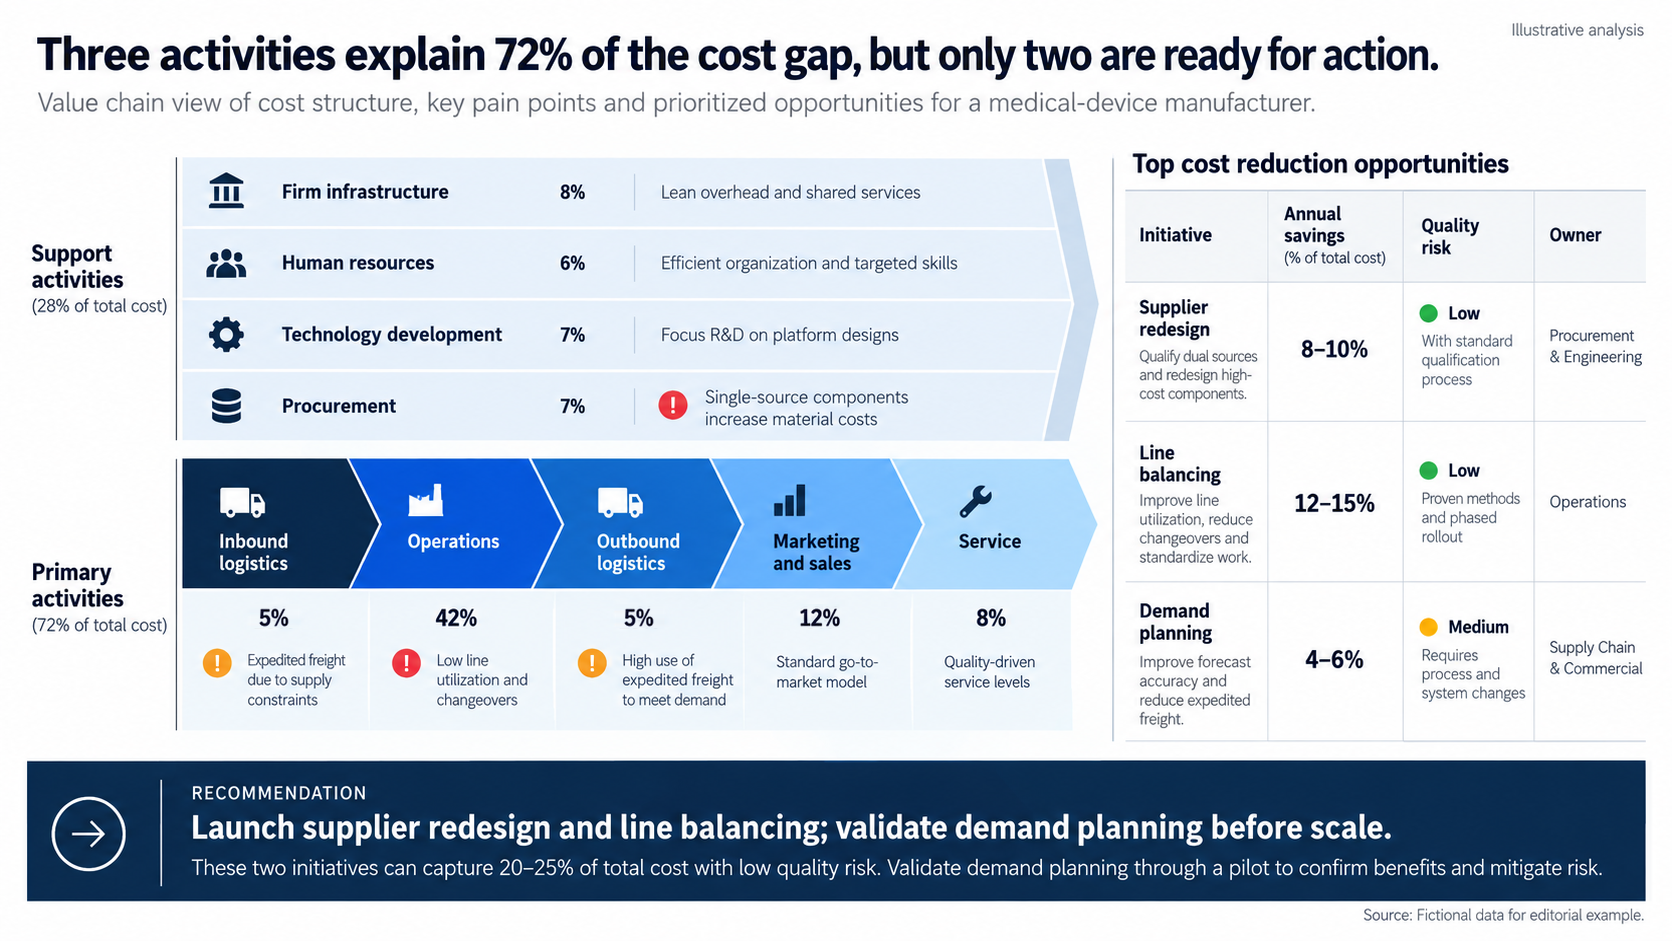
Illustrative example: fictional cost data. Support activities total 28% and primary activities 72% of cost.
Copyable AI Prompt for a Value Chain Cost Slide
Create one 16:9 value chain cost-reduction slide for a medical-device manufacturer.

Map support activities above primary activities. Show each activity's share of total cost and check that the shares add up to 100%. Highlight the three largest cost drivers. Add an action panel with initiative, impact, quality risk, owner, and dependency. State how much of the gap the priorities explain. Use navy and blue with orange for risk. Keep calculations traceable and do not fabricate benchmarks.
Use Case 4: Value Chain Digital Process Redesign
Digital transformation should not automate a broken process. Map the current journey first, identify delays and rework, then design the future state.
The example examines insurance onboarding. The current journey takes 12.4 days with nine handoffs and an 18% rework rate. Two bottlenecks, manual document validation and underwriting re-entry, account for 7.5 of those days, or 61% of the delay. The redesigned flow removes those handoffs before expanding automation, cutting cycle time to 6.8 days, rework to 8%, and handoffs to three, while straight-through processing rises from 22% to 48%.
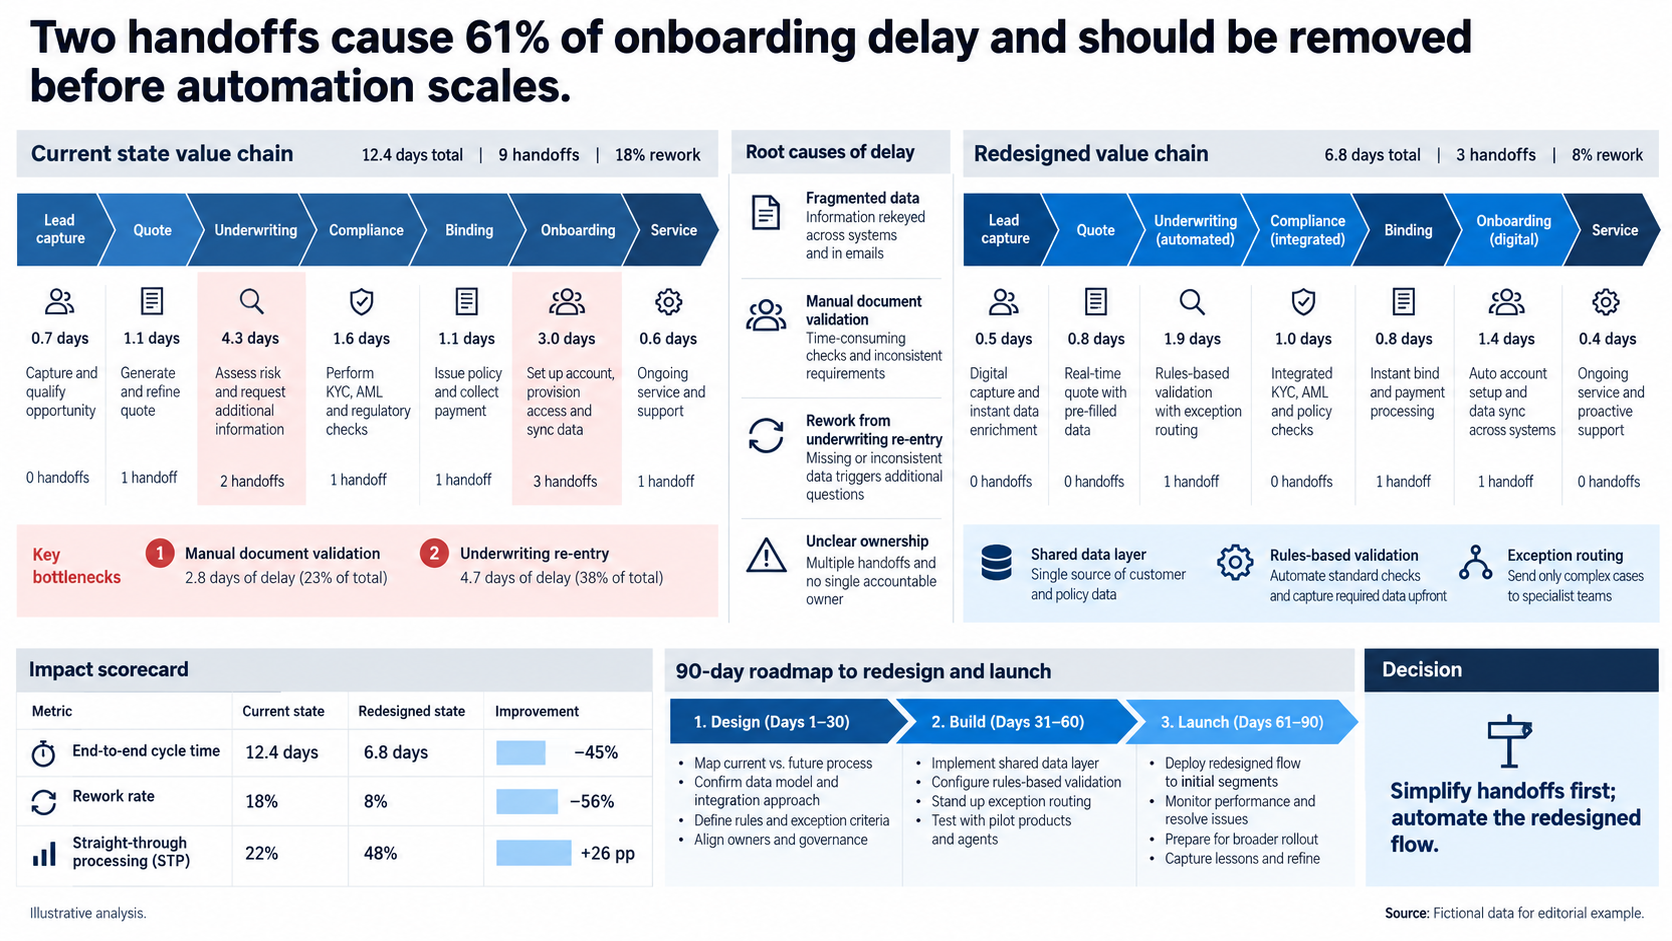
Illustrative example: fictional process data. Stage durations add up to each flow's total, and the scorecard improvements follow from the before-and-after values.
Copyable AI Prompt for a Digital Process Redesign Slide
Design one 16:9 digital process redesign slide for insurance onboarding.

Compare current and future flows. Label stages with cycle time, handoffs, rework, and automation. Highlight the two largest bottlenecks and compare KPIs. Sequence the recommendation as simplify handoffs, standardize data, then automate. Use navy and blue, thin connectors, and restrained icons. Preserve source data, check that stage times add up to the stated totals, and separate assumptions from facts.
How to Sequence 3C and Value Chain Across a Strategy Deck
In a larger strategy deck, use 3C first to establish where the business can win. Follow with value chain analysis to show what must change inside the business. This connects market logic to operating action without forcing both frameworks onto one crowded slide.
A typical nine-slide storyline looks like this:
- Executive summary: the decision, the recommendation, and the two or three reasons.
- Market context: demand, growth, and the segments that matter.
- 3C synthesis: the position the company can credibly own.
- Competitor deep dive: who will respond and how.
- Value chain baseline: where cost, time, or quality currently sit.
- Gap diagnosis: the activities that explain most of the gap.
- Initiatives: owners, impact, readiness, and dependencies.
- Roadmap and risks: sequence, milestones, and mitigations.
- Decision required: what leadership needs to approve today.
Every slide title should state a conclusion, not a topic. If you read only the titles in order, the argument should still make sense. We explain why this horizontal logic matters in our piece on the cognitive architecture behind consulting deck logic, and our guide to presenting research findings the McKinsey way shows the same structure applied to research results.
Common Mistakes in 3C and Value Chain Slides
- Three lists, no overlap. A 3C slide that lists customer, company, and competitor facts without naming the intersection is a description, not an analysis.
- Totals that do not reconcile. Segment sizes that do not sum to the market, or activity shares that exceed 100%, destroy credibility faster than any design flaw.
- Equal weight for every activity. Highlighting all nine value chain activities means highlighting none. Pick the two or three that explain the gap.
- Benchmarks without a source. An external benchmark with no origin is worse than an internal target that is clearly labeled.
- Recommendations without owners. An initiative with no owner, impact estimate, or next step is a wish.
- Automation before simplification. In process redesign, automating handoffs that should not exist locks in the delay.
Turn Source Data into Editable Charts with Tosea AI Data Studio
Consulting analysis changes repeatedly. A screenshot becomes a problem as soon as a manager asks for a different period, segment, color, or calculation.
Tosea AI Data Studio can recognize charts and tables from uploaded materials and convert them into editable data. You can also import Excel or CSV files and create column, stacked column, line, pie, scatter, heatmap, waterfall, and other common chart types. Values, labels, mappings, colors, axes, and display options remain available for revision.
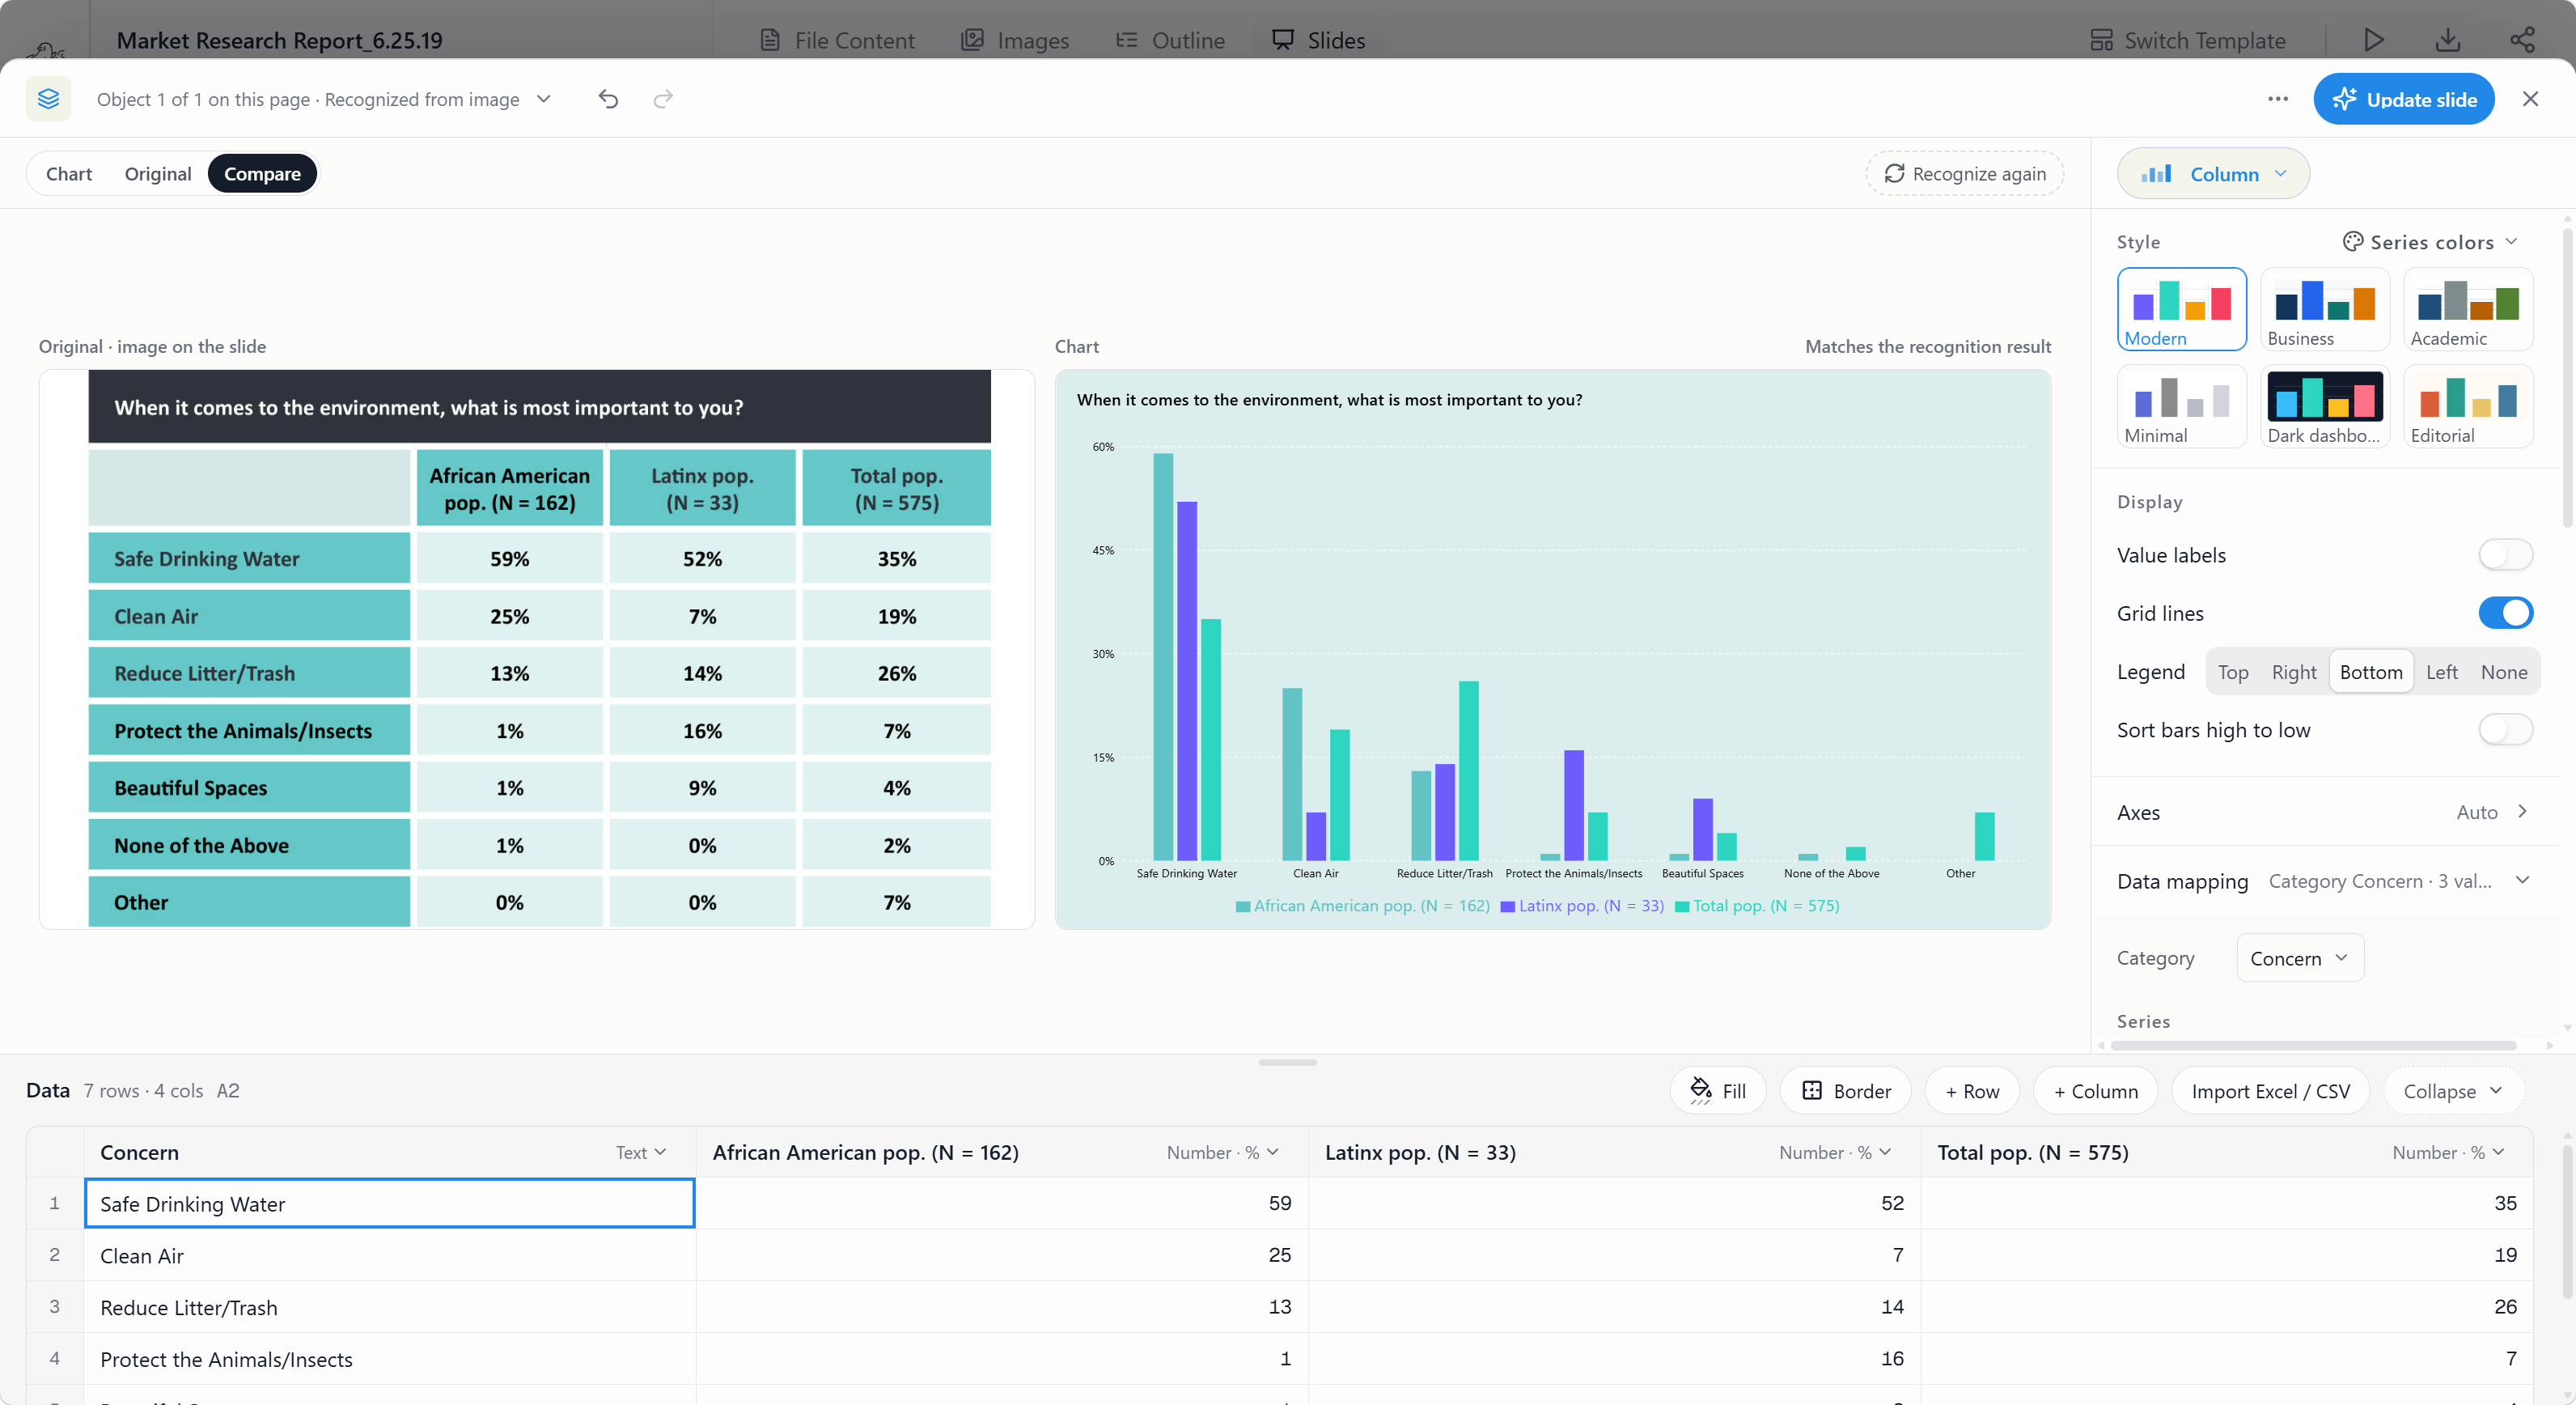
Use editable charts for segment growth, purchase criteria, competitor shares, cost gaps, cycle time, defect rates, and initiative impact. Bars compare categories, lines show time trends, scatter plots test relationships, and heatmaps expose two-dimensional patterns. For a deeper walkthrough of recognition, validation, and chart choice, read our guide to turning source data into editable PowerPoint charts.
Choose Layouts and Diagrams Before or After Generation
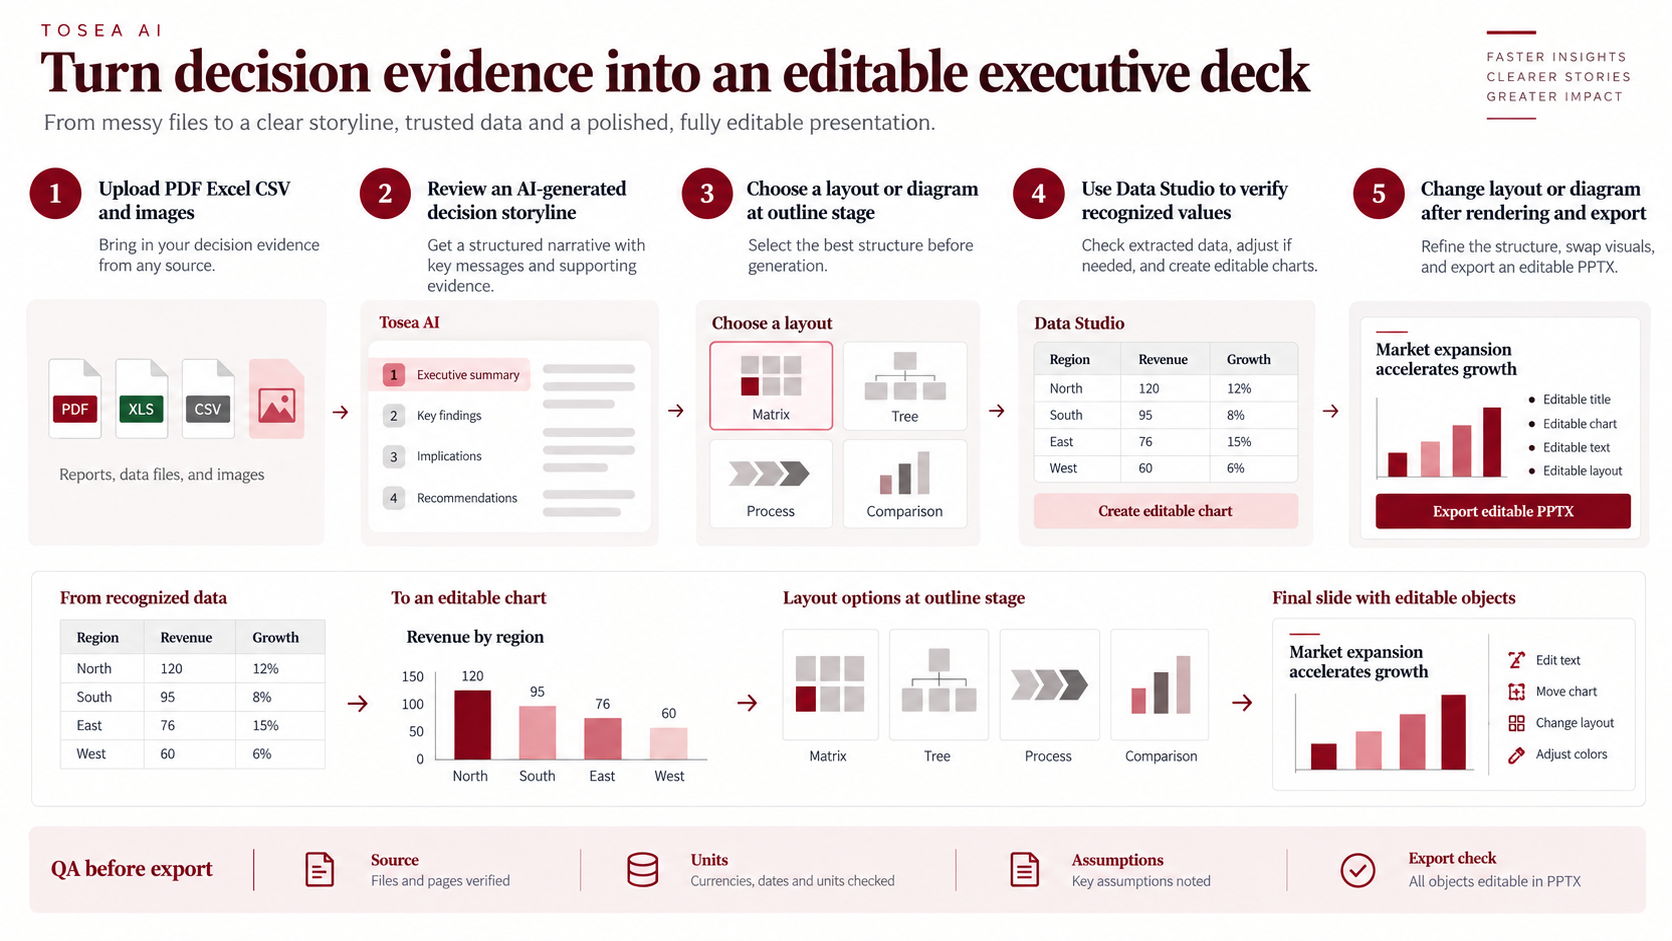
Tosea AI separates content logic from visual arrangement. During the outline stage, you can choose a layout or diagram for each slide. A 3C page might use a triangle, three-column comparison, or evidence-to-recommendation structure. A value chain page might use an activity map, process flow, heatmap, or current-state versus future-state comparison.
After the presentation is rendered, you can continue changing the layout or diagram without rebuilding the deck. Layout Only mode is useful when wording has already been approved and the visual structure needs refinement. Our PowerPoint layout patterns guide explains which structure fits which kind of argument.
Quality Checklist Before Exporting the PPTX
- The headline states a conclusion, not a topic.
- Every number has a unit, a period, and a source.
- Segment sizes, activity shares, and stage durations reconcile with their totals.
- Assumptions are labeled separately from facts.
- Hotspots are quantified, not just colored.
- Every recommendation has an owner and a next step.
- The editable PPTX opens correctly in the PowerPoint environment used for delivery.
Frequently Asked Questions
What is the difference between the 3C model and value chain analysis?
The 3C model evaluates market fit. Value chain analysis examines the internal activities that create cost or differentiation. Use 3C to decide where to compete and the value chain to decide what must change.
Can Tosea AI redesign my existing PowerPoint without changing the content?
Yes. Export the PowerPoint as a PDF, upload it to Tosea AI, and request a redesign that keeps the original wording. Use Layout Only when the goal is to refresh visual structure without intentionally rewriting content. Review every label, footnote, and slide element before delivery.
How do I upload a PowerPoint and ask Tosea AI to redesign each slide?
Export the PowerPoint as a PDF. Upload it to Tosea AI and explain that each slide should be redesigned while preserving its content and sequence. Choose a template or describe the visual direction, generate the deck, and inspect each slide before export.
Can I upload my own PowerPoint template to Tosea AI?
Tosea AI supports custom templates on eligible paid plans. Configure the template through the product workflow, then confirm that layouts, fonts, colors, logo placement, and master-slide rules are correct.
Can Tosea AI use custom brand colors, fonts, and a logo?
Yes. Specify brand colors and fonts, then upload the logo or use a supported custom template. These features are available on eligible plans. Verify fonts, colors, logo clear space, and contrast after export.
Can Tosea AI match the style of my old company presentations?
Tosea AI can use a representative deck as design guidance, but this is not permanent model training. For consistency, use an approved custom template and compare the result with current brand guidelines.
Does Tosea AI preserve PowerPoint formatting after export?
Tosea AI editable PPTX export is designed to stay close to the preview while keeping elements editable. Results vary with fonts, complex graphics, and the application used. Test the deck in the delivery environment.
Can I tell AI to edit the layout only and keep the exact wording?
Yes. Layout Only mode changes the visual arrangement without intentionally rewriting slide content. It is useful when wording has been approved. Compare the revised slide with the source to confirm that labels, citations, footnotes, and line breaks remain correct.
Build the Analysis and the Deck in One Workflow
The strongest strategy presentation begins with a precise decision, defensible evidence, and a clear implication. The 3C model identifies a position that customers value, the company can deliver, and competitors do not already control. Value chain analysis then shows where the organization must invest, redesign, or remove cost.
With Tosea AI, you can turn research files into an outline, choose layouts and diagrams, convert source data into editable charts, refine individual slides, and export an editable PPTX. The prompts in this guide are designed to be reused with your evidence rather than copied as generic decoration. For the visual rules that make the finished slides read as consulting-grade, see how to build a McKinsey-style PowerPoint with AI.
Sources
- The Mind of the Strategist — Kenichi Ohmae official website
- The strategic triangle: A new perspective on business unit strategy — Kenichi Ohmae, European Management Journal, 1982
- The Value Chain — Harvard Business School Institute for Strategy and Competitiveness
- The Five Forces — Harvard Business School Institute for Strategy and Competitiveness
- How Competitive Forces Shape Strategy — Michael E. Porter, Harvard Business Review, 1979