How to Use Diagram Design: AI Diagram Generator for Branded HTML and SVG Diagrams
How to use Diagram Design, the open-source AI diagram generator skill: install it, match your brand, write prompts, redraw Mermaid or draw.io files, and move diagrams into slides.
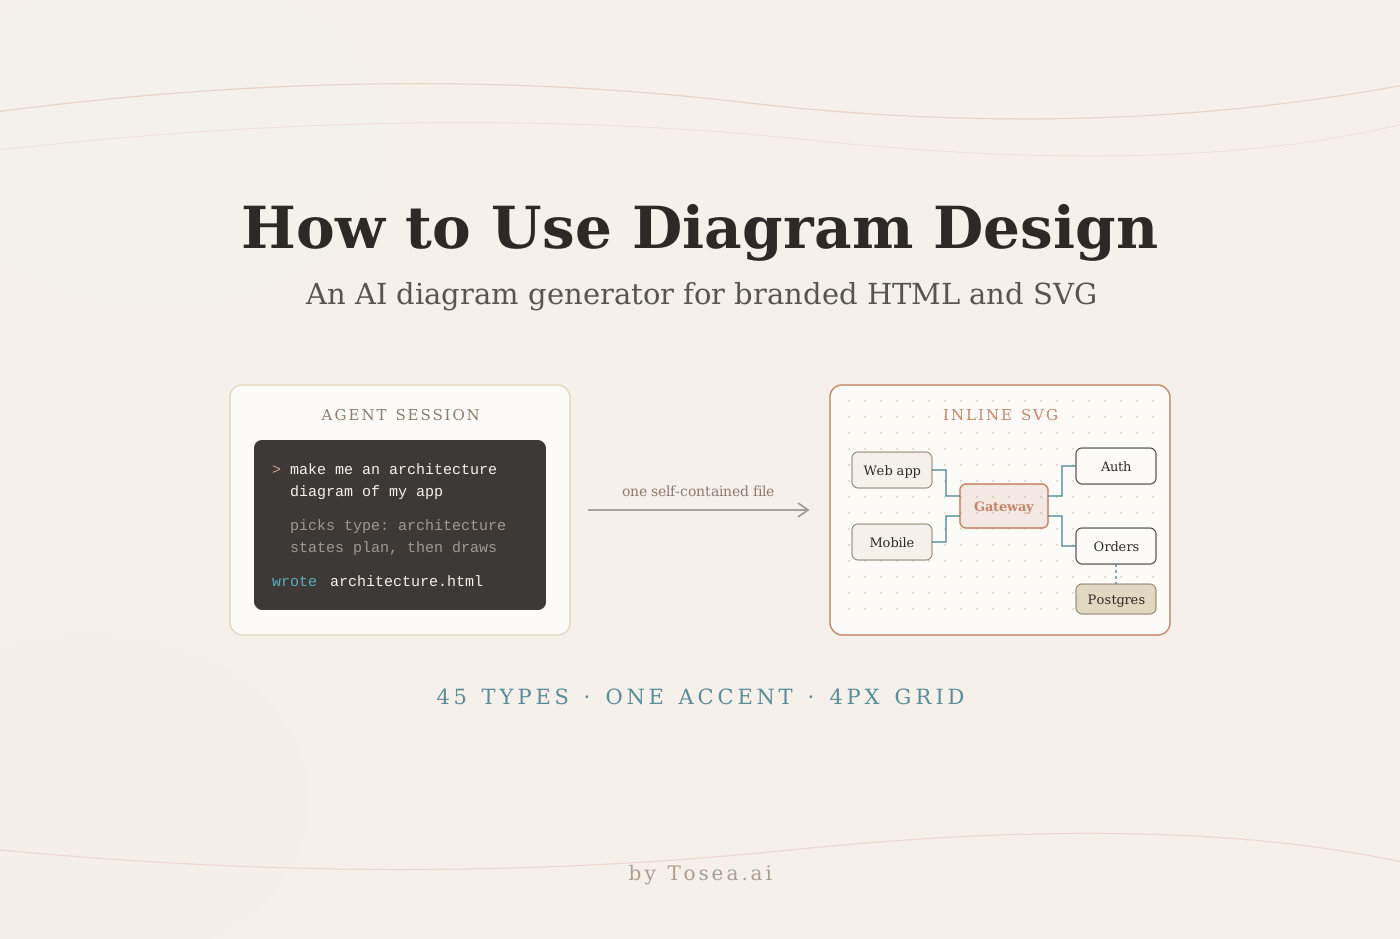
Diagram Design is an AI diagram generator for people who need publishable architecture diagrams, process maps, data visuals, and presentation graphics without rebuilding every box in Figma. The open-source Agent Skill turns a written brief into one self-contained HTML file with inline SVG, applies your brand colors and typography, and supports 45 diagram types. This guide explains who should use it, how to install it, how to write a useful prompt, how to redraw existing diagrams, and how to move the finished visual into a presentation with Tosea AI.
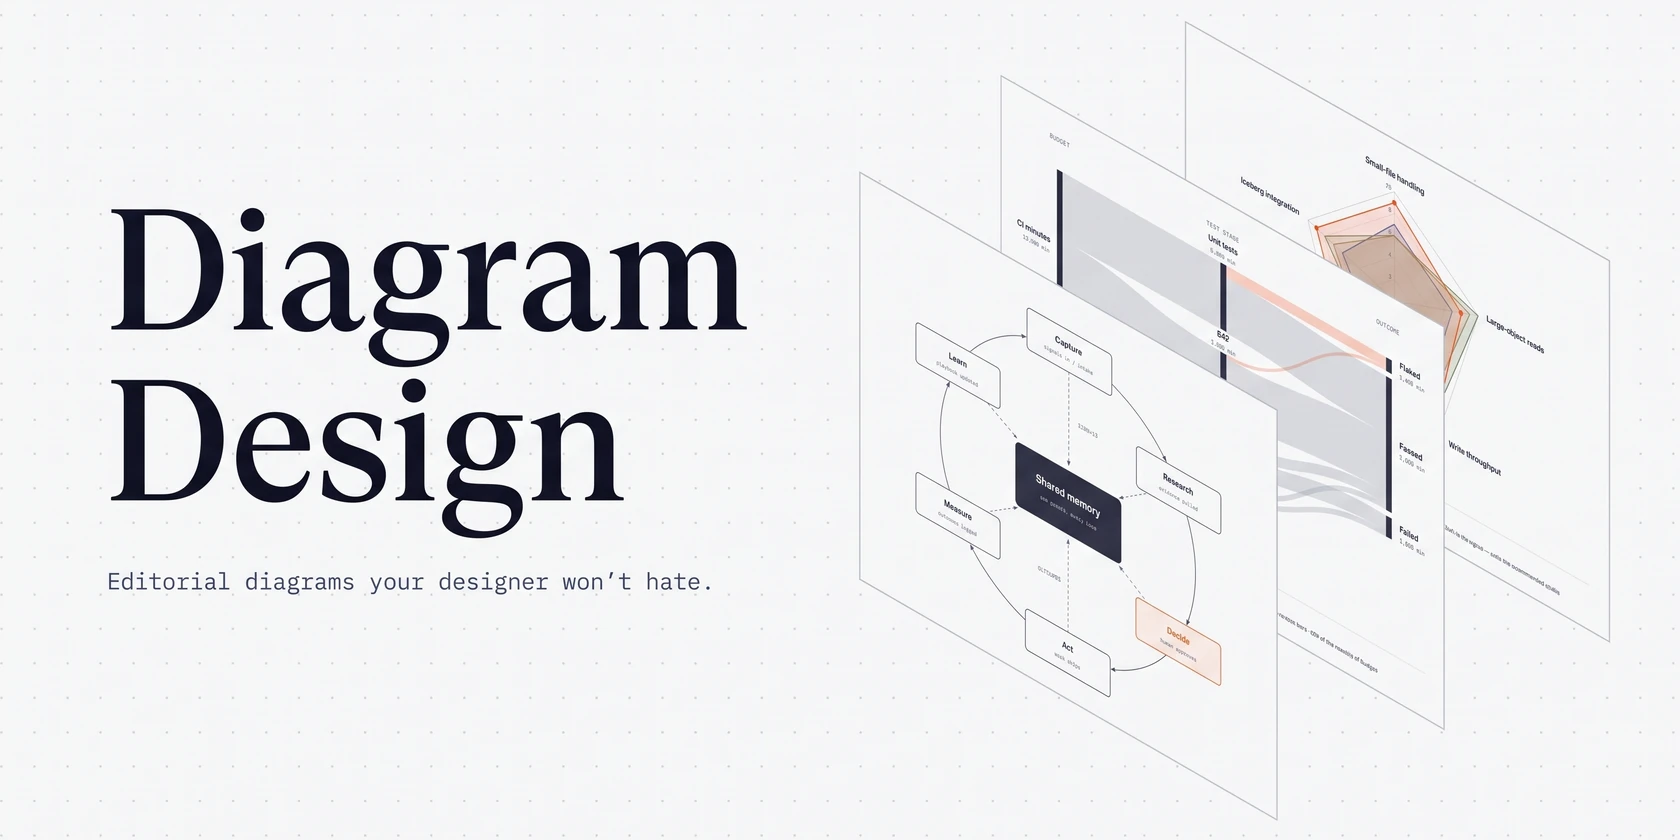
Source and credit: Diagram Design on GitHub, created by Cathryn Lavery. The repository is distributed under the MIT License. The hero image and the draw.io redraw example below come from the official repository, and the gallery screenshot was captured from the project's public gallery. Copyright remains with the project author. Details in this guide were checked against the repository on October 13, 2026.
Quick Answer
Install Diagram Design with npx skills add cathrynlavery/diagram-design, then ask a compatible coding agent for a diagram, audience, and output size. Onboard the skill to your website or supply brand tokens. The agent selects one of 45 types, states its plan, and writes browser-ready HTML with inline SVG. Export SVG for Figma or PowerPoint, PNG for slides, or keep the HTML for the web.
What Is Diagram Design?
Diagram Design is an Agent Skills-compatible visual system for Claude Code, Codex, Cursor, GitHub Copilot, Gemini CLI, Cline, Windsurf, Amp, and similar hosts. It gives the agent editorial rules for choosing a visual type, limiting density, using a consistent grid, and directing attention with one accent color.
The live gallery lists 45 types, including architecture, architecture delta, flowchart, sequence, state machine, ER model, timeline, swimlane, quadrant, radar, polar, flywheel, tree, org chart, layer stack, exploded and axonometric views, Venn, pyramid and funnel, treemap, heatmap, waterfall, Gantt, process, Sankey, fishbone, Wardley map, user journey, deployment, UML class, database schema, and service blueprint. Each type comes in three variants: minimal light, minimal dark, and full editorial. Several types also carry named sub-variants, such as slopegraph and ridgeline under line charts, or marimekko under treemap.
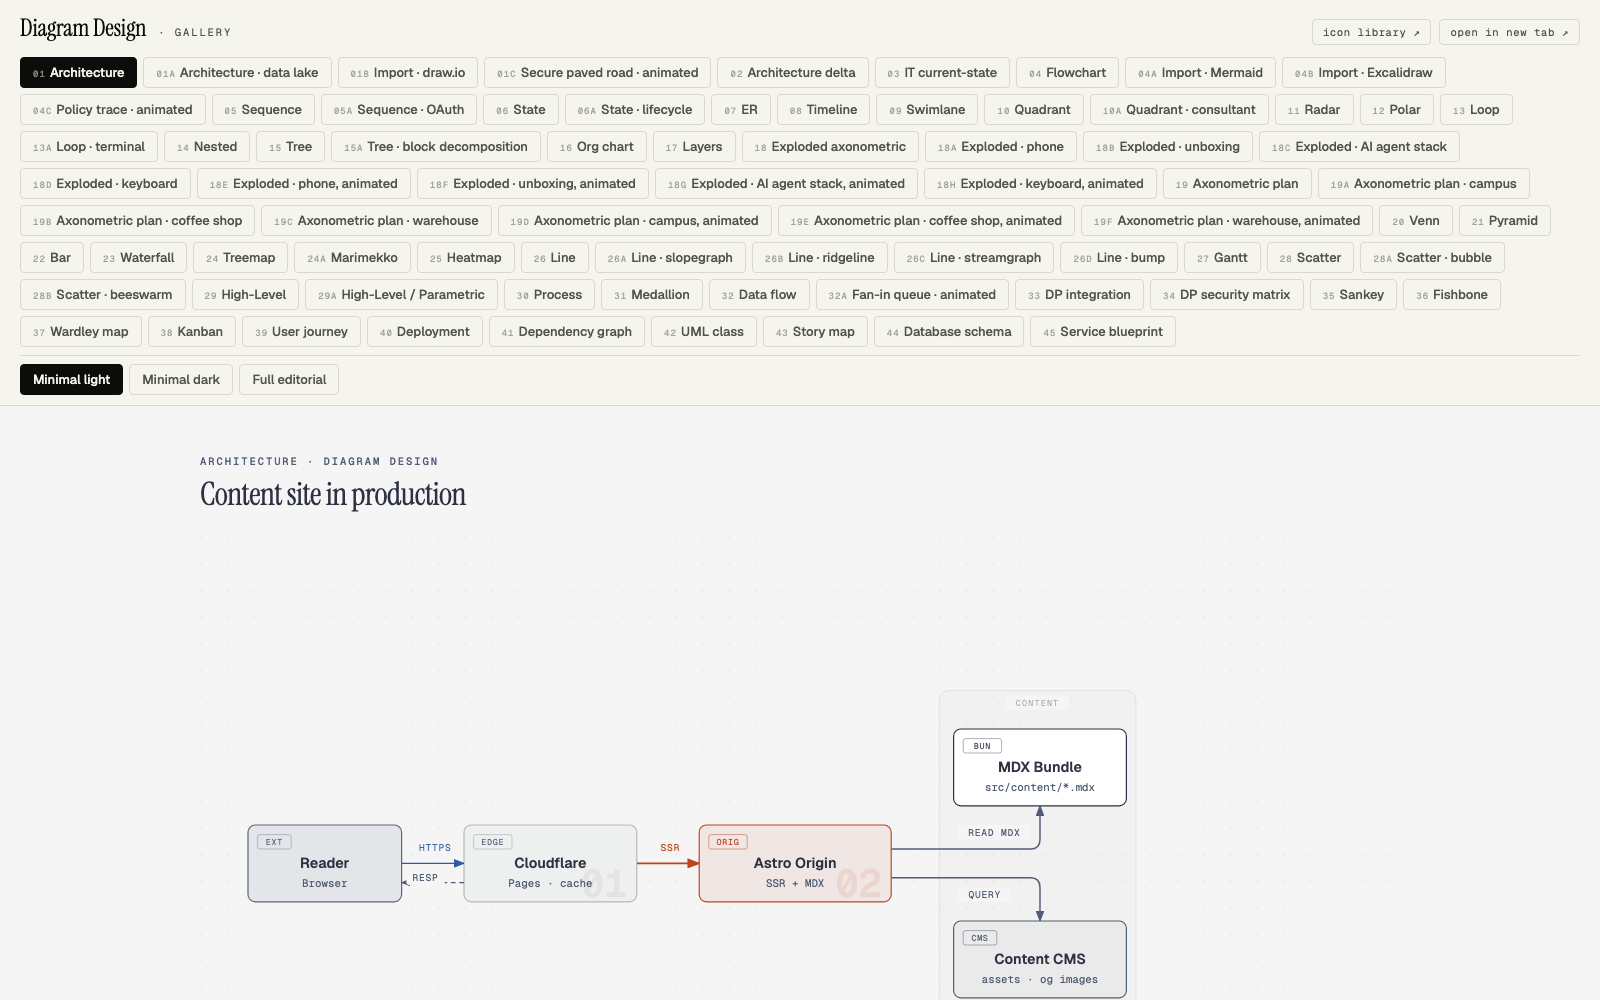
The design system is deliberately narrow. Every diagram uses one accent color for the one or two elements the reader should see first, 1px hairline borders, no shadows, a maximum corner radius of 10px, and coordinates that sit on a 4px grid. Typography is limited to three families: Instrument Serif for titles and callouts, Geist for node names, and Geist Mono for technical labels such as ports and field types. The README sets a target density of 4 out of 10 and states the principle bluntly: "The highest-quality move is usually deletion."
That restraint is the product. A default text-to-diagram renderer gives every node the same weight. Diagram Design gives the reader a focal point, which matters far more on a projected slide than in a code repository.
Diagram Design vs Mermaid vs draw.io
The project's own README compares these tools honestly, and the comparison is worth restating because the right choice depends on where the diagram will live.
| Mermaid / PlantUML | draw.io / Excalidraw | Diagram Design | |
|---|---|---|---|
| How you make it | Write diagram text | Drag shapes by hand | Describe it to an agent |
| Layout | Automatic | Manual | Placed by the agent on a 4px grid, with CI checks for overlaps and clipping |
| Look | The renderer's theme | Whatever you draw | One editorial style, matched to your brand |
| Output | Text that renders on GitHub | An editable .drawio or .excalidraw file | One HTML file with inline SVG, exportable to SVG or PNG |
| Change it later | Edit the text | Edit the canvas | Ask the agent again, or edit the SVG |
| Best for | Docs that change every sprint | Hands-on whiteboarding | Diagrams you will publish or present |
Who Should Use This AI Diagram Generator?
Software architects and engineering teams
Use architecture, sequence, deployment, UML, ER, and data-flow diagrams to explain systems in proposals, documentation, executive briefings, or conference presentations. The architecture delta type is useful for migration reviews because it shows what was added, removed, changed, moved, or rewired.
Consultants and strategy teams
Use quadrants, waterfalls, Sankey charts, Wardley maps, timelines, and architecture-delta views to turn analysis into a decision narrative.
Product, operations, and service-design teams
Use user journeys, story maps, kanban boards, swimlanes, fishbones, service blueprints, and state machines to explain ownership, handoffs, bottlenecks, failure states, and release scope.
Researchers, educators, and technical writers
Use process diagrams, conceptual models, timelines, trees, and data flows to clarify a method or argument in a lecture, report, website, or slide deck.
Brand and content teams
Use the onboarding workflow to map a website palette and font stack to semantic roles such as paper, ink, muted text, accent, and links. Saved profiles keep visuals consistent across clients or projects.
When Diagram Design Is Not the Best Choice
Use Mermaid when a diagram lives beside code, changes every sprint, and needs clean text diffs in Git. GitHub already supports Mermaid inside Markdown, as explained in the GitHub diagram documentation. Use a table when the task is simply comparing attributes or showing a before-and-after change. Use prose when one sentence communicates the idea better than a graphic.
Quality also depends on the model you run it with, and the same prompt can lay out differently twice. The output can be edited or regenerated, but it is not a native draw.io canvas, and there is no diagram text to diff in a pull request. Diagram Design is strongest for visuals that will be published or presented.
How to Install Diagram Design
The simplest cross-agent installation is:
npx skills add cathrynlavery/diagram-design
The command detects compatible skill directories and installs the whole skill, including its references, assets, and scripts. Update a standalone installation with:
npx skills update diagram-design
In Claude Code, the plugin marketplace adds automatic updates and the slash commands for export, import, profiles, and diagnostics:
/plugin marketplace add cathrynlavery/diagram-design
/plugin install diagram-design@diagram-design
The official repository also lists current commands for Codex, GitHub Copilot, Factory Droid, Pi, Kiro, OpenCode, and editable local installations. According to the README, official builds come only from that repository, and plugin directory listings are published by LittleMight, Cathryn Lavery's company; listings under any other name are unofficial copies.
How to Use Diagram Design Step by Step
Step 1: Define what the reader must understand
Start with the decision, relationship, or sequence the diagram must communicate. Do not begin by choosing a fashionable visual type. A diagram about service dependencies needs different grammar from a diagram about project priority.
Step 2: Set the audience and destination
Specify whether the audience is technical, mixed, or executive. Name the destination, such as a 16:9 slide, wide documentation page, social card, or print layout. This controls label depth, dimensions, and density. A projected slide gets a larger type ramp than a documentation figure.
Step 3: Apply your brand
Ask the agent to onboard Diagram Design to your public website, or provide approved colors and fonts. The skill extracts a palette and font stack, maps them to semantic roles, checks WCAG AA contrast, and shows a proposed diff before writing tokens. Review those tokens before applying them. On first use in a new project, the skill pauses and asks whether to onboard, paste tokens, or proceed with the default style, so default-skinned diagrams do not slip into a branded deck unnoticed.
Step 4: Give the agent structured content
List the required nodes, relationships, boundaries, order, quantities, and one focal takeaway. Also identify anything that must not be inferred. For technical and regulated work, require a fidelity ledger describing what was merged, simplified, or omitted.
Step 5: Generate and inspect the HTML
Open the .html file in a browser. Check clipped labels, crossing connectors, ambiguous arrows, missing units, unsupported claims, and excessive detail. Then run the packaged self-check, which prints OK when the file passes:
python3 skills/diagram-design/scripts/self_check.py path/to/diagram.html
By default, a diagram loads its three fonts from Google Fonts, its only network request. If the file must work fully offline, ask for system fonts, then add --offline to the self-check so it also fails when a Google Fonts link remains.
Step 6: Export for the destination
Ask the agent to export SVG and PNG, or use the export command in hosts that ship it. PNG export renders through Playwright at 2× by default, and a higher scale is available for print. SVG stays sharp at any size, and Microsoft 365 apps can insert and edit SVG graphics, according to Microsoft Support. In PowerPoint, the Convert to Shape option breaks an inserted SVG into editable shapes. The project's changelog also notes that SVG export normalizes rgba() and transparent colors for PowerPoint compatibility.
For accessible web output, keep a meaningful SVG title and description. Diagram Design templates already include them, and the W3C SVG specification explains how title and desc content can be exposed through accessibility APIs.
Redraw Existing Mermaid, draw.io, and Excalidraw Diagrams
Many teams already have diagrams; they just do not look presentable. Diagram Design can read draw.io files (including compressed payloads and .drawio.png files with an embedded diagram), Mermaid files or fenced Mermaid blocks in Markdown, and Excalidraw scene files, then redraw them in its own style. Components, relationships, grouping, and direction carry over. Source coordinates, palette, fonts, and automatic layout do not.
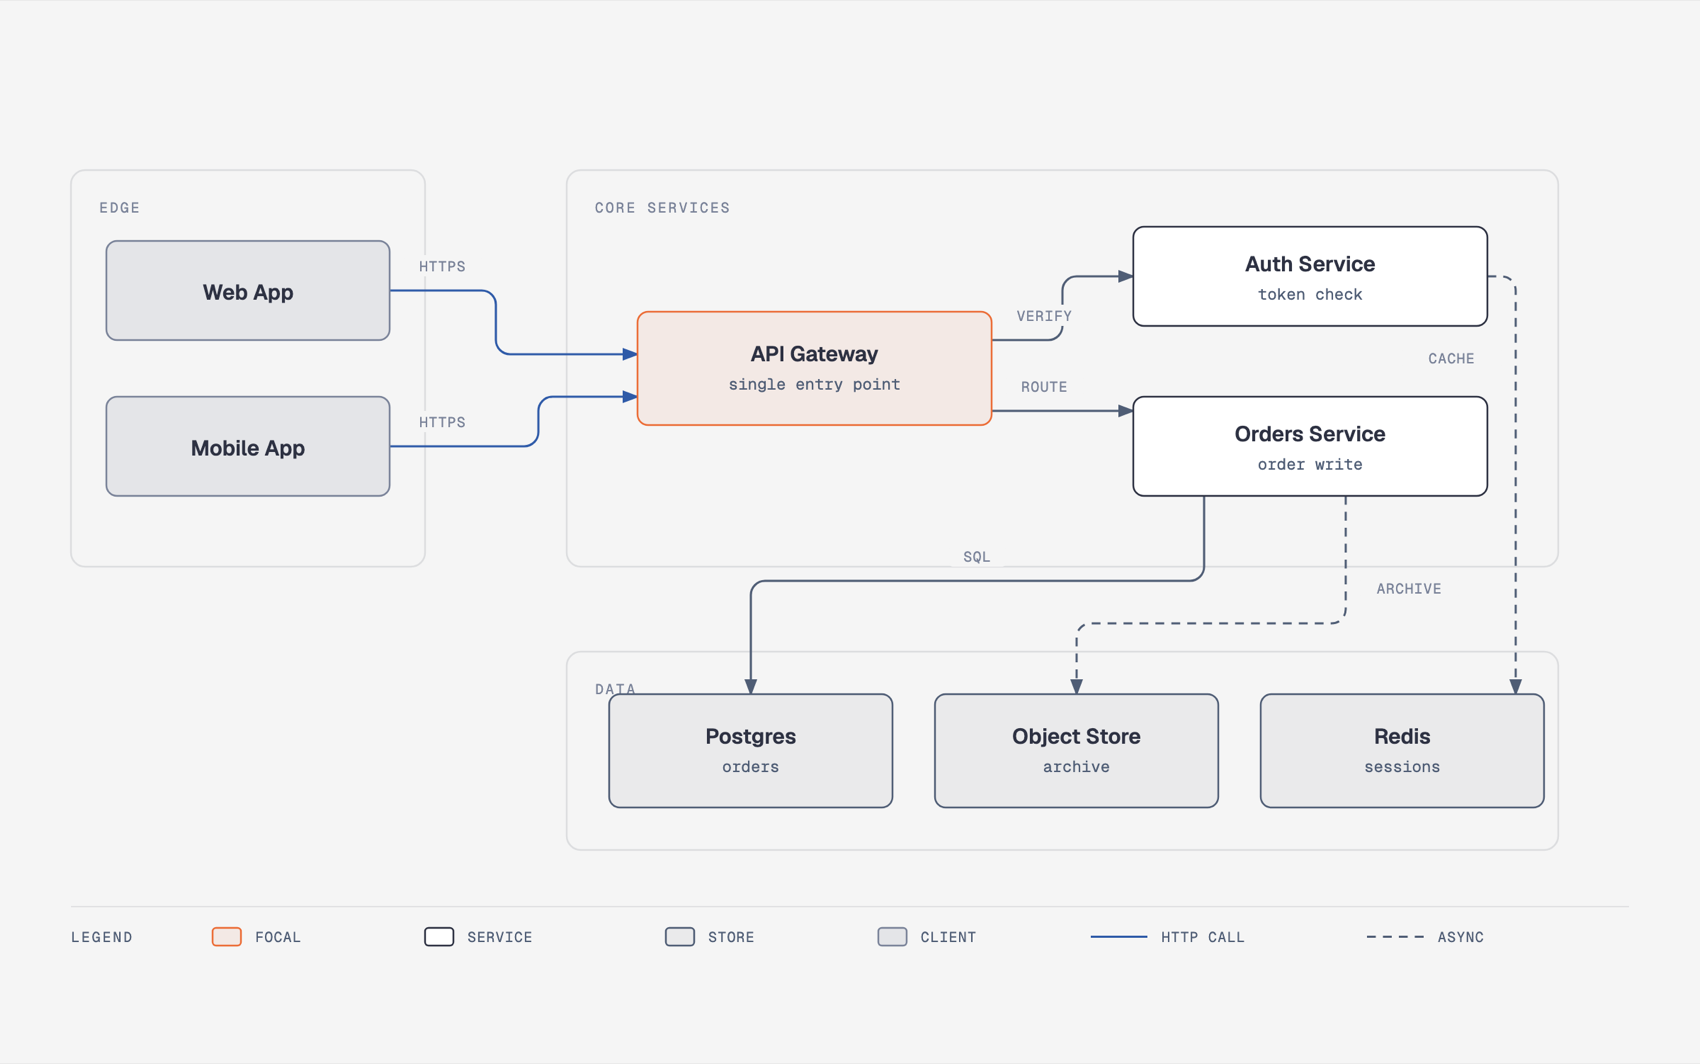
The redraw is controlled by four dials:
| Dial | Options | What it changes |
|---|---|---|
| Format | html, svg, png, html+png | The deliverable |
| Size | doc-inline, doc-wide, slide-16x9, slide-4x3, social and print presets | The canvas and the type ramp |
| Detail | faithful (up to 24 nodes), balanced (up to 12), simplified (up to 7) | How much of the source survives |
| Audience | engineer, mixed, executive | The wording of labels, not the node count |
Every import ends with a fidelity ledger listing what was merged, collapsed, or dropped. For presentation work, that ledger is the most important output: it tells you exactly what an executive version of an engineering diagram left out, so you can decide whether the simplification is acceptable before the slide reaches a client.
Three Reusable Diagram Design Prompts
Architecture diagram prompt
Create a branded architecture diagram for a 16:9 executive slide.
Audience: mixed technical and business.
Show: web app, API gateway, authentication service, order service, Redis, PostgreSQL, and analytics warehouse.
Group components by trust boundary.
Emphasize the order path as the single focal flow.
Use simplified detail and include a fidelity ledger.
Output one self-contained HTML file with inline SVG, then export SVG and PNG.
Research process prompt
Create a process diagram for a research presentation.
Show five stages: question, data collection, preprocessing, analysis, and validation.
Add one decision point for failed validation and a return path to preprocessing.
Use our brand profile, minimal light style, and slide-16x9 size.
Keep all terminology exactly as supplied.
Mermaid redesign prompt
Redraw the attached Mermaid diagram for a client presentation.
Preserve components, direction, grouping, and relationships.
Remove decorative complexity and simplify labels for executives.
Use balanced detail, slide-16x9 size, and our saved brand profile.
Report every merged, collapsed, or dropped item.
Where Diagram Design Stops and AI Slide Generation Begins
Diagram Design solves one visual at a time. A presentation needs something different: a storyline that decides which visuals exist, what each slide claims, and where the evidence comes from. Those are separate jobs, and treating them as one is how decks end up with a beautiful architecture diagram on slide 4 and no argument around it.
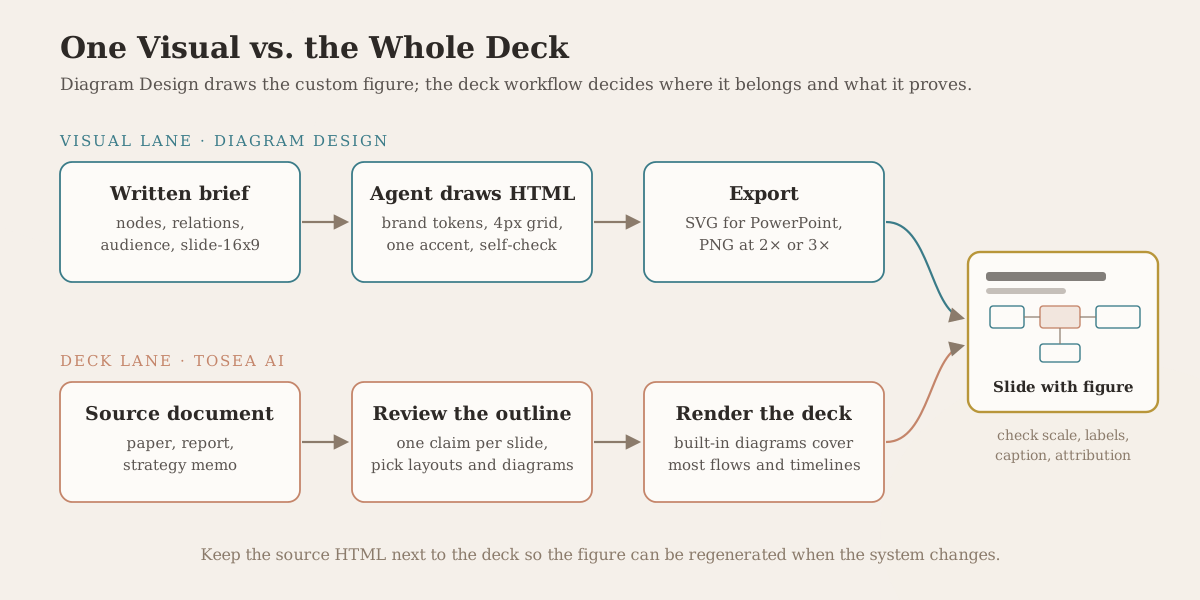
A practical presentation workflow splits the work along that line. Start with the source document: a research paper, technical report, strategy memo, or design review. Upload it to Tosea AI, review the outline before rendering, and decide which slides need a diagram at all. Tosea AI lets you choose a layout or diagram treatment for each slide during the outline stage and change it after the deck is generated, which covers most process flows, timelines, and comparisons without any external tool. Our PowerPoint layout patterns guide explains which structure fits which kind of claim.
Reserve Diagram Design for the visuals that need custom grammar: a system architecture with trust boundaries, an architecture delta for a migration review, or a Sankey that has to match your brand exactly. Export the SVG or a high-resolution PNG, place it on the slide the outline already planned for it, and check scale, labels, contrast, caption, and attribution in the delivery environment. Keep the original HTML next to the presentation so the agent can regenerate the figure when the system changes.
The same division of labor applies to charts. For editable data charts rather than diagrams, our guide to the Lieflat Charts skill covers a comparable agent workflow, and our roundup of the best AI tools for technical presentations compares where each tool fits in a technical slide deck. If your starting point is an academic paper, how to turn a research paper into a presentation walks through the document-to-PPT side in detail.
Turn Slide Images and PDFs into Fully Editable PowerPoint with Reslide
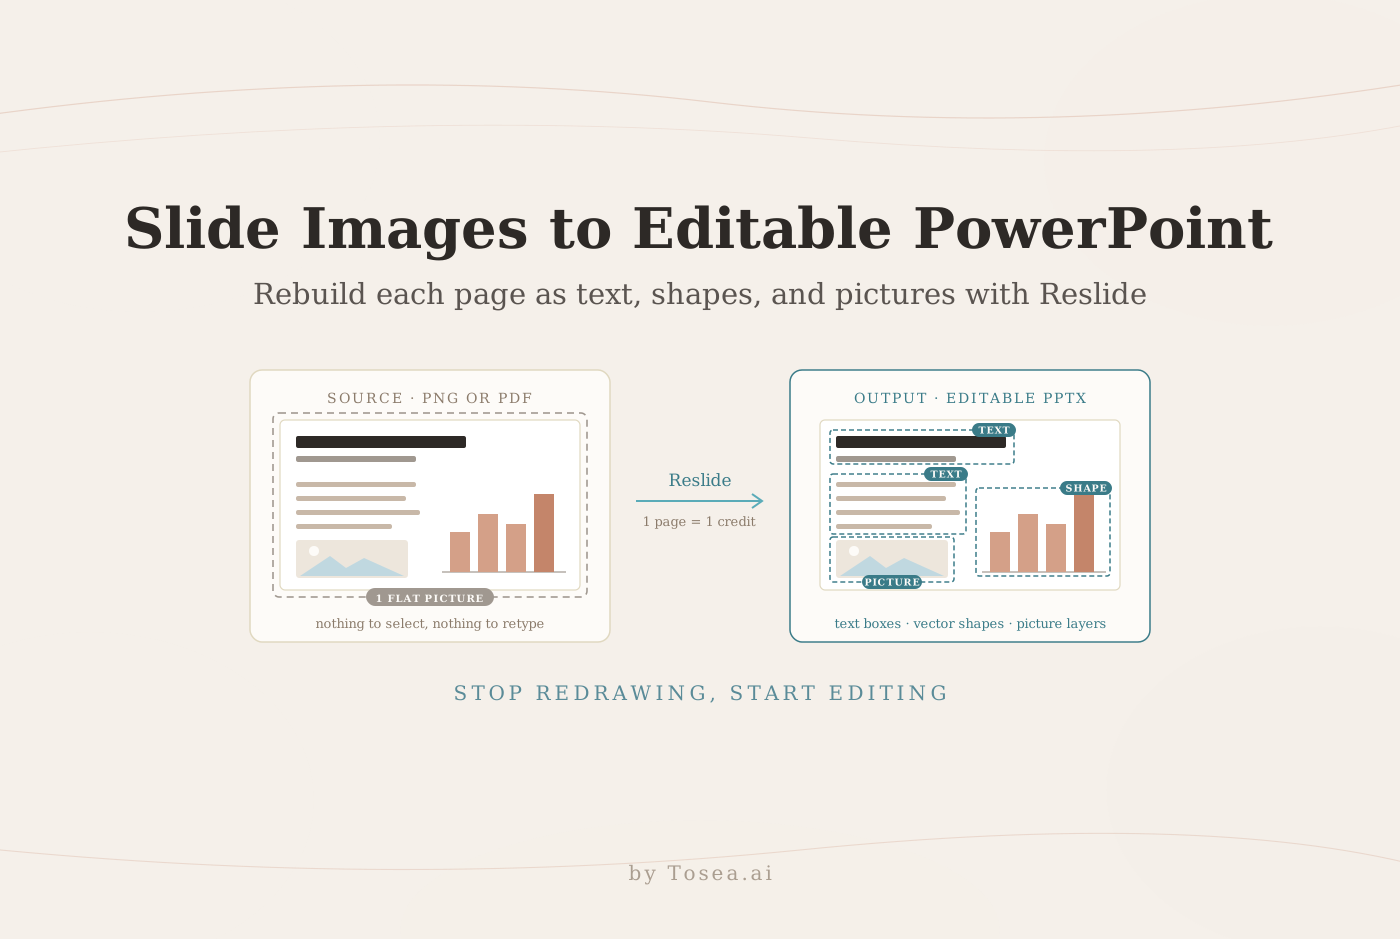
If the only surviving version of a diagram or deck is a screenshot or flattened PDF, use Reslide by Tosea AI. Reslide can turn slide images and PDFs into fully editable PowerPoint, reconstructing visible content as separate text boxes, supported shapes, and picture layers rather than placing one screenshot on a blank slide.
This is a reconstruction workflow, so inspect technical labels, connectors, fonts, and overlapping elements after conversion. For a complete walkthrough, read How to Convert Slide Images and PDFs to Editable PowerPoint with Reslide.
Frequently Asked Questions
Is Diagram Design free?
Yes. The skill is open source under the MIT License. You still pay for whatever coding agent and model you run it with, and output quality depends on that model.
Can I edit a Diagram Design diagram in PowerPoint?
Export the diagram as SVG and insert it into PowerPoint. In Microsoft 365 versions that support it, Convert to Shape turns the SVG into individual shapes you can recolor, move, or relabel. For larger structural changes, it is usually faster to ask the agent to regenerate the diagram.
Can Tosea AI redesign my existing PowerPoint without changing the content?
Yes. Export the PowerPoint as a PDF, upload the PDF to Tosea AI, and request a redesign that keeps the original wording. Use Layout Only when the goal is to refresh visual structure without intentionally rewriting content. Confirm that labels, footnotes, citations, and slide elements remain complete.
How do I upload a PowerPoint and ask Tosea AI to redesign each slide?
Export the PowerPoint as a PDF, upload it to Tosea AI, and state that every slide should be redesigned while preserving its content and sequence. Choose a template or describe the visual direction, generate the deck, and inspect each page before export.
Can I upload my own PowerPoint template to Tosea AI?
Tosea AI supports custom templates on eligible paid plans. Configure the template through the available product workflow, then verify that required layouts, fonts, colors, logo placement, and master-slide rules are represented correctly.
Can Tosea AI use custom brand colors, fonts, and a logo?
Yes. Specify the required colors and fonts in the presentation instructions and upload the logo or use a supported custom template. After export, verify font availability, color values, contrast, and logo clear space in PowerPoint.
Can Tosea AI match the style of my old company presentations?
Tosea AI can use a representative company deck as design guidance, but this should not be described as permanent model training. For stronger consistency, use an approved custom template and compare the generated deck against the original brand guidelines.
Does Tosea AI preserve PowerPoint formatting after export?
Editable PPTX export is designed to remain close to the generated preview while keeping elements available for further editing. Results can vary with fonts, complex graphics, and the application used to open the file. Test the exported deck in the delivery environment before presenting.
Can I tell AI to edit the layout only and keep the exact wording?
Yes. Layout Only changes visual structure without intentionally rewriting the slide content. Compare the result with the source to confirm that labels, citations, footnotes, and approved wording remain correct.
Build the Diagram, Then Build the Story
Diagram Design is a practical choice when the problem is turning systems, processes, data, and strategy into a branded editorial visual. It offers more visual control than a default text-to-diagram renderer, while remaining faster than rebuilding every diagram manually. Use it when the graphic deserves to be published. Use Mermaid when maintainable text source matters more than art direction.
Then use Tosea AI to turn the surrounding report or research into an editable presentation, place the diagram in context, and refine the slide layout. If the source is already flattened, Reslide provides the recovery path back to editable PowerPoint. Designers who want to see how this fits a professional slide practice can read our AI presentation workflow for PowerPoint designers.
Sources
- Diagram Design official GitHub repository and README — Cathryn Lavery, MIT License
- Diagram Design changelog — Cathryn Lavery
- Diagram Design live gallery — Cathryn Lavery
- Creating diagrams with Mermaid on GitHub — GitHub Docs
- Edit SVG images in Microsoft 365 — Microsoft Support
- SVG document structure and accessibility — W3C