5 Business Frameworks Every Professional Should Know: Claude Code Prompts + Editable Slides
SWOT, Porter's Five Forces, Value Chain, DuPont, and PDCA explained with copy-ready Claude Code prompts, worked examples, and five editable PowerPoint slides to download.
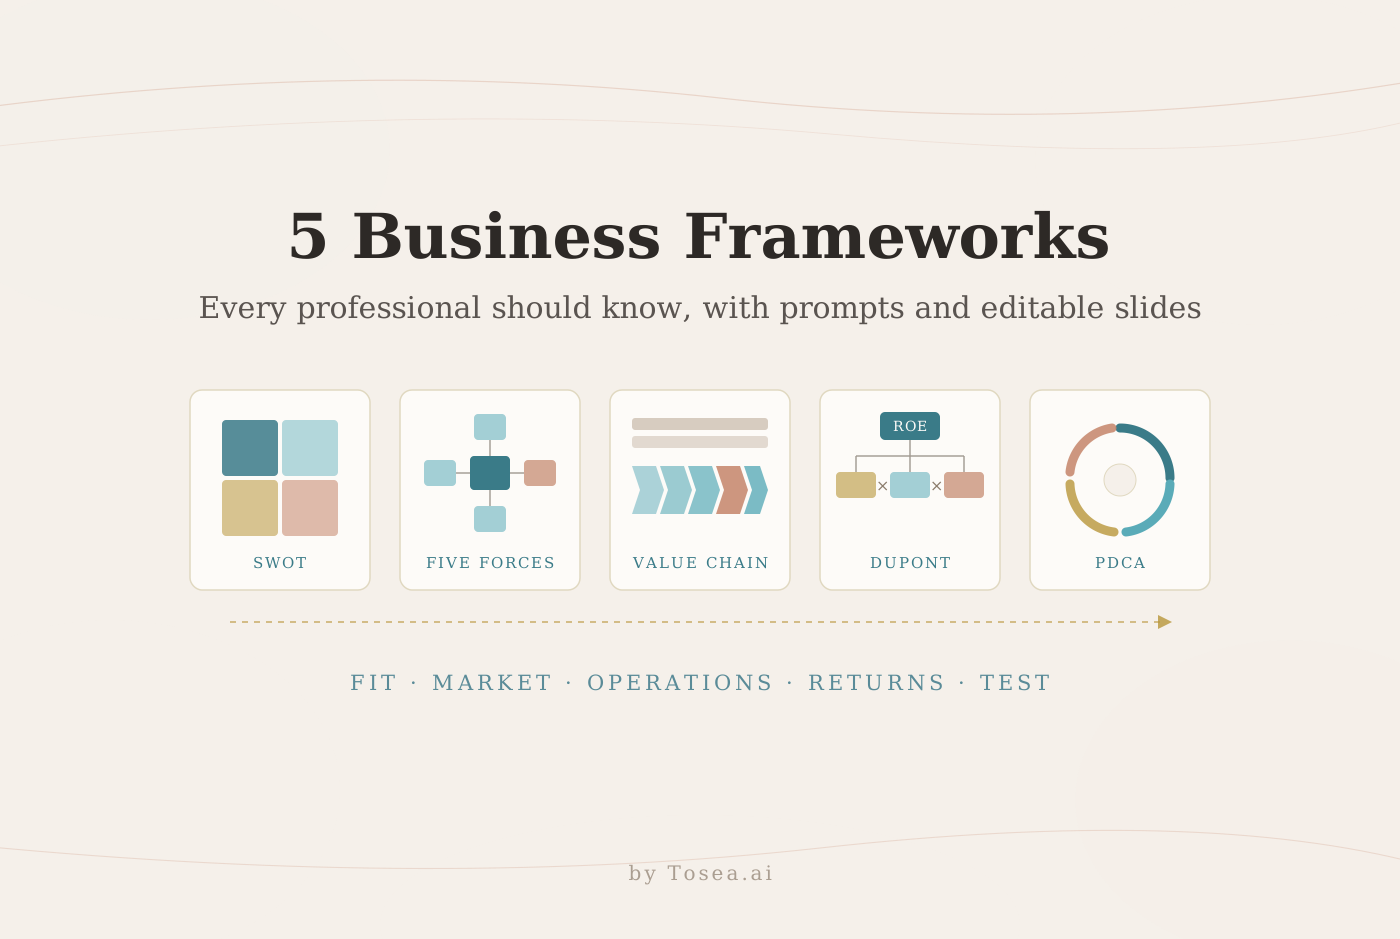
The business frameworks every professional should know turn management questions into structured analysis. Use the prompts below with Claude Code to draft that analysis and its slide outline, then use Tosea AI to develop the presentation with charts, templates, and layout editing. Each framework includes a reusable prompt and an editable slide example for strategy, operations, or finance discussions.
Quick answer: Use SWOT to assess strategic fit, Five Forces to examine industry economics, Value Chain analysis to inspect activities, DuPont analysis to explain return on equity, and PDCA to test improvements. Choose the framework that answers the decision in front of you, then connect the evidence to an implication and a next step.
The examples use fictional companies and illustrative data. Their restrained blue-and-white consulting design is original. It is not an official McKinsey, BCG, or Bain template, and Tosea has no affiliation with those firms. Download the five editable PowerPoint examples (PPTX, 16:9) to modify the text and diagrams. The PNG previews below are static images of the same slides.
Contents
- Choose a framework by question
- 1. SWOT analysis
- 2. Porter Five Forces
- 3. Value Chain analysis
- 4. DuPont analysis
- 5. PDCA
- How to run these prompts in Claude Code
- Create business framework slides in Tosea AI
- Frequently asked questions
Choose a framework by question
| Framework | Management question | Useful evidence | Slide format |
|---|---|---|---|
| SWOT | Does this opportunity fit our capabilities? | Internal performance and external conditions | Four-quadrant matrix |
| Five Forces | What constrains industry profitability? | Buyer, supplier, entry, substitution, and rivalry evidence | Five-force diagram |
| Value Chain | Which activities create value or friction? | Activity costs, cycle times, quality, customer outcomes | Activity map |
| DuPont | Why has return on equity changed? | Consistent income and balance-sheet data | Financial driver tree |
| PDCA | Does this proposed change work? | Baseline, pilot observations, acceptance criteria | Improvement cycle |
Define the business, geography, period, audience, and decision. Ask AI to flag missing evidence.
The five examples tell one story
The five slides follow one fictional industrial distributor. SWOT suggests a service-led expansion built on a regional service network. Five Forces checks whether the market can reward that move and finds strong buyer power and rivalry. The Value Chain map then locates an internal constraint: a five-day quote cycle. DuPont shows that return on equity rose mainly through leverage, so margin recovery matters. PDCA closes the loop with a small pilot that tests a faster quote process before the company commits to scale.
That sequence is a useful default for a strategy review: fit, market, operations, financial quality, then a controlled test. You rarely need all five in one meeting, but knowing how they connect helps you pick the next framework when the first one raises a question it cannot answer.
1. SWOT analysis
When to use it
SWOT examines strengths, weaknesses, opportunities, and threats. Strengths and weaknesses describe internal conditions. Opportunities and threats describe the external environment. Use it when a team needs to evaluate a launch, expansion, partnership, or strategic priority. CIPD explains SWOT and its limitations.
The useful output is a choice supported by the interaction of these factors. A regional service network might help a distributor sell maintenance bundles, while limited specialist sales capacity constrains the rollout. That combination suggests a focused pilot rather than immediate expansion everywhere.
What the slide should show
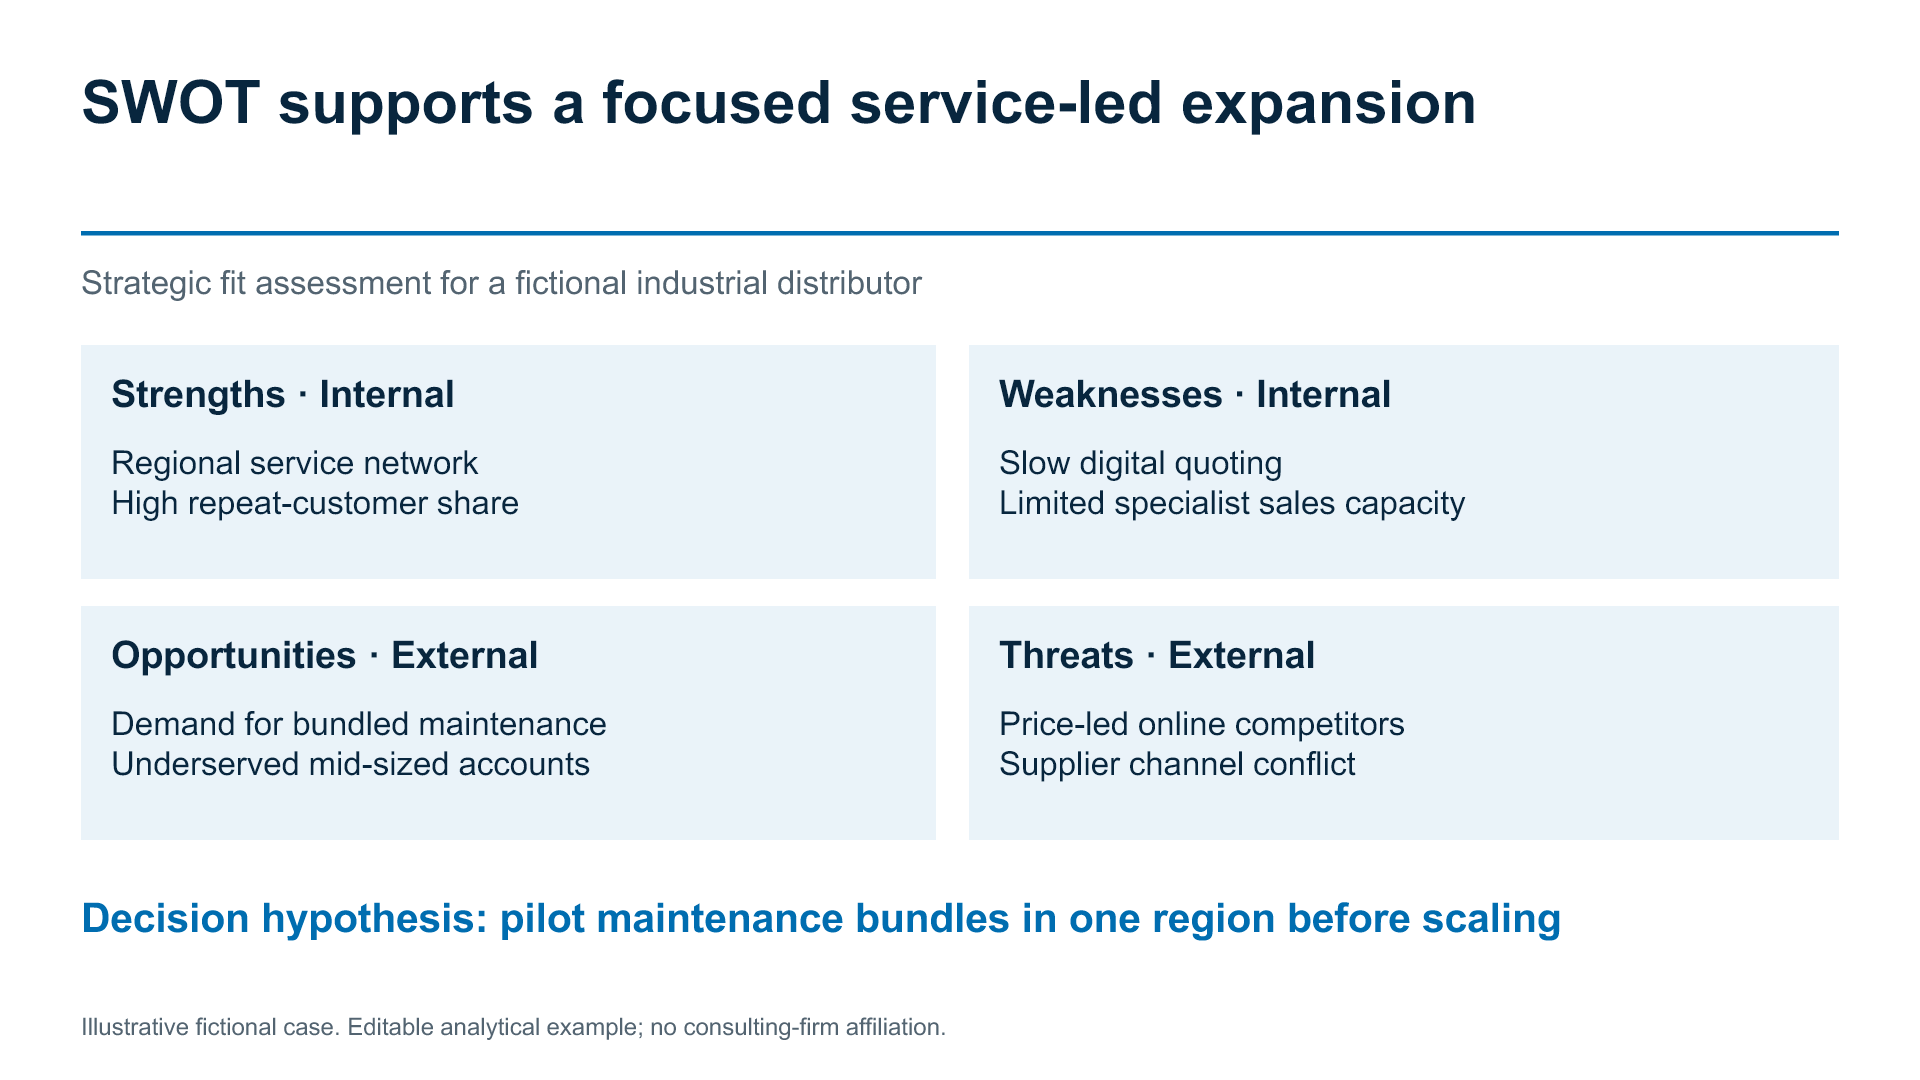
Original editable example: internal capabilities and external conditions support a service-led expansion hypothesis.
Support factors with specific evidence, such as repeat purchasing. An opportunity needs a plausible route to benefit the company. The most common failure is a balanced-looking grid with five vague bullets per box. Two material, sourced factors per quadrant are more persuasive than ten generic ones, and the decision hypothesis at the bottom is what turns the matrix into a recommendation. For more consulting-style matrix layouts, see our BCG strategy framework templates.
Copy-ready SWOT prompt
Create one SWOT slide for [company, decision, geography, and period].
Use only the uploaded operating records and approved market sources.
Separate internal strengths and weaknesses from external opportunities and threats. Select no more than two material factors per quadrant.
Attach a source to each factor and label assumptions explicitly.
Connect the most important strength-opportunity and weakness-threat relationships to one decision hypothesis and its next validation step.
Use a four-quadrant layout with editable text. Do not invent evidence to fill empty cells.
2. Porter Five Forces
When to use it
Michael Porter developed Five Forces to examine the competitive structure of an industry. It covers rivalry, buyer power, supplier power, threats from entrants, and threats from substitutes. Use it for entry decisions, pricing discussions, or industry reviews. Harvard Business School describes the framework as a way to understand competition and the distribution of economic value.
Define the product category, customer group, and geography before assessing industry structure.
What the slide should show
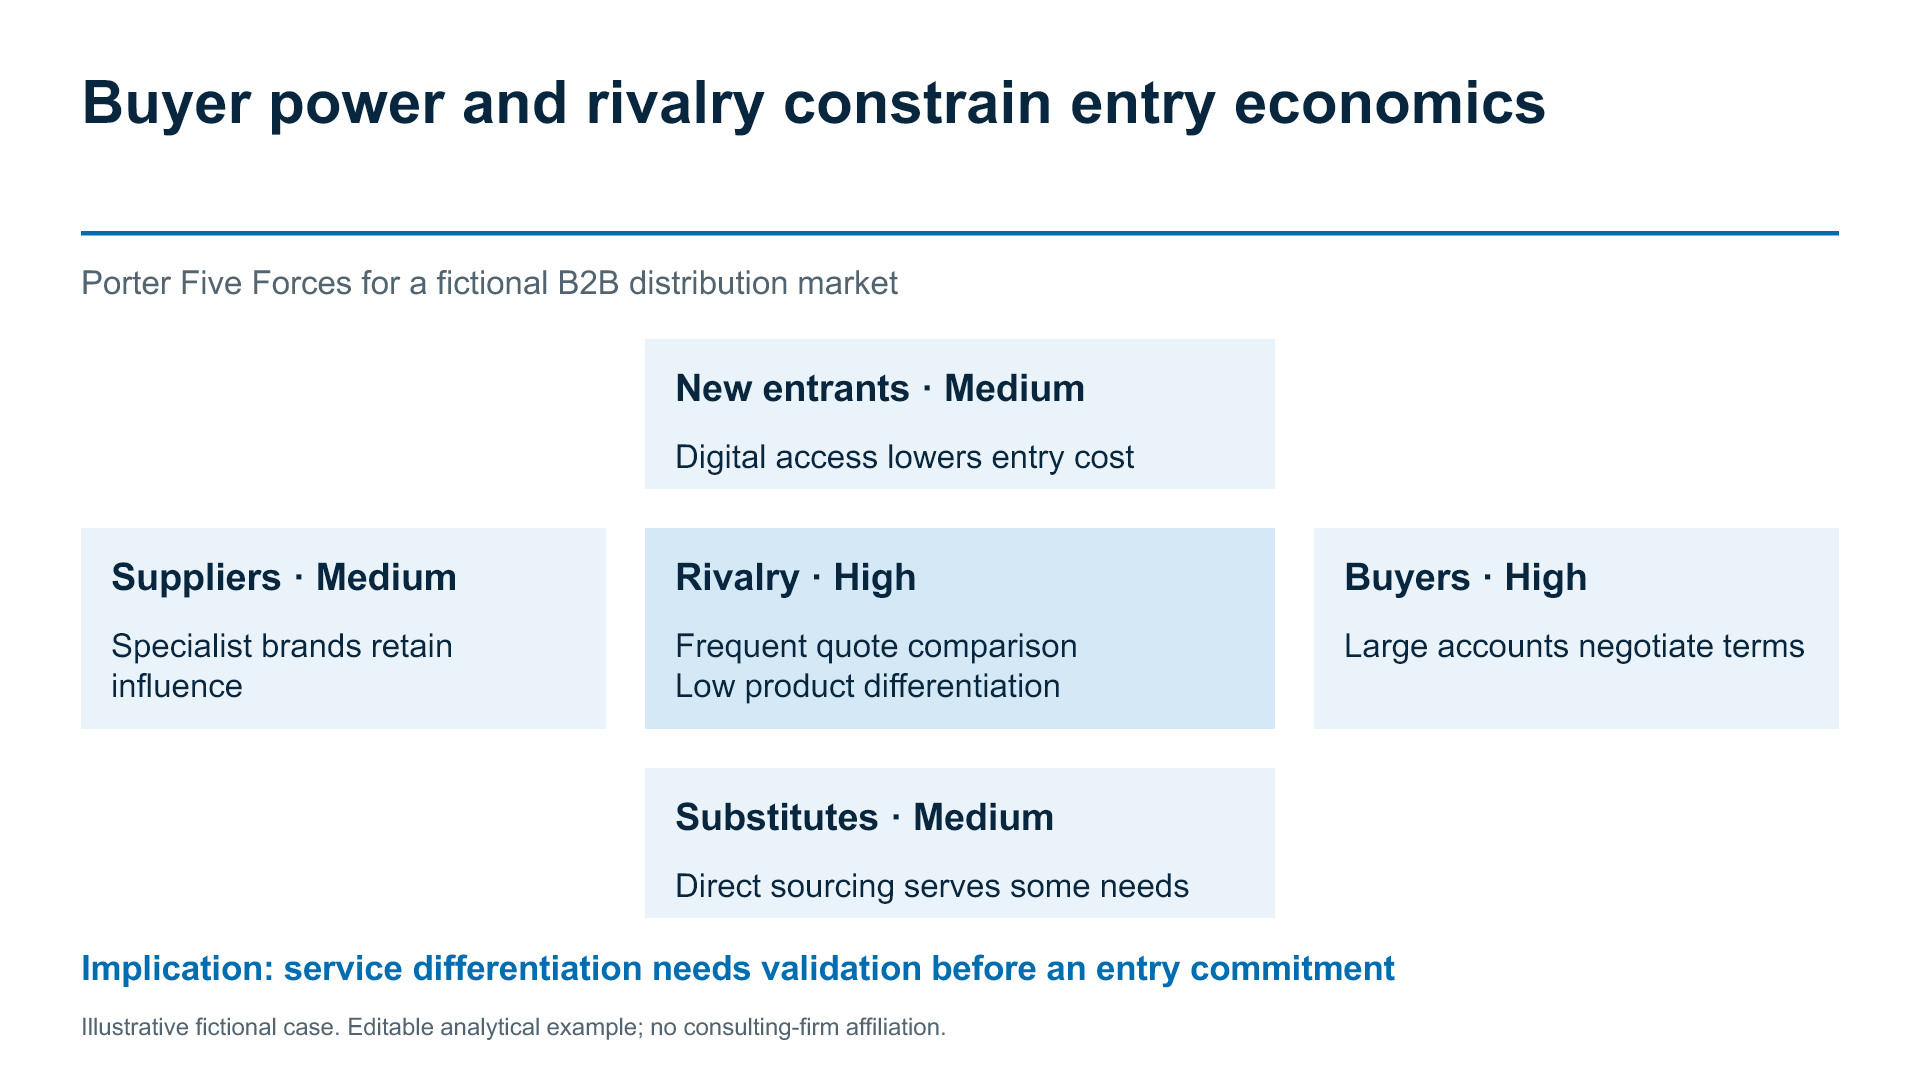
Original editable example: qualitative ratings are fictional analytical judgments, not measured industry statistics.
Support every high, medium, or low assessment with an explanation. Buyer power might reflect concentrated accounts and low switching costs. A substitute meets the same underlying need through a different approach; it is not simply another named competitor. Avoid averaging force ratings into a precise attractiveness score unless you explain the scoring method and its limitations. If you need to show how an external shock moves through market structure to firm performance, the Bain-style SCP analysis guide compares SCP with Five Forces in detail.
Copy-ready Five Forces prompt
Analyze [defined industry, customer segment, geography, and date] using Porter Five Forces.
For each force, provide a qualitative rating, two evidence-based drivers, source references, and an uncertainty note.
Distinguish substitutes from direct rivals and potential entrants from current competitors.
Create an editable five-force diagram and a supported implication for [entry, pricing, or positioning decision].
Identify the evidence most likely to change the assessment. Do not invent market shares or switching-cost estimates.
3. Value Chain analysis
When to use it
Value Chain analysis examines the activities through which a business delivers value. It helps teams investigate costs, differentiation, bottlenecks, and links between functions. Harvard Business School emphasizes that competitive advantage depends on how activities differ and fit together.
The familiar structure includes inbound logistics, operations, outbound logistics, marketing and sales, and service, supported by organizational activities. Adapt the activity labels to the business. A software company and an industrial distributor deliver value differently.
What the slide should show
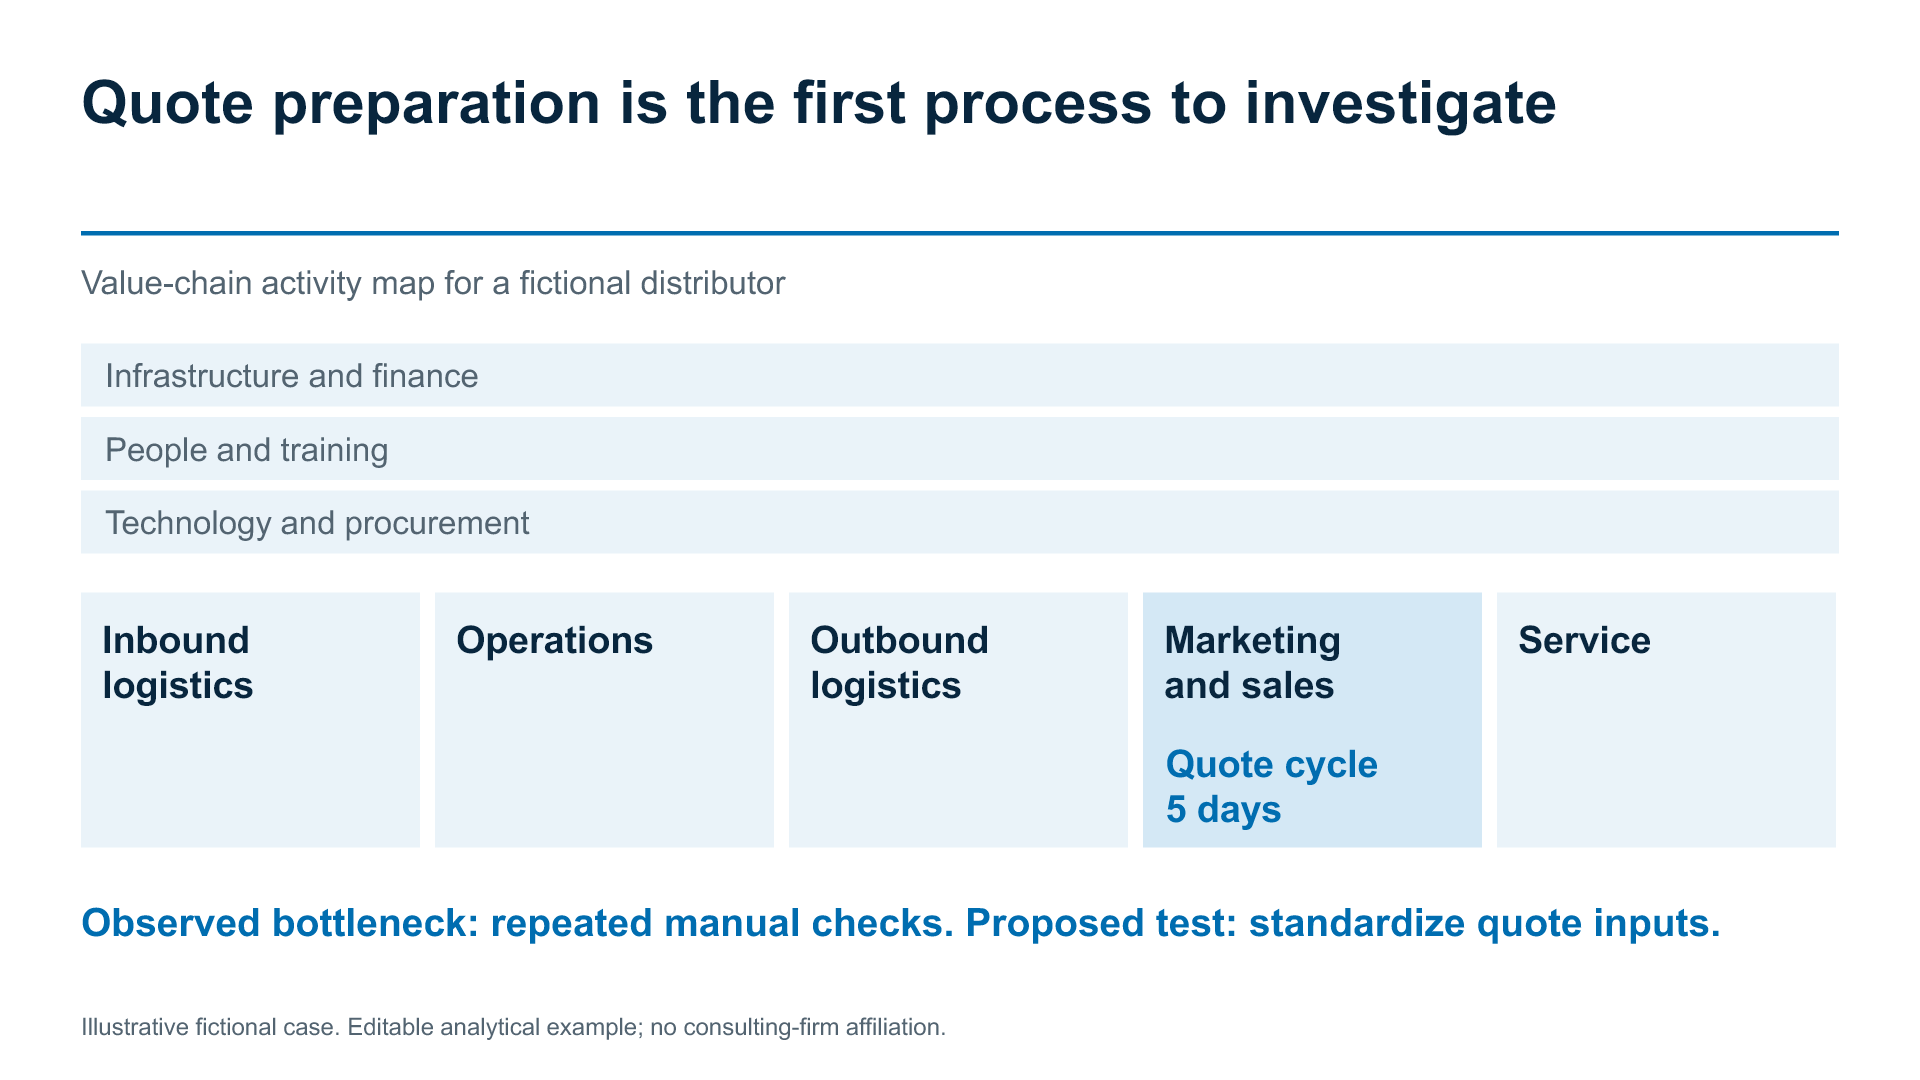
Original editable example: a five-day quote cycle identifies a process to investigate, not a proven cause of lost sales.
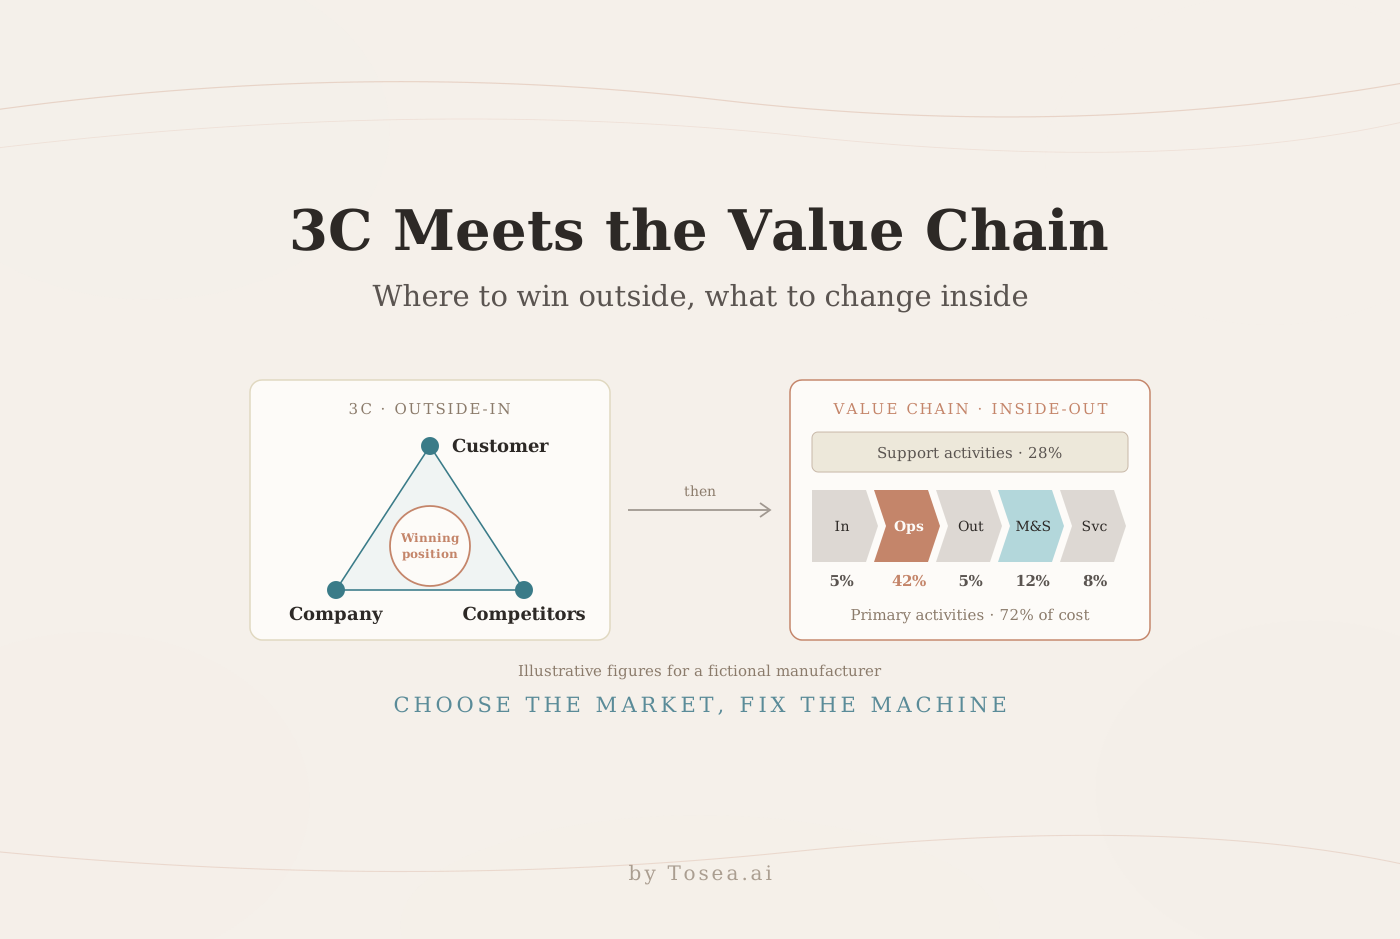
Place operational evidence near the affected activity. A slow quotation process may involve sales, finance, and product data rather than one department. Map the handoffs before deciding who owns the solution. Check whether faster processing would preserve quality and improve the customer outcome. Our McKinsey-style 3C and value chain guide shows how to pair the activity map with a customer and competitor view.
Copy-ready Value Chain prompt
Map the activities required to deliver [customer value proposition].
Use the uploaded process records, cost data, customer feedback, and operating metrics. Adapt primary and support activities to this business.
For each material bottleneck, show the metric, period, source, affected handoff, and customer consequence where evidence exists.
Create an editable activity map with one highlighted priority and a proposed test.
Distinguish observed delays from inferred causes. Do not allocate shared costs without stating the allocation basis.
4. DuPont analysis
When to use it
DuPont analysis explains return on equity through profit margin, asset turnover, and the equity multiplier. It is useful when managers need to distinguish operating improvement from changes in financial leverage. OpenStax explains the DuPont identity.
ROE = Net profit margin × Asset turnover × Equity multiplier
ROE means net income divided by average equity. Net profit margin is net income divided by revenue. Asset turnover is revenue divided by average assets. The equity multiplier is average assets divided by average equity. Multiplying the three ratios cancels revenue and average assets, leaving net income divided by average equity. Use consistent reporting periods and accounting definitions.
What the slide should show
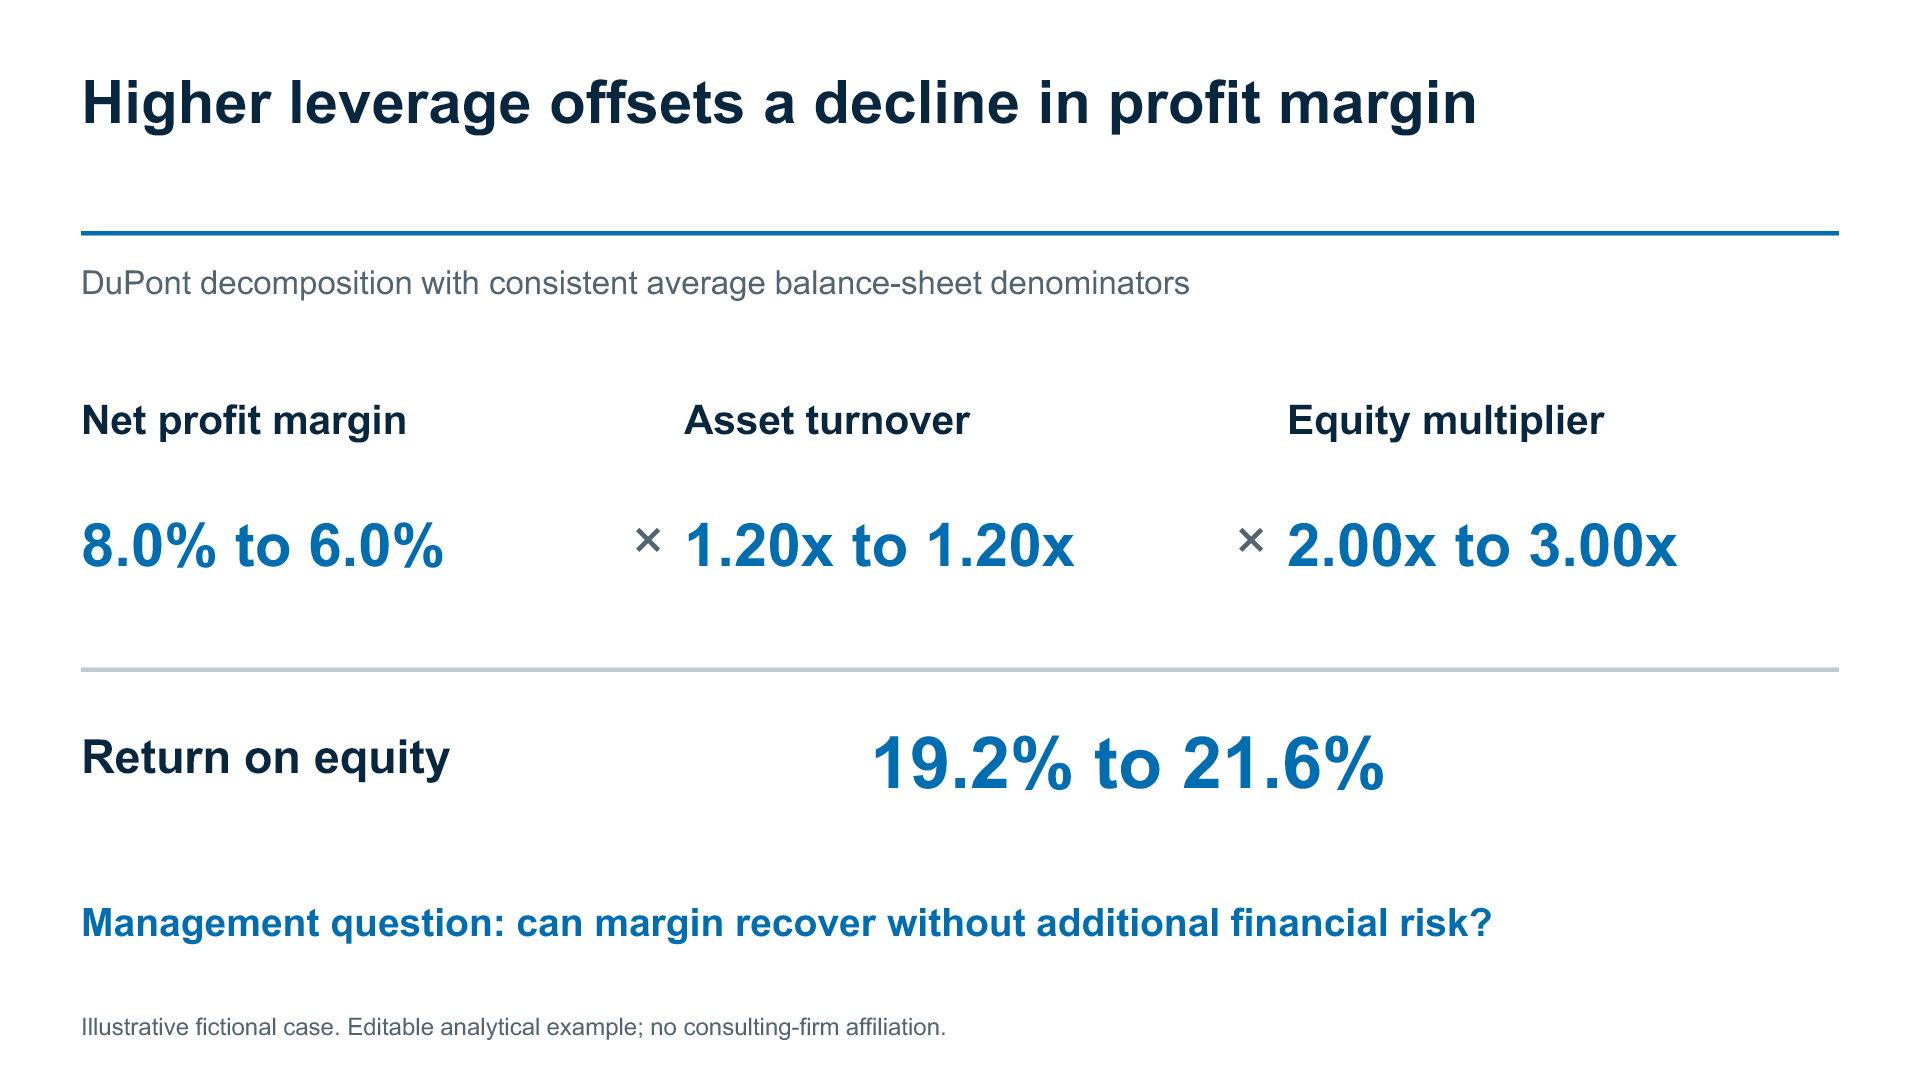
Original editable example: fictional margin falls from 8 to 6 percent while the equity multiplier rises from 2 to 3 times.
With asset turnover unchanged at 1.20 times, ROE rises from 19.2 to 21.6 percent (8.0% × 1.20 × 2.00 = 19.2%; 6.0% × 1.20 × 3.00 = 21.6%). The headline return improves despite weaker margin. Investigate the underlying causes before making recommendations. Negative or very small equity can make ROE difficult to interpret. When the audience needs a ranking across companies rather than an explanation of one company's movement, a composite score such as the Wall method is the better companion to DuPont.
Copy-ready DuPont prompt
Build a two-period DuPont analysis from the approved workbook.
Calculate net profit margin, asset turnover, equity multiplier, and ROE using consistent average balance-sheet denominators.
Reconcile the product to ROE and flag definition or rounding differences.
Create an editable driver diagram showing both periods and the supported management question.
Separate mathematical decomposition from causal explanations. Flag negative or unusually small equity and exceptional items. Cite each input.
5. PDCA
When to use it
Plan, Do, Check, Act provides a repeatable approach to improvement. Use it when a team has identified a problem and needs to test a change before scaling. ASQ describes PDCA as a four-step cycle with a small-scale test, analysis, and action based on learning.
Plan defines the problem, baseline, proposed change, and success criteria. Do runs the pilot. Check examines the results. Act standardizes a successful change or revises the next test.
What the slide should show
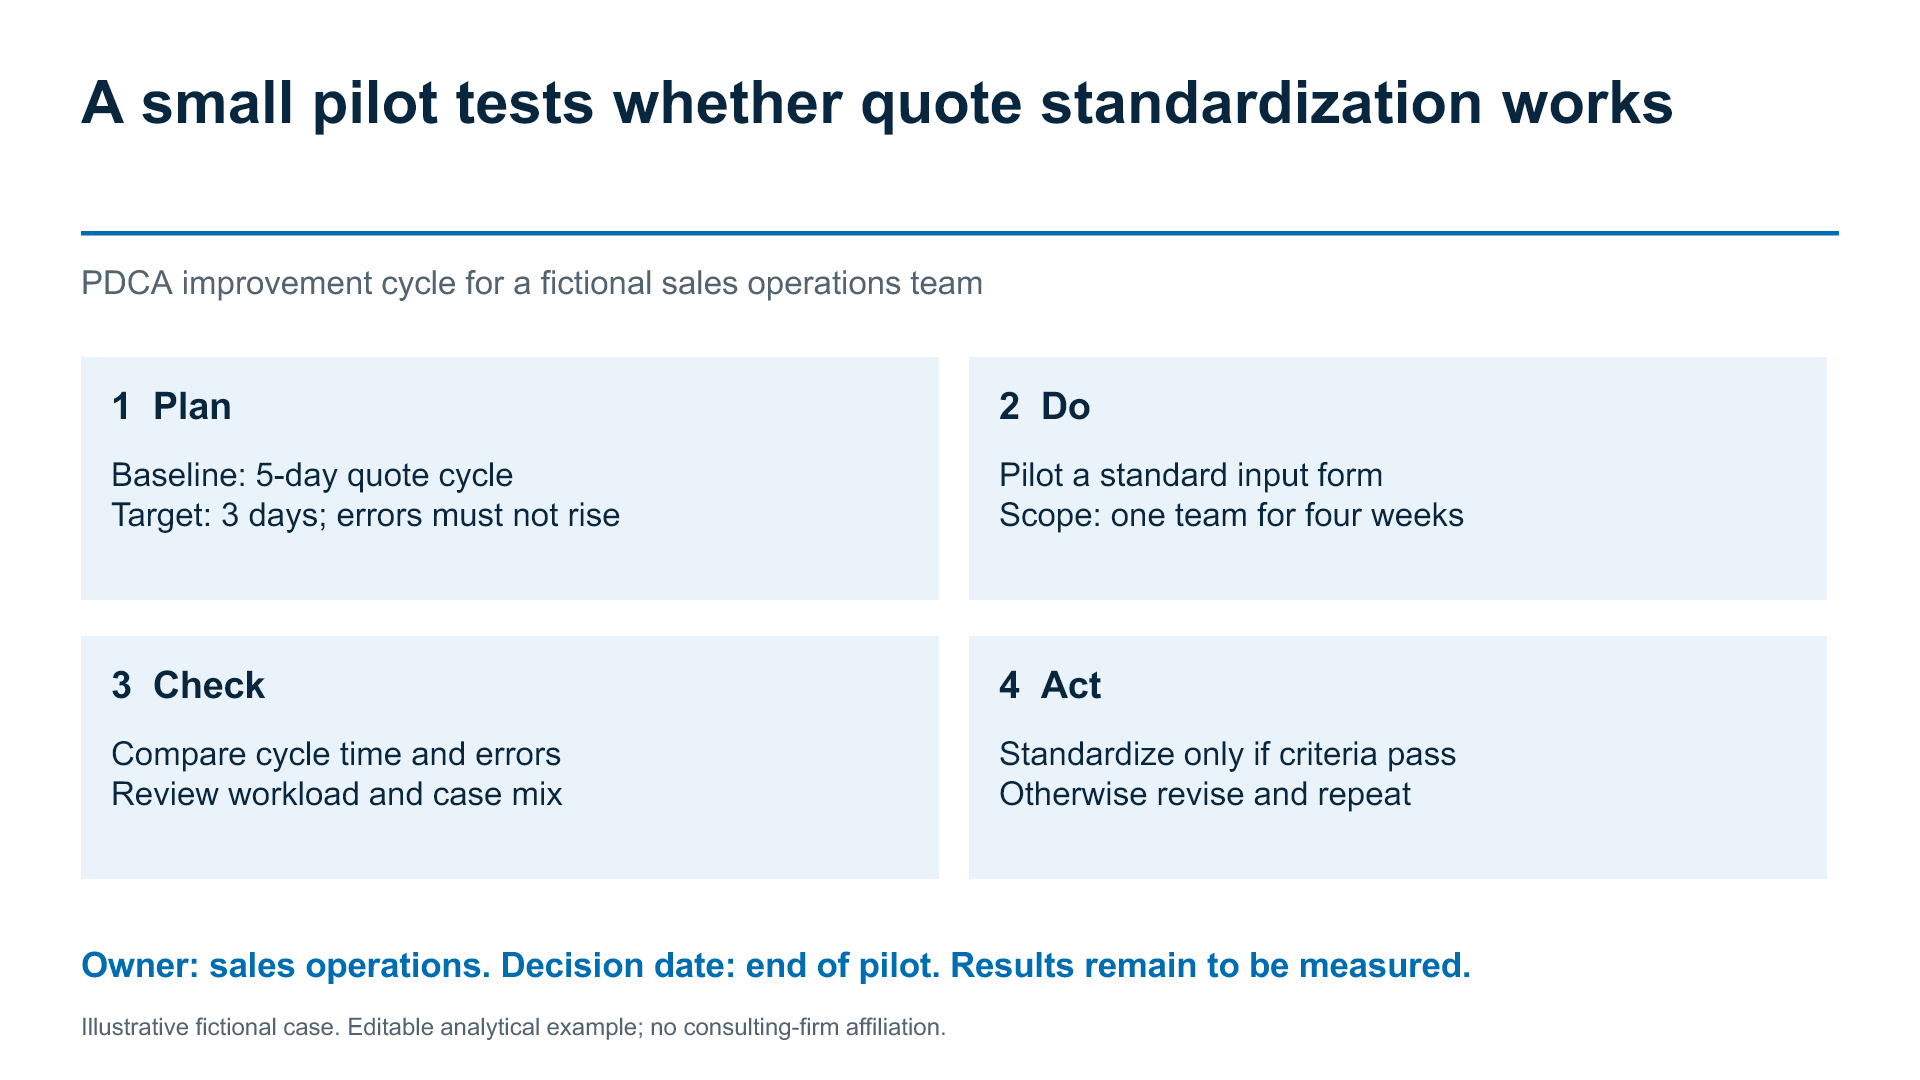
Original editable example: the proposed pilot targets a reduction from five to three days without increasing errors. Results remain to be measured.
Separate targets from results. Compare workloads and case mix to avoid a misleading pilot assessment. A pilot slide that already shows a green "success" badge before the Check stage is a planning document pretending to be a result. For a full PDCA deck with run charts and a Pareto view, see the Bain-style PDCA cycle guide.
Copy-ready PDCA prompt
Design a PDCA pilot for [operating problem] from the supplied records.
Specify baseline, target, scope, duration, owner, and acceptance criteria in Plan.
Describe the small-scale test in Do, measurement and comparison in Check, and the pass-or-revise decision in Act.
Include a quality guardrail and review date. Create an editable four-stage diagram.
Clearly label proposed actions, targets, and measured results. Do not claim causality from a simple before-and-after comparison.
How to run these prompts in Claude Code
Claude Code is a coding agent, but it works well for this kind of analysis because it reads local files, runs scripts, and writes its output back to disk where you can review it. That matters most for DuPont and PDCA, where the numbers should be calculated rather than typed.
- Make a project folder. Put exports in
data/(CSV or XLSX), source documents insources/(PDF, notes), and leave an emptyoutline/folder for results. - Write the ground rules once. Add a
CLAUDE.mdfile that states the company, decision, period, and audience, plus rules such as "use only files in data/ and sources/" and "mark missing evidence as data required." Claude Code reads this file at the start of each session, so you do not repeat the constraints in every prompt. - Paste one framework prompt at a time. Ask Claude Code to save the result as
outline/swot.md,outline/dupont.md, and so on. One file per framework keeps the review manageable. - Make the arithmetic reproducible. For DuPont, ask it to write a short Python script that reads the workbook and prints each ratio. You can rerun the script after a data correction instead of trusting a number in a paragraph.
- Review before you design. Read each outline file, check every source reference, and fix wording while it is still plain text.
The prompts work in any capable chat assistant, too. Claude Code simply keeps the files, the scripts, and the outline in one place. If you want Claude Code to go further and build slides directly, our roundup of Claude Code skills for PowerPoint compares the current options and their limits.
Create business framework slides in Tosea AI
Upload your approved sources to Tosea AI, name the decision, and paste the relevant prompt or the outline file Claude Code produced. Review the outline before rendering. Choose a layout or diagram during outline preparation, then revise individual pages after generation where needed.
Use a business template or a supported custom template to keep typography and spacing consistent. Data Studio lets you edit recognized chart data and import Excel or CSV files to build charts. Reconcile every extracted value against the original workbook.
For an approved existing deck, Beautify PPT/PDF can redesign uploaded PPTX or PDF pages. Choose Keep source pages when content and sequence must remain intact. Use Layout Only for later visual adjustments, then inspect labels, footnotes, and numbers. Our guide to beautifying a PowerPoint without changing its content walks through that workflow, and the current product updates list feature availability.
Frequently asked questions
Can Tosea AI redesign my existing PowerPoint without changing the content?
Yes. Upload the PPTX (or a PDF export) through Beautify PPT/PDF and choose Keep source pages. Use Layout Only for later visual changes, then compare labels, footnotes, and slide elements with the source.
How do I upload a PowerPoint and ask Tosea AI to redesign each slide?
Upload the PPTX or exported PDF, request preservation of content and sequence, and choose a template or visual direction. Generate the deck and inspect each slide before exporting the revised presentation.
Can I upload my own PowerPoint template to Tosea AI?
Custom templates are available on eligible paid plans. Check required layouts, fonts, colors, logo placement, and master-slide rules in the generated output before sharing it.
Can Tosea AI use custom brand colors, fonts, and a logo?
Yes. Specify colors and fonts, upload an approved logo, or use a supported custom template. Feature access depends on the plan. Verify font availability, color values, logo clear space, and contrast after export.
Can Tosea AI match the style of my old company presentations?
A representative deck can provide design guidance without implying permanent model training. Use an approved custom template for stronger consistency and compare the result with current brand guidelines.
Does Tosea AI preserve PowerPoint formatting after export?
Editable PPTX export aims to remain close to the preview. Fonts, complex graphics, and the application opening the file can affect results. Test the exported presentation in the exact delivery environment.
Can I tell AI to edit the layout only and keep the exact wording?
Yes. Layout Only changes visual structure without intentionally rewriting approved content. Compare labels, citations, footnotes, line breaks, and numbers with the original after editing.
Continue building better business presentations
Explore 10 business presentation prompts for ChatGPT and Claude and the business dashboard PowerPoint guide for related examples. For a deeper set of consulting frames, the Bain-style decision-making frameworks guide covers ten more.
The business frameworks every professional should know become useful when they support a specific decision. Tosea AI helps turn your evidence and chosen framework into an outline, readable slides, editable charts, and a PowerPoint you can refine. Start with one management question and use the matching prompt above.
Sources
- SWOT analysis factsheet — CIPD
- The Five Forces — Institute for Strategy and Competitiveness, Harvard Business School
- Distinctive Value Chain — Institute for Strategy and Competitiveness, Harvard Business School
- Profitability Ratios and the DuPont Method — OpenStax, Principles of Finance
- PDCA Cycle: Plan-Do-Check-Act — ASQ
- Claude Code overview — Anthropic