10 Best AI Prompts for Research Presentations in 2026 (With Examples)
10 copy-ready AI prompts for research presentations: paper explainers, conference talks, thesis defenses, journal clubs, results slides, graphical abstracts and reviewer Q&A.
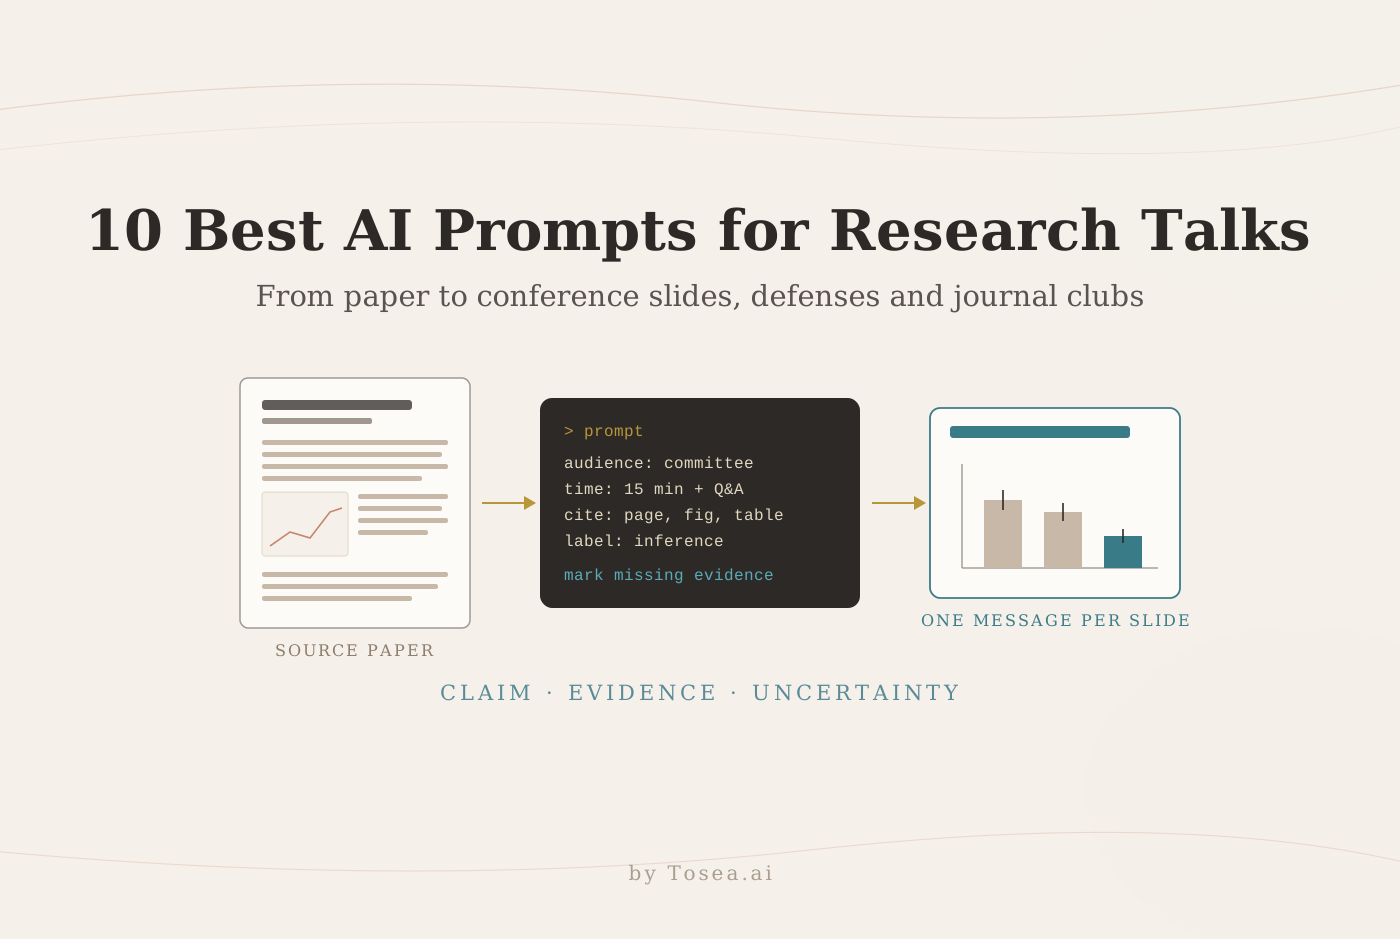
The 10 best AI prompts for research presentations in 2026 help researchers turn papers, data, and technical arguments into talks that an audience can follow and question. The strongest prompt does more than request slides. It defines the audience, time limit, approved sources, scientific claim, evidence boundary, visual form, and verification rules.
This guide gives you ten copy-ready prompts organized by presentation situation, explains when to use each one, and shows how Tosea AI can convert an approved outline and source paper into a structured, editable presentation. If you need prompts tuned to a specific discipline, such as biology, finance, or physics, our companion list of field-specific prompts for academic presentation slides covers that angle.
Quick answer: Start with the research decision. Separate paper claims, prior literature, evidence-based inference, and uncertainty. Review the outline, then verify every number, figure, citation, and limitation.
What makes a research presentation prompt reliable
A useful prompt specifies audience, purpose, source boundary, storyline, output, and verification. The Broad Institute Communication Lab at MIT recommends connecting experiments to the larger motivation and giving each slide one message. Harvard Catalyst emphasizes structure, audience context, and story flow.
AI cannot establish scientific validity merely by summarizing. Supply the paper, supplements, and approved context. Require page, figure, or table references, and label missing evidence. The single most useful habit is to make the model sort every statement into an evidence class before anything becomes a slide.
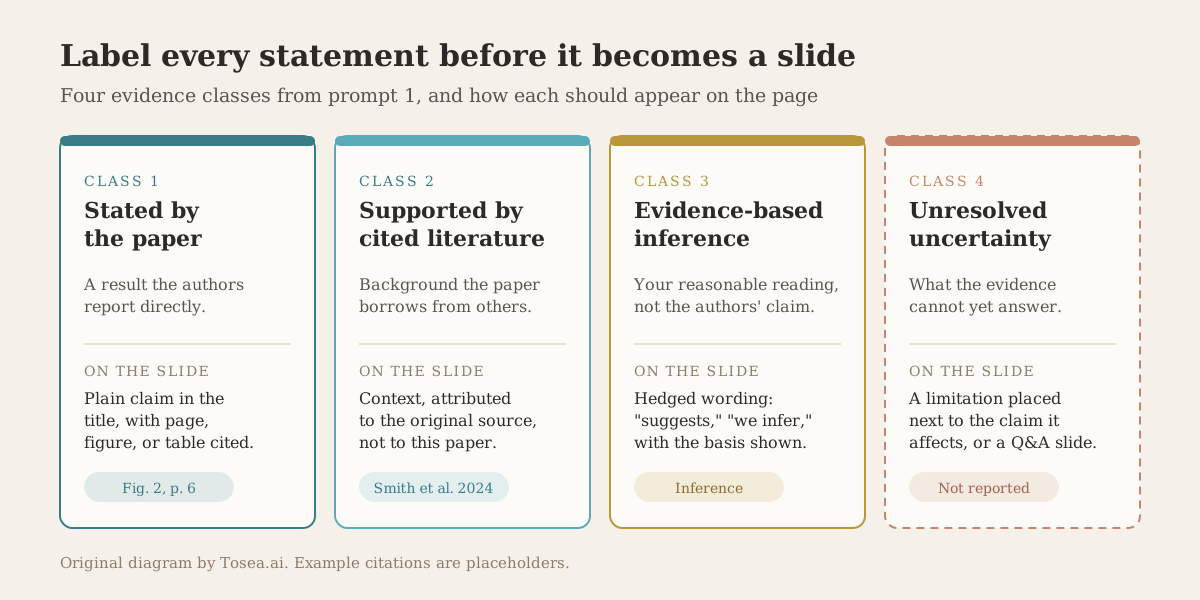
Original diagram. Labeling each statement this way keeps inference and uncertainty visible after the outline is turned into slides.
Which prompt to use when
| Situation | Prompt | Typical output |
|---|---|---|
| You need to understand the paper first | 1. Reviewer-style paper explanation | 10-slide annotated outline |
| You have a 15-minute conference slot | 2. Conference talk | 10–12 slides with timing |
| You are defending a thesis | 3. Thesis defense storyline | Slide map, transitions, backup slides |
| You are leading a journal club | 4. Critical appraisal | 9 slides plus discussion |
| Your method is hard to follow | 5. Method and pipeline visualization | 4 method slides |
| Your results need careful framing | 6. Results and uncertainty | Up to 5 results slides |
| You are motivating a new study | 7. Literature review and gap | 6 slides with comparison matrix |
| Your audience is from another field | 8. Cross-disciplinary briefing | 8 slides with glossary |
| You need one summary slide | 9. Graphical abstract | 1 slide with alt text |
| You expect hard questions | 10. Reviewer Q&A | Ranked questions and backup slides |
1. Reviewer-style paper explanation
Use this when you need to understand a paper before building any slides.
Act as a rigorous peer reviewer. Analyze the attached paper for a research presentation.

Explain four sections: research problem, prior work, core intuition, and method. For the method, trace one concrete example from input through processing to output. Define every symbol in every equation and explain its mathematical intuition.

Label each statement as one of four evidence classes: stated by the paper, supported by cited literature, evidence-based inference, or unresolved uncertainty. Cite the page, section, figure, or table for every important claim. Do not invent missing experimental details.

Output a 10-slide outline with an action title, evidence, proposed visual, source reference, and speaker note for each slide.
Example: Turn a methods paper into problem, baseline, intuition, pipeline, results, limitations, and discussion.
2. A 15-minute conference talk
Create a research conference presentation from the attached paper for a 15-minute talk and 5-minute Q&A. Audience: researchers in the field who do not know this project.

Allocate time by section. Open with the practical or scientific problem, establish the gap, explain one core idea, show only the methods needed to trust the results, present two to three decisive findings, then close with limitations and the main takeaway.

Return 10 to 12 slides. For each slide provide one conclusion-style title, no more than three supporting points, one recommended visual, its source, and speaker notes. Do not change reported values or imply causality beyond the study design.
Example: A clinical study talk can allocate two slides to context, two to design, four to results, and the remainder to safety, limitations, and implications. For timing and rehearsal, see the 15-minute academic conference talk guide.
3. PhD thesis defense storyline
Build a thesis defense storyline for a 30-minute presentation using the dissertation and committee requirements.

Identify the central research question, why it matters, the thesis-level contribution, and how each study chapter supports that contribution. Separate shared methods from chapter-specific methods. Show how evidence accumulates across chapters and where findings remain uncertain.

Produce a slide map with section timing, transition sentences, candidate visuals, backup slides, and five likely committee questions. Preserve terminology and citations from the dissertation. Flag claims that are broader than the evidence.
Example: Connect three dissertation studies into one cumulative argument. Our complete thesis defense presentation guide covers slide-by-slide structure and rehearsal.
4. Journal club critical appraisal
Prepare a journal club presentation for graduate researchers using the attached article and reporting guideline relevant to its study design.

Cover the research question, design, population, exposure or intervention, comparator, outcomes, statistical approach, main effect estimates, uncertainty, bias, generalizability, and reproducibility. Distinguish statistical significance from practical importance.

Create 9 slides plus a discussion slide. Include a study-design diagram, one reconstructed results visual using only reported data, a strengths-and-limitations table, and three discussion questions. Cite exact locations in the paper. Mark unreported items as not reported.
Example: Preserve allocation, attrition, effect size, confidence interval, and analysis population in a trial review. The EQUATOR Network indexes reporting guidelines such as CONSORT and STROBE if you need to choose one.
5. Method and pipeline visualization
Convert the method section into a technically accurate presentation sequence.

Identify inputs, preprocessing, model or experimental stages, decision points, outputs, assumptions, and failure modes. Use one realistic running example throughout. For every equation, define all symbols, subscripts, superscripts, operators, units, and dimensions.

Return four slides: end-to-end pipeline, one worked example, computational or experimental detail, and validation. Recommend a flowchart, annotated schematic, equation-to-geometry view, or timeline where appropriate. Never add a processing step that is absent from the source.
Example: Follow one scan through normalization, segmentation, prediction, and evaluation.
6. Results, uncertainty, and visual evidence
Design the results section from the attached tables, figures, and analysis outputs.

First identify the minimum evidence needed to support each claim. Preserve sample size, denominator, units, baseline, effect estimate, uncertainty interval, model adjustment, and comparison period. Recommend the correct chart for each claim and explain why.

Create no more than five results slides. Each slide must contain one claim, one visual, one interpretation, and one limitation. Recalculate displayed differences where possible and report any inconsistency. Do not infer significance, causality, or subgroup effects that the source does not establish.
Example: Show a treatment effect with its confidence interval, not only two bars.
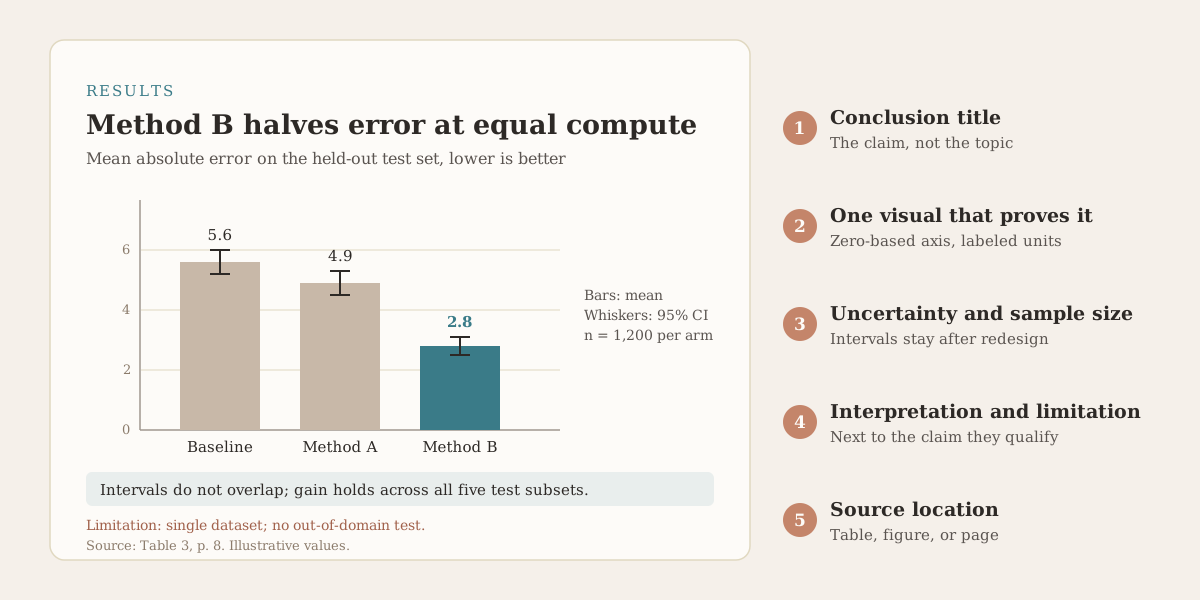
Original diagram with illustrative values. Following the MIT Communication Lab's advice, the title states the conclusion and the evidence directly below supports it.
7. Literature review and research gap
Synthesize the attached literature into a research-gap presentation. Use only the supplied papers and bibliography metadata.

Group prior work by mechanism, method, population, or unresolved question rather than listing papers chronologically. Compare what each cluster establishes, where results conflict, and which limitation motivates the present study.

Return six slides: field map, major approaches, strongest established evidence, disagreement, unresolved gap, and how the new study addresses it. Include a comparison matrix with citations. Do not claim novelty until the supplied literature supports it.
Example: Map evidence by population and outcome to test whether the gap is real.
8. Cross-disciplinary research briefing
Translate the attached research for an audience of specialists from adjacent fields.

Identify which concepts the audience already knows, which terms need definition, and which technical details are essential for evaluating the contribution. Keep scientific precision while replacing field-specific shorthand with short explanations.

Create an 8-slide briefing with a shared problem, conceptual model, method, decisive evidence, limitations, and collaboration opportunities. Add a glossary only for terms used more than once. Preserve all quantitative qualifiers and uncertainty.
Example: Explain model inputs, clinical relevance, validation population, and failure cases to clinicians.
9. One-slide graphical abstract
Turn the attached study into one graphical abstract slide for a research seminar.

Use three regions: question and population, method and evidence, result and implication. Select one primary outcome and one necessary uncertainty measure. Propose a left-to-right visual path with labels that can be understood in 20 seconds.

Provide exact slide copy, layout instructions, figure sources, and alt text. Exclude secondary findings, decorative icons, unsupported mechanisms, and conclusions beyond the study population.
Example: Show population, exposure, adjusted outcome, uncertainty, and generalizability.
10. Reviewer Q&A and backup slides
Act as a skeptical domain reviewer. Audit the proposed research presentation and prepare the Q&A appendix.

Generate questions about design validity, assumptions, confounding, measurement, missing data, power, model specification, robustness, external validity, ethics, and reproducibility. Rank each question by likelihood and consequence.

For the top ten questions, draft a concise evidence-based answer and identify the exact source. Propose backup slides only when a figure, table, sensitivity analysis, or definition materially improves the answer. Mark questions that the available evidence cannot resolve.
Example: Build backup slides for eligibility, power, sensitivity, subgroup, and governance questions.
Five mistakes these prompts are designed to prevent
- Topic titles instead of claims. "Results" tells the audience nothing. "Method B halves error at equal compute" tells them what to look for.
- Inference presented as finding. If the paper does not state it, the slide should say "we infer" or "suggests," not "shows."
- Uncertainty dropped in the redesign. Confidence intervals and sample sizes are the first things to disappear when a chart is simplified. Prompts 6 and 9 require them explicitly.
- Pasting dense paper figures. A four-panel journal figure is built to be read on paper. On a slide, crop to the panel that proves the claim.
- Invented detail. When a source is silent, the model will fill the gap unless told not to. Every prompt here ends with an instruction to mark missing items instead.
The fourth point deserves a picture. The MIT Communication Lab recommends adapting a paper figure to the message of the slide rather than reusing the published version.
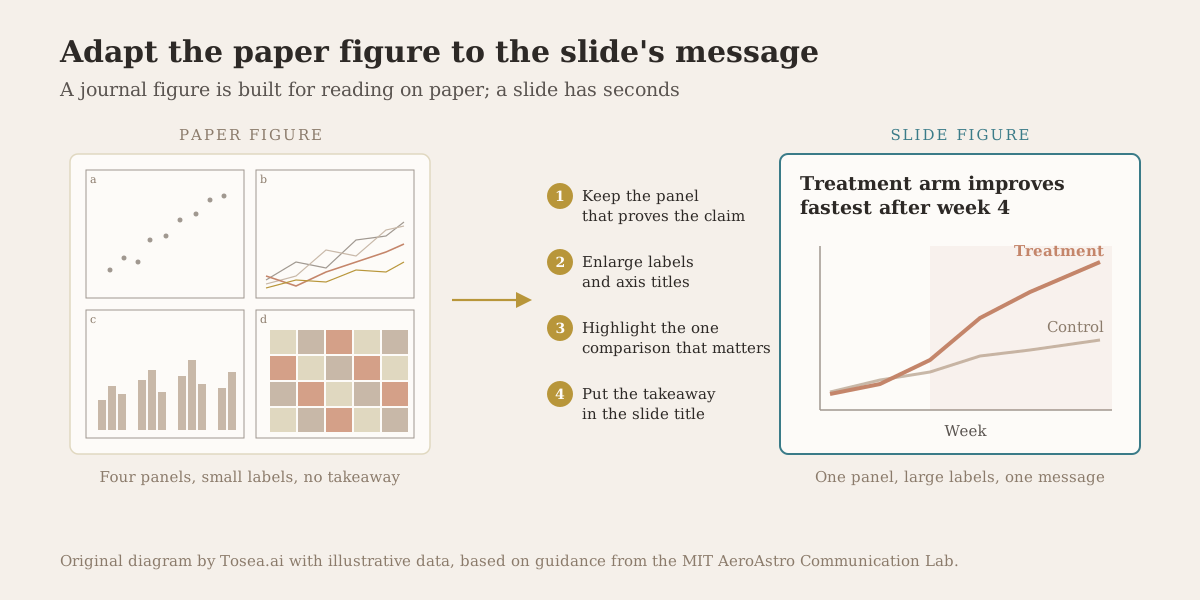
Original diagram. Crop to the panel that carries the claim, enlarge labels, highlight the comparison, and put the takeaway in the title.
How to turn these prompts into slides with Tosea AI
Tosea AI for research papers keeps source documents, selected figures, outlines, notes, and slide generation in one workflow. Upload the files, define the audience and duration, paste a prompt, and review the outline before rendering. Choose extracted figures, adjust layouts or diagrams, and export editable PPTX on eligible plans.
You can correct the argument at the outline stage, then revise one slide without rebuilding the deck. That matters for research decks because most errors are argument errors, not design errors, and they are cheaper to fix before slides exist. The author remains responsible for scientific meaning, citations, equations, statistics, permissions, and confidential data.
For a longer walkthrough of the same process, see from a 30-page research paper to professional slides and how to turn a research paper into a presentation without losing figures and citations.
Final verification checklist
- Every numerical claim matches the source, including units and denominators.
- Every figure has a readable axis, legend, sample size, uncertainty definition, and source.
- Each slide has one message that the evidence on that slide supports.
- Inferences are labeled as inferences, not findings.
- Limitations appear next to the affected conclusion, not only at the end.
- The spoken timing has been tested, including transitions and questions.
- Sensitive, copyrighted, unpublished, and patient-level material has appropriate permission.
Frequently asked questions
Do these prompts work with ChatGPT, Claude, and Gemini?
Yes. They are model-agnostic. Results are better when the model can read the full PDF, including figures and tables, rather than pasted text. Always ask for page or figure references so you can check the answer.
Can Tosea AI redesign my existing PowerPoint without changing the content?
Yes. Upload the PPTX or a PDF with Beautify PPT/PDF (available on Pro and above) and keep the default "Keep source pages" option, which preserves the page count, order, and content while redesigning the layout. Use Layout Only for later visual changes. Compare labels, footnotes, citations, and line breaks with the source before presenting.
How do I upload a PowerPoint and ask Tosea AI to redesign each slide?
Choose Beautify PPT/PDF, upload the PPTX or PDF, and keep the source pages so every slide is redesigned while retaining content and order. Choose a template or describe the visual direction, generate the deck, and inspect every slide before export.
Can I upload my own PowerPoint template to Tosea AI?
Tosea AI supports custom templates on eligible paid plans. Confirm that required layouts, fonts, colors, logo placement, and master-slide rules are represented correctly before sharing the final deck.
Can Tosea AI use custom brand colors, fonts, and a logo?
Yes. Provide the required colors, fonts, and logo in the instructions or use a supported custom template. Verify font availability, color values, contrast, and logo clear space after export.
Can Tosea AI match the style of my old presentations?
Tosea AI can use a representative deck as design guidance. This does not imply permanent model training. For repeatable consistency, use an approved template and compare the result with your lab or institution's style rules.
Does Tosea AI preserve PowerPoint formatting after export?
Editable PPTX export is designed to stay close to the generated preview while keeping elements available for editing. Fonts, complex graphics, and the application used to open the file can affect results. Test the exported deck in the delivery environment.
Can I tell AI to edit the layout only and keep the exact wording?
Yes. Layout Only changes visual structure without intentionally rewriting slide content. Compare the new slide with the source to confirm labels, citations, footnotes, numbers, and line breaks.
Make the evidence easy to inspect
Research slides should make evidence easier to inspect, not merely easier to decorate. With a source-bound prompt, deliberate outline review, and final human verification, Tosea AI helps researchers move from a dense paper to a clear, editable presentation while retaining control over the claims that matter. For examples of the method applied to specific papers, see how we presented AI classroom engagement research and a game-theory model of academic hiring.
Editorial note: Tosea AI is not affiliated with or endorsed by MIT, the Broad Institute, or Harvard University. The diagrams in this article are original illustrations.
Sources
- Slideshow (CommKit) — Broad Institute Communication Lab, MIT
- Slide Design (CommKit) — MIT AeroAstro Communication Lab
- Follow a Structure — Harvard Catalyst Writing and Communication Center
- EQUATOR Network — reporting guidelines for health research
- AI presentation maker for research papers — Tosea AI