


Business dashboard prompts for PowerPoint
Three prompts that each build a one-slide business dashboard: a financial view for the CFO, an operations view for plant and supply chain leaders, and a sales and marketing view for revenue leaders. Each pairs four KPI cards with charts that lead to a stated decision.
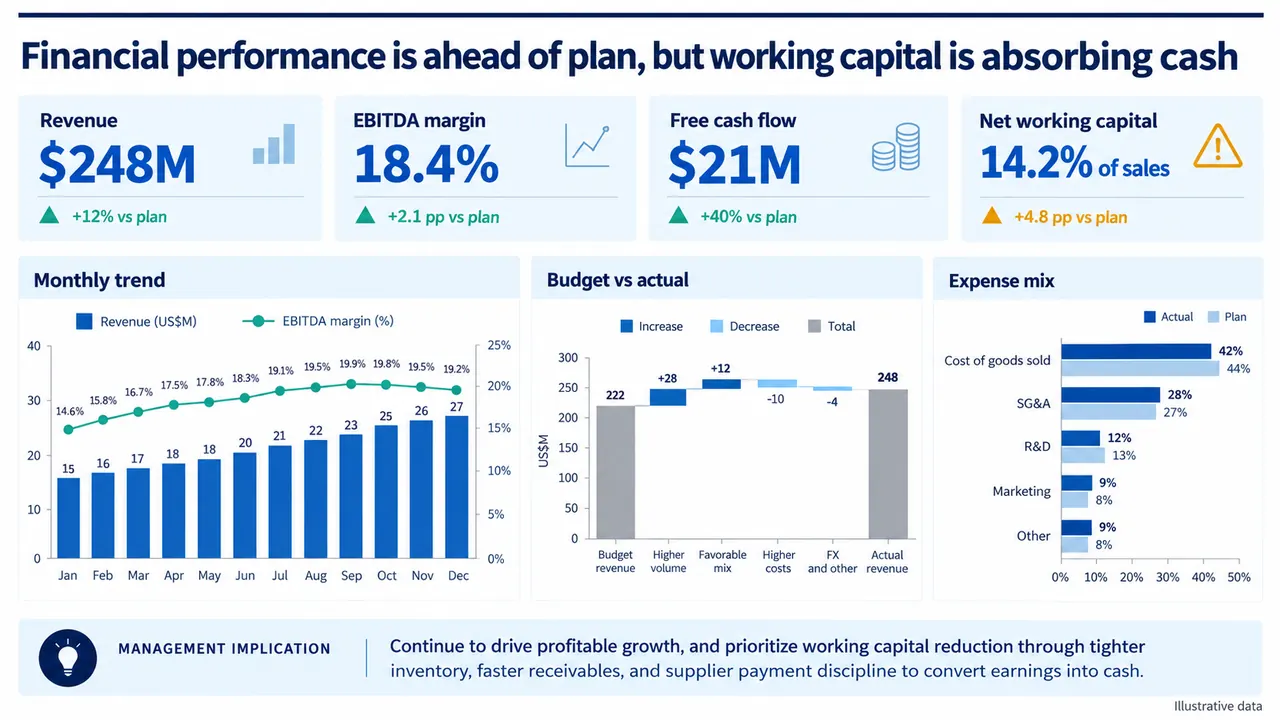
Business dashboard prompt
Pick a slide, fill in any highlighted fields, then copy or run it.
Create one 16:9 financial dashboard from the uploaded files.

Audience: CFO and executive committee
Decision: protect cash conversion while meeting the profit plan

Show revenue, EBITDA margin, free cash flow, and net working capital cards, each with its comparison basis. Add a monthly revenue and margin trend, a budget-to-actual revenue waterfall, and an expense mix versus plan.

Write an action title. Make the monthly values reconcile to the annual totals and the waterfall steps reconcile from budget to actual. Calculate the full-year margin as a revenue-weighted average. Preserve values, units, periods, currency, definitions, and sources. Use editable navy and blue charts with teal and amber accents. Flag missing data instead of estimating it.
Create one 16:9 operations dashboard from production, inventory, and supplier data.

Audience: COO, plant leaders, and supply chain management
Decision: identify the constraint reducing on-time delivery and assign recovery

Show output, OEE, inventory turns, and on-time delivery cards. Add a weekly throughput trend with downtime, a downtime ranking by line for the same period, and a supplier delivery-quality matrix.

Use a conclusion title and show KPI variance. Make the downtime-by-line totals reconcile with the weekly downtime series and state the period on every chart. Keep definitions consistent, label sources, and end with actions, owners, and review dates. Do not invent causes.
Create one 16:9 sales and marketing dashboard from CRM and campaign files.

Audience: chief revenue officer, sales leaders, and marketing leaders
Decision: improve conversion and reallocate acquisition spending

Show revenue, pipeline coverage, win rate, and acquisition cost cards. Add revenue versus target, a funnel with counts and stage conversion rates, a segment bubble chart (growth vs operating margin, bubble = revenue), and a channel CAC ranking.

Write an action title. State the denominator for every rate. Preserve stage definitions, cohort dates, attribution, currency, and sources. End with conversion, channel, and segment actions that follow from the charts. Flag missing denominators.
Why these prompts work
Each one names a decision
Each prompt states a decision, such as "protect cash conversion while meeting the profit plan", so the four KPI cards are chosen for it rather than by habit.
The numbers must reconcile
The financial prompt makes monthly values add to annual totals and waterfall steps run from budget to actual. The operations one ties downtime by line to the weekly series.
Every rate has a denominator
"State the denominator for every rate" on the sales dashboard means a win rate or stage conversion cannot hide what it was measured against.
Cards carry a comparison
KPI cards come "each with its comparison basis" or with variance, so a margin figure shows next to plan or the prior period instead of standing alone.
Adapt it to your own deck
Swap in your KPIs
Keep four cards but use your metrics. A SaaS finance team might write "Show ARR, net revenue retention, gross margin and cash runway cards, each against plan."
Fix one period per chart
Dashboards easily mix weekly, monthly and annual data. Add "Use the same period on every chart and state it in each chart title."
Match your brand colors
The financial prompt asks for navy and blue with teal and amber accents. Replace that line with your own palette, or delete it and pick a branded template.
Business dashboard FAQ
What is a business dashboard slide?
A single slide that shows a handful of key metrics against target or the prior period, plus a few charts that explain the movement. In a presentation it works as a status summary that leads to one or two decisions.
Which dashboard prompt should I start with?
Use the financial prompt for monthly or annual results and cash, the operations prompt for throughput, downtime and delivery, and the sales and marketing prompt for pipeline, conversion and acquisition cost.
Do these prompts work in ChatGPT, Claude or Gemini?
Yes. A chat assistant can calculate the KPIs and describe each chart, but you still build the slide. In Tosea you attach your report with the prompt, pick a template, and get a slide you can edit and export to PowerPoint (.pptx).
Figures on the example slides are illustrative.
Prefer not to write a prompt?
Upload the document. Tosea drafts the deck, you edit and export.
Start for free