


Annual business review prompts for PowerPoint
Three prompts for the core slides of an annual business review: a full-year operating dashboard built from an Excel workbook, a profit-to-cash bridge from the audited financial report, and a department KPI scorecard that ends with one owner and one priority action.
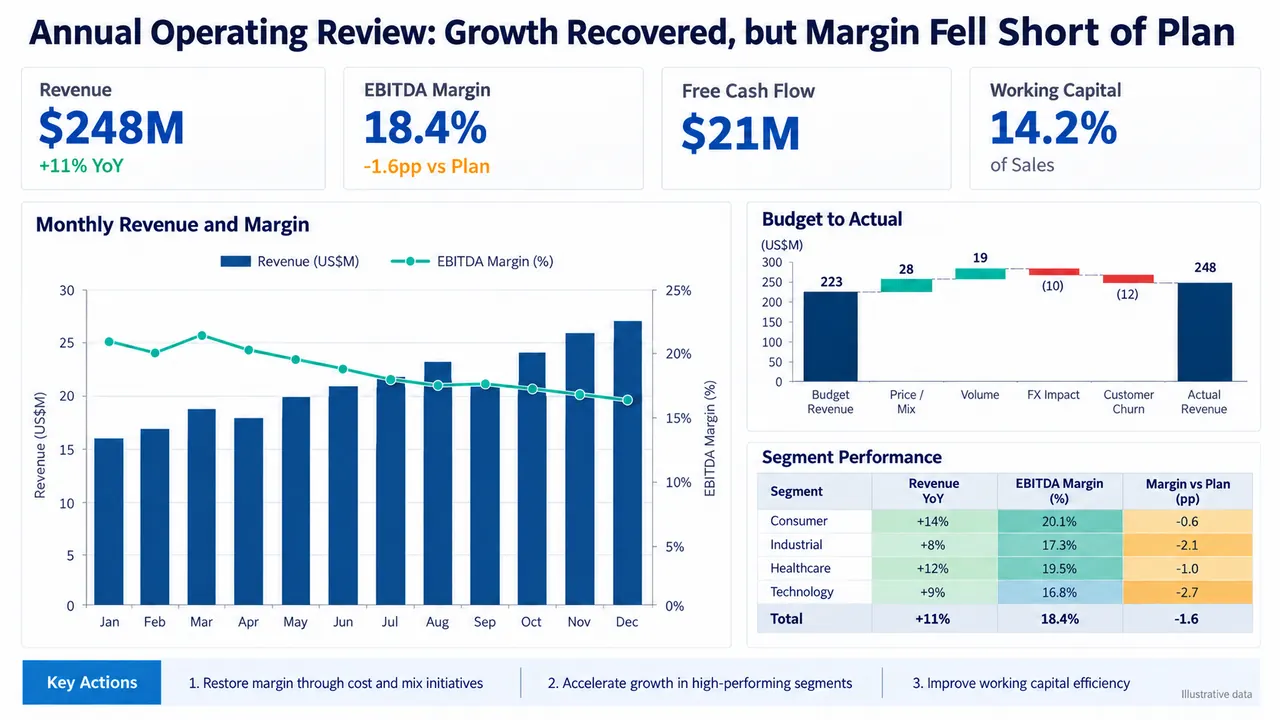
Annual business review prompt
Pick a slide, fill in any highlighted fields, then copy or run it.
Create a 16:9 annual operating review from the uploaded Excel workbook.
Audience: CEO, CFO, and business unit leaders.
Decision: explain full-year performance and identify next-year actions.
Show revenue, EBITDA margin, free cash flow, and working capital against plan and prior year. Add a monthly revenue and margin trend, a budget-to-actual waterfall, and a segment performance heatmap. Put the conclusion in the title. Reconcile monthly values to annual totals. Preserve units, periods, definitions, and sources. Flag missing or conflicting data instead of estimating it.
Create one executive analysis slide from the uploaded annual financial report.
Use the audited statements and notes as the source of record. Show a three-year table for revenue, gross profit, operating income, and free cash flow. Add a waterfall from operating income to free cash flow, separating receivables, inventory, capital expenditure, tax, and other items. Explain material changes using the management discussion, but do not invent causes. Label currency, period, accounting basis, and source pages. Flag non-GAAP measures and preserve the reconciliation.
Create a 16:9 department KPI scorecard from the uploaded files.
Audience: executive committee and department heads.
Compare Finance, Sales, Operations, and People using one primary KPI per function. For each KPI, show actual, target, variance, status, owner, and reporting period. Use target-versus-actual bullet charts and consistent status rules. Put the largest management gap in the title. End with one priority action, one accountable owner, and the next review date. Do not compare KPIs that use different definitions or periods.
Why these prompts work
Two baselines, not one
The dashboard prompt compares revenue, EBITDA margin, free cash flow and working capital against both plan and prior year, so growth and plan delivery read separately.
Audited figures are the record
"Use the audited statements and notes as the source of record" and "Flag non-GAAP measures" keep adjusted figures from quietly replacing reported ones.
Like-for-like KPIs only
"Do not compare KPIs that use different definitions or periods" stops the scorecard from ranking functions on numbers that do not line up.
One gap, one owner
The scorecard puts the largest management gap in the title and ends with one priority action, one accountable owner and the next review date.
Adapt it to your own deck
State your fiscal year and units
Say it once at the top: "Fiscal year ends March 31. Report in US$ millions to one decimal." The prompts already ask the model to preserve units and periods.
Pick your own functions
The scorecard covers Finance, Sales, Operations and People. Replace them with yours and name one KPI each: "Product: on-time release rate. Support: first-response time."
Grow it into a full deck
Use the three slides as the core, then add "Open with a one-slide summary of three results and close with one slide of next-year targets."
Annual business review FAQ
What goes in an annual business review presentation?
Full-year results against plan and prior year, the drivers behind the main variances, cash generation, performance by segment or function, and priorities for the coming year. It is usually presented to the leadership team or the board.
What is a profit-to-cash bridge?
A waterfall chart that starts at operating income and steps through working capital changes, capital expenditure and taxes to free cash flow. It shows why reported profit and the cash a business generated differ.
Can I use these in ChatGPT, Claude or Gemini?
Yes. A chat assistant will calculate figures and draft slide text from your files, and you build the charts yourself. In Tosea you attach the annual report with the prompt, pick a template, and get slides you can edit and export to PowerPoint (.pptx).
Figures on the example slides are illustrative.
Prefer not to write a prompt?
Upload the document. Tosea drafts the deck, you edit and export.
Start for free