How to Create an Annual Business Review PowerPoint with AI from Excel, Reports, and KPIs
Turn Excel workbooks, annual financial reports, and department KPIs into a decision-ready annual business review PowerPoint with AI: an 8-step SOP, three worked slides, prompts, and QC checks.
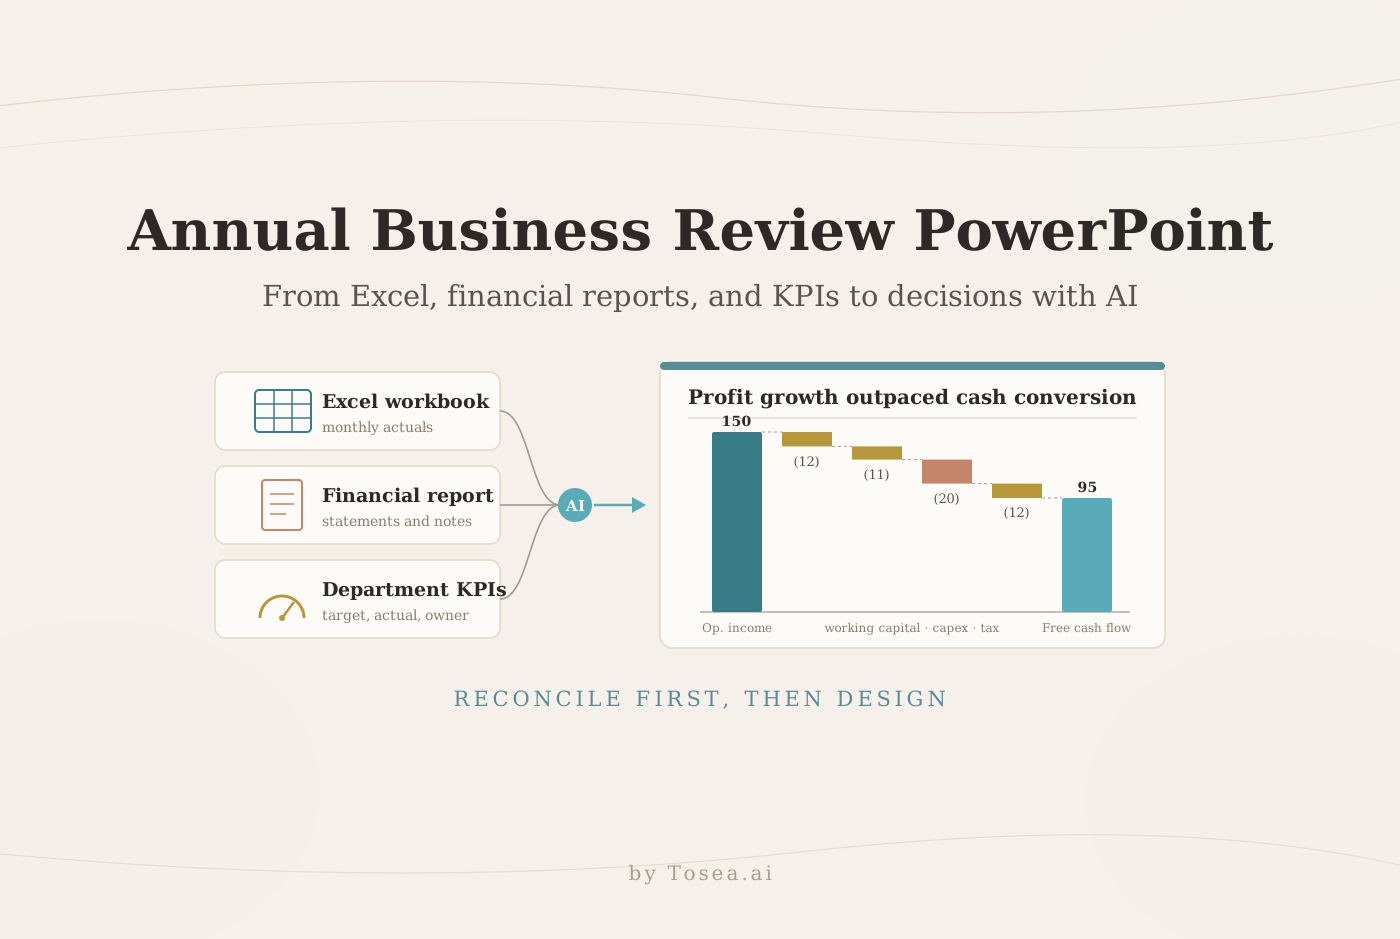
An AI annual business review PowerPoint should do more than move numbers from Excel into slides. It should define the management question, reconcile the source data, show what changed, explain why it changed, and end with actions that have owners. This tutorial gives finance teams, business analysts, department leaders, and consultants a practical workflow for turning Excel workbooks, annual financial reports, and department KPI files into a decision-ready deck with Tosea AI.
Quick answer: Start by fixing the scope and comparison basis. Build an eight-step analysis plan, normalize the files, verify the totals, and separate enterprise outcomes from department drivers. In Tosea AI, upload the source material, refine the outline, import Excel or CSV into Data Studio, select editable charts, apply a template, review every value, and export the final PPTX.
What an annual business review deck has to do
An annual business review is not a longer quarterly review. A QBR deck tracks progress inside a plan that is still running; an annual review closes the year, explains the full-year result against plan and prior year, and resets the plan for the next twelve months. It is also not a board deck, which compresses the same evidence into a handful of decisions for directors, or an earnings call presentation, which is written for external investors under disclosure rules.
That difference shapes the deck. The audience is usually the CEO, CFO, and business unit leaders, and they need three things from it:
- A verdict on the year. Did growth, margin, and cash land where the plan said they would, and if not, by how much?
- A causal explanation. Which segments, functions, and operating drivers produced the gap?
- Committed next steps. Which actions carry into next year's plan, who owns them, and how will progress be reviewed?
Every page should serve one of those three jobs. If a slide only restates a table from the finance pack, it belongs in the appendix.
Use an eight-step operating analysis workflow
Treat annual review work as analysis first and slide production second. The eight stages below form a repeatable process.
- Define objective and scope. Name the audience, decision, period, business units, and comparison basis.
- Build the framework. Use a balanced scorecard, value chain, or driver tree before opening the data.
- Prepare and validate data. Check completeness, definitions, periods, currencies, signs, and ownership. Investigate differences between finance and operating systems.
- Scan business health. Review scale, efficiency, quality, and trend against target and prior year.
- Run focused deep dives. Select only gaps that can change the conclusion. Use variance bridges, segment profitability, funnels, bottlenecks, or scenarios.
- Form conclusions and recommendations. Connect evidence to cause, action, owner, timing, expected result, and risk.
- Write and present. Put the conclusion in the title, keep one management point per page, and add source notes.
- Track and iterate. Turn approved actions into a monthly review cadence with leading indicators.
This sequence stops teams from building attractive charts before agreeing on the question. The balanced scorecard in step 2 is worth taking literally: Kaplan and Norton's original Harvard Business Review article argued that financial results alone describe the past, and that customer, internal process, and learning measures are what explain and predict them. An annual review that shows only the income statement has the same blind spot.
Prepare the source files before asking AI to design slides
Create a source register with file name, owner, period, and cut-off date.
| Source | Prepare | Validate |
|---|---|---|
| Excel workbook | One header row, explicit units, stable dates | Recalculate formulas and reconcile annual totals to monthly rows |
| Financial report | Mark statements, MD&A, notes, and non-GAAP reconciliations | Confirm scope, currency, accounting basis, and footnote definitions |
| Department KPI pack | Add owner, formula, target, actual, frequency, and status rule | Confirm denominators and use one definition across departments |
Microsoft recommends building charts in Excel for large or frequently changing data sets, and PivotTables and PivotCharts help refresh structured data. See Microsoft guidance on charts in PowerPoint and its PivotTable and PivotChart overview. If you only need to carry a finished worksheet into a slide, our guide to inserting Excel into PowerPoint compares linking, embedding, and pasting.
For public-company reports, the U.S. Securities and Exchange Commission explains that MD&A gives management's perspective on results, liquidity, capital resources, and known trends or uncertainties, while the audited statements and notes remain the source of record. See the SEC guide to reading a 10-K.
Connect enterprise outcomes to department drivers
The hardest part of an annual review is joining the finance view to the operating view. The finance pack says revenue grew 11% and margin missed plan; the department packs say on-time delivery slipped and two critical roles stayed open. Neither tells the audience whether those facts are related.
A driver tree makes the link explicit. Put the enterprise outcome at the top (revenue, EBITDA margin, free cash flow), split each into its arithmetic components (volume × price, gross margin − operating cost, operating profit − working capital − capex − tax), and attach the department KPI that moves each component. On-time delivery, for example, may drive churn and expedited freight cost; open engineering roles may delay a product launch and therefore volume.
Build the tree in a spreadsheet or on paper before you open any slide tool. It decides which deep dives the deck needs, and it gives the AI a structure to follow instead of letting it guess a storyline from whatever files were uploaded.
How to build an AI annual business review PowerPoint in Tosea AI
Step 1: State the management question
Specify the audience and decision. A useful request might ask for a 12-slide executive review covering growth, margin, cash conversion, department performance, and next-year decisions.
Step 2: Upload the source material
Upload relevant Excel exports, CSV files, PDFs, reports, and existing slides. Do not mix preliminary and final versions without marking them.
Step 3: Review the outline
Test the story before rendering. A practical flow is enterprise result, financial drivers, customer performance, operating constraints, people capacity, risks, and actions. Remove pages that repeat tables without supporting a decision.
Step 4: Build editable charts in Data Studio
Tosea AI Data Studio can recognize data in existing charts, import an Excel or CSV file, and turn the data into editable tables and charts such as column, stacked, line, pie, and scatter charts. Open it with Edit data in the outline stage or Data above a rendered slide, then click Update slide. See the Tosea AI Data Studio guide, and our walkthrough of editable consulting-style charts with Data Studio.
Step 5: Match visual to question
Use lines for trends, columns for categories, waterfalls for bridges, heatmaps for many KPIs, and scatter plots for relationships. Avoid pie charts when readers must compare many small differences. In HTML mode, the layout menu also offers consulting charts such as bullet charts for KPIs against target and dumbbell charts for plan versus actual; see the layout and diagrams guide.
Step 6: Reconcile the analysis
Monthly values must add to annual totals. Waterfalls must start and end at stated values. Ratios need denominators. Calculate annual margin from annual profit and revenue, not the final month.
Step 7: Apply a template and Beautify
Choose a business template or eligible custom template. For decks that already exist, Beautify PPT/PDF (Pro and above) keeps the source page count, order, text, numbers, screenshots, and photos by default while redesigning the layout. See how to beautify an existing PPT or PDF. Review every page afterward.
Step 8: Export and test
Export an editable PPTX when the team needs to revise charts and text. Open it on the presentation computer and check fonts, objects, and projection readability.
Scenario 1: Turn Excel into an annual operating dashboard
Excel is best for calculation, not for explaining a management conclusion. The slide below condenses a monthly workbook into four outcome cards, one trend, a budget bridge, and a segment diagnostic. The numbers are illustrative.
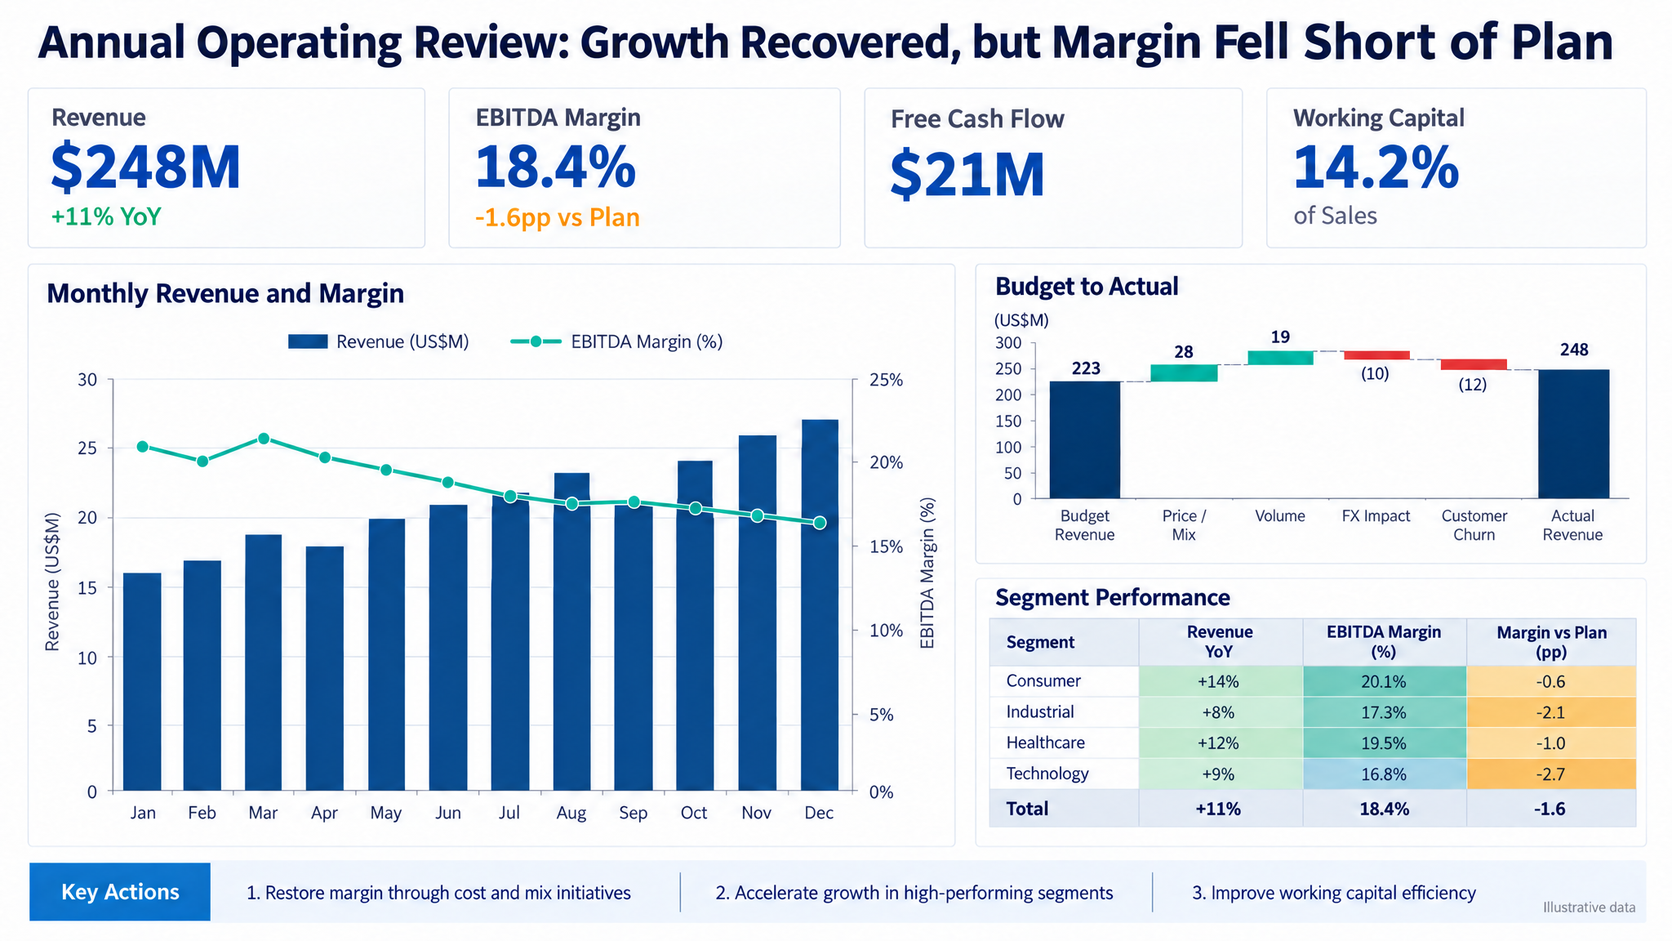
Original illustrative slide: an Excel-based annual operating review that connects growth, margin, cash, and segment performance.
What to check before presenting a page like this:
- The bridge closes. Budget revenue of 223, plus 28 from price and mix and 19 from volume, minus 10 from FX and 12 from churn, equals the 248 actual. A revenue bridge should contain revenue drivers only; cost of goods sold and operating expenses belong in a profit bridge, not between two revenue bars.
- The annual margin is not the December margin. The monthly line ends near 16% while the card reports 18.4%. That is correct only if 18.4% is full-year EBITDA divided by full-year revenue; say so in a footnote, because a reader looking at the trend will notice the difference.
- Percentage points and percent stay separate. Margin is "−1.6 pp vs plan," not "−1.6%." The segment table follows the same convention.
Reusable prompt for Excel data
Create a 16:9 annual operating review from the uploaded Excel workbook.
Audience: CEO, CFO, and business unit leaders.
Decision: explain full-year performance and identify next-year actions.
Show revenue, EBITDA margin, free cash flow, and working capital against plan and prior year. Add a monthly revenue and margin trend, a budget-to-actual waterfall, and a segment performance heatmap. Put the conclusion in the title. Reconcile monthly values to annual totals. Preserve units, periods, definitions, and sources. Flag missing or conflicting data instead of estimating it.
Scenario 2: Turn a financial report into a profit-to-cash story
A financial report contains more detail than one presentation can carry. Start with the statements and notes, then use management commentary to explain the drivers. The slide below separates the three-year summary from the profit-to-cash bridge, so the audience can see why earnings growth did not translate fully into free cash flow.
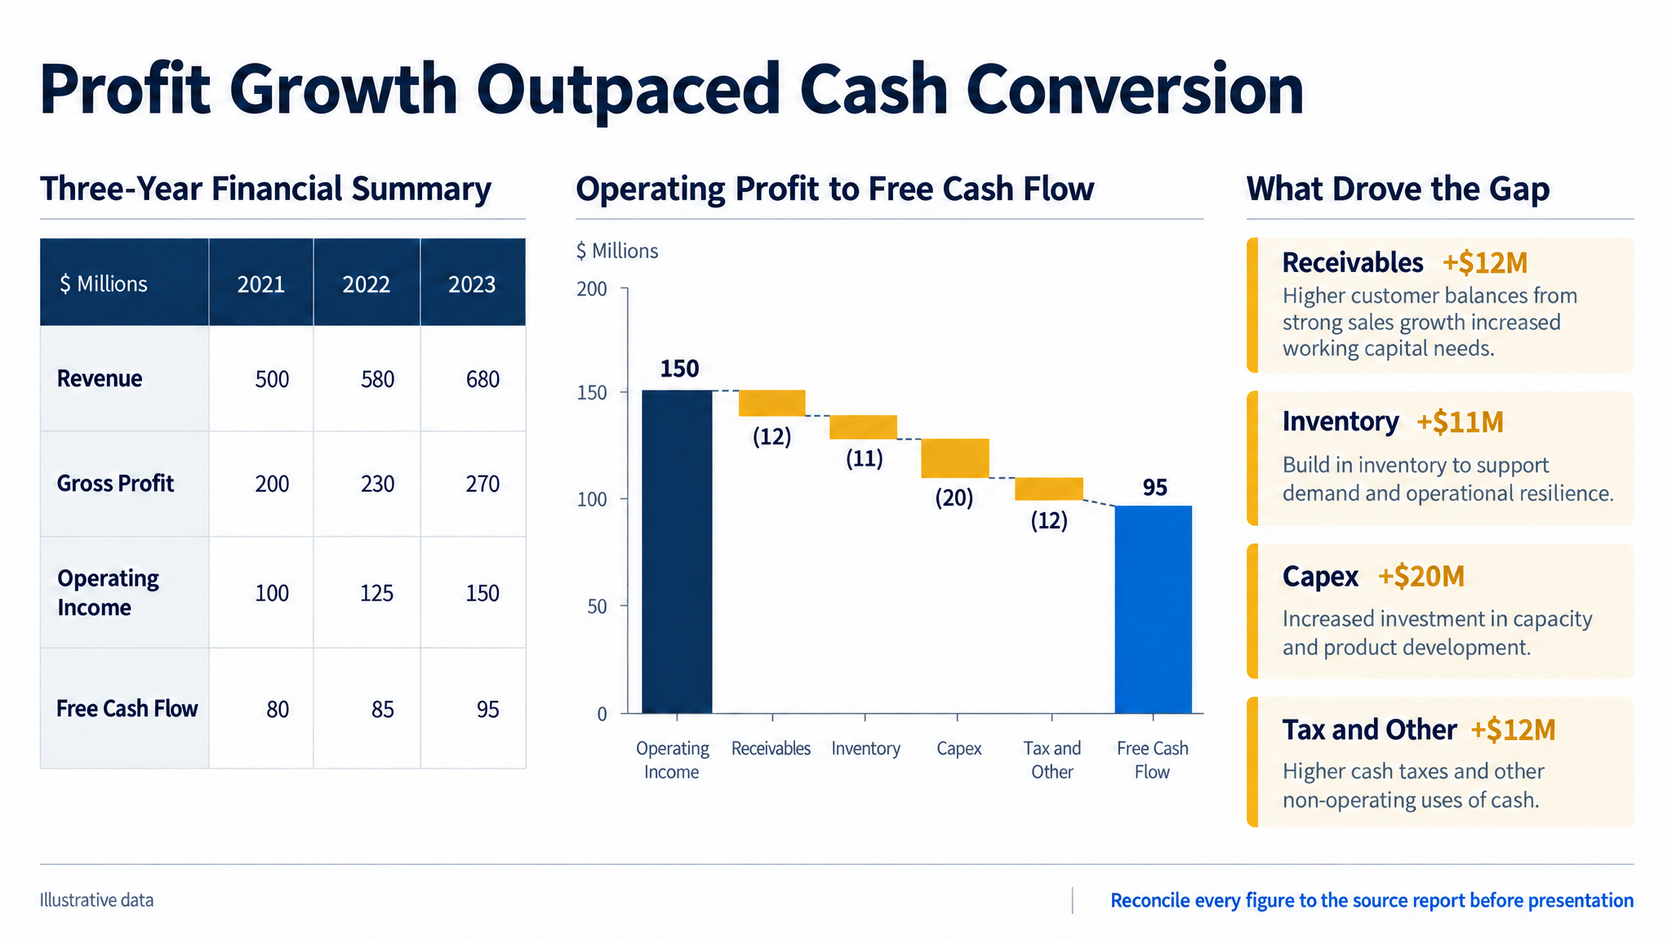
Original illustrative slide: a financial report analysis that reconciles operating profit to free cash flow.
What the numbers say: operating income rose from 100 to 150 over three years (+50%), while free cash flow rose from 80 to 95 (+19%). Cash conversion, measured as free cash flow divided by operating income, fell from 80% to 68% to about 63%. The bridge explains the 55-point gap in the latest year: 150 − 12 − 11 − 20 − 12 = 95. The headline "Profit Growth Outpaced Cash Conversion" is therefore a claim the audience can check from the slide itself.
In a real deck, label whether these are GAAP or non-GAAP measures, cite the cash flow statement lines behind each bridge step, and keep the reconciliation in the appendix.
Reusable prompt for a financial report
Create one executive analysis slide from the uploaded annual financial report.
Use the audited statements and notes as the source of record. Show a three-year table for revenue, gross profit, operating income, and free cash flow. Add a waterfall from operating income to free cash flow, separating receivables, inventory, capital expenditure, tax, and other items. Explain material changes using the management discussion, but do not invent causes. Label currency, period, accounting basis, and source pages. Flag non-GAAP measures and preserve the reconciliation.
Scenario 3: Turn department KPIs into an accountability page
Department KPI reporting becomes useful when every metric has a target, actual, variance, status rule, and owner. The page below compares four functions and ends with the one recovery action that needs executive attention.
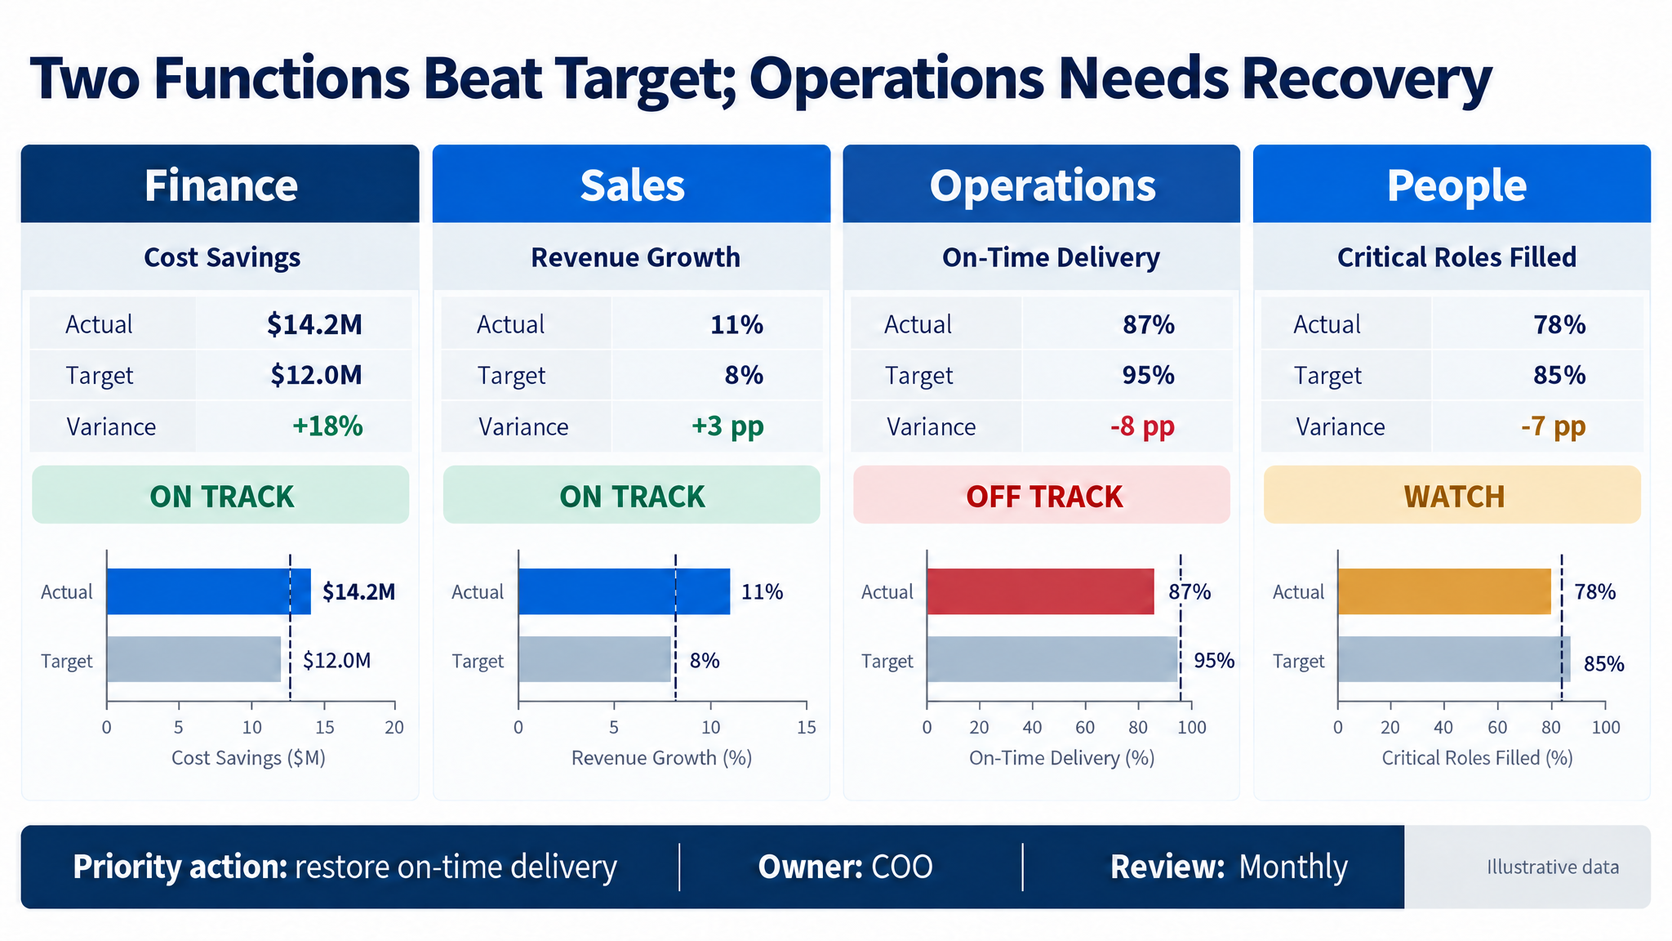
Original illustrative slide: a cross-functional KPI scorecard with target comparisons and an owned action.
What to check: Finance and Sales beat target; Operations missed by 8 percentage points and People by 7. The title should say exactly that, which is why it reads "Two Functions Beat Target." Finance reports a relative variance (+18% on a dollar target) while the other three report percentage-point gaps on rates; both are correct, but the difference should be visible. Finally, the status rule must be written down: if −7 pp is "Watch" and −8 pp is "Off track," state the threshold in a footnote so next year's scorecard uses the same rule.
Reusable prompt for department KPIs
Create a 16:9 department KPI scorecard from the uploaded files.
Audience: executive committee and department heads.
Compare Finance, Sales, Operations, and People using one primary KPI per function. For each KPI, show actual, target, variance, status, owner, and reporting period. Use target-versus-actual bullet charts and consistent status rules. Put the largest management gap in the title. End with one priority action, one accountable owner, and the next review date. Do not compare KPIs that use different definitions or periods.
How we checked the example slides
The three example slides were generated with an image model and then audited line by line before publication, because a tutorial about reconciliation should not contain charts that fail it. The first drafts had three problems that are common in AI-generated business charts:
- The profit-to-cash waterfall listed deductions that summed to 40 while the bars and the end value implied 55.
- The scorecard title said three functions beat target when only two did.
- The revenue bridge used cost of goods sold and operating expenses as steps between two revenue totals.
Each was corrected in the image and recalculated afterward. The lesson carries over to your own deck: AI layout and chart rendering are fast, but every label, total, and title claim still needs a human check against the source.
A practical annual review deck structure
Keep the core deck to 10 pages. Put KPI definitions, source notes, and detailed tables in the appendix.
| # | Page | Title should answer | Typical visual |
|---|---|---|---|
| 1 | Executive summary | What was the year, in one sentence? | Three to five numbered findings |
| 2 | Enterprise scorecard | Where did we land against plan and prior year? | KPI cards with comparison basis |
| 3 | Revenue drivers | What moved revenue? | Price–volume–mix bridge |
| 4 | Profitability | Why did margin change? | Margin bridge or segment table |
| 5 | Cash and working capital | Did profit turn into cash? | Profit-to-cash waterfall |
| 6 | Customer performance | Which customers or segments grew or churned? | Cohort or segment chart |
| 7 | Operations | Which constraint limited delivery or cost? | Trend with threshold line |
| 8 | People capacity | Do we have the people the plan needs? | Bullet chart against target |
| 9 | Risks | What could change next year's result? | Risk register with owners |
| 10 | Next-year actions | What do we commit to, and who owns it? | Action table with dates |
For the executive summary page specifically, our executive summary slide guide covers how to write findings that stand on their own.
Common failure modes in annual review decks
- Averaging monthly ratios. A simple average of twelve monthly margins is not the annual margin when revenue varies by month.
- Mixing bridges. Revenue, profit, and cash bridges each have their own legitimate steps. Mixing them produces totals that cannot reconcile.
- Changing definitions mid-year. If a KPI formula changed in Q3, show the restated series or mark the break; do not chart it as one line.
- Status colors without rules. Red, amber, and green mean nothing unless the threshold is stated and applied the same way to every function.
- Titles that describe instead of conclude. "Revenue by Segment" is a label; "Consumer and Healthcare Drove Growth While Technology Lagged" is a finding.
- Actions without owners. A recommendation with no owner and no review date will reappear unchanged in next year's deck.
Quality-control checklist
- Confirm audience, period, decision, and comparison basis.
- Give every KPI a definition, unit, owner, and target.
- Reconcile monthly, segment, and department totals.
- Distinguish percent change from percentage-point change.
- Keep actual, budget, forecast, and prior year notation consistent.
- Add file names, source pages, and the data cut-off date.
- Review regulated or confidential content with its owner.
- Test the exported PPTX in the delivery environment.
A six-week annual review timeline
Annual reviews usually fail on time, not on design. A workable schedule for a mid-sized company looks like this:
- Six weeks before: agree scope, audience, comparison basis, and the driver tree; send the source register to file owners.
- Four weeks before: receive preliminary data; run reconciliations; list the gaps that need deep dives.
- Three weeks before: draft the outline in Tosea AI and review the storyline with the CFO before any slides are rendered.
- Two weeks before: render the deck, import final numbers through Data Studio, and send function pages to their owners for factual review.
- One week before: lock the numbers at the final cut-off date, rerun every reconciliation, export the PPTX, and rehearse on the presentation computer.
- After the meeting: convert approved actions into the monthly review pack, such as a weekly or monthly pulse report, so progress is tracked before next year's review.
Frequently asked questions
Can AI create an annual business review PowerPoint directly from Excel?
Yes. Clean the headers, periods, units, and KPI definitions first. Import Excel or CSV into Tosea AI Data Studio, choose the chart types, and verify totals and ratios before updating the slide.
How should I combine financial reports and department KPIs?
Use the financial report for enterprise outcomes and department KPIs for operating causes. Connect them through a driver tree linking revenue, margin, and cash to pipeline, price, productivity, quality, delivery, and staffing.
Can Tosea AI redesign my existing PowerPoint without changing the content?
Yes. Upload the PPTX or a PDF with Beautify PPT/PDF (available on Pro and above) and keep the default "Keep source pages" option, which preserves page count, order, and content while redesigning the layout. Use Layout Only for later visual changes, then verify every label, footnote, and slide element.
How do I upload a PowerPoint and ask Tosea AI to redesign each slide?
Upload the file with Beautify, keep the source pages, and choose a template. Generate, compare each page with the source, correct exceptions, and export.
Can I upload my own PowerPoint template to Tosea AI?
Eligible paid plans support custom templates, uploaded through the Image mode template picker. Verify required layouts, fonts, colors, logo placement, and master-slide rules before sharing the deck.
Can Tosea AI use custom brand colors, fonts, and a logo?
Yes. Specify colors and fonts, upload the logo, or use an eligible custom template. After export, check font availability, color values, logo clear space, and contrast.
Can Tosea AI match the style of my old company presentations?
A representative deck can guide the design, but this is not permanent model training. Use an approved current template and compare the output with formal brand guidelines.
Does Tosea AI preserve PowerPoint formatting after export?
Editable PPTX export is designed to stay close to the preview. Fonts, complex graphics, and presentation software can affect results, so test the final delivery environment.
Can I tell AI to edit the layout only and keep the exact wording?
Yes. Layout Only changes visual structure without intentionally rewriting content. Compare the result with the source and verify labels, citations, footnotes, formulas, statistics, and line breaks.
Build the annual review around decisions, not available data
An AI annual business review PowerPoint is reliable when the logic and data controls come before the design. Define the decision, validate the sources, scan overall performance, investigate the material gaps, and turn the conclusions into owned actions. Tosea AI can then help convert Excel, financial reports, and KPI packs into an editable outline, editable charts, refined layouts, and an editable PPTX.
Start with Tosea AI. For related reporting workflows, read How to Build a Business Dashboard PowerPoint with AI, How to Build a Quarterly Business Review Deck, and How to Present Sales Data to Executives.
Sources
- The Balanced Scorecard—Measures That Drive Performance — Robert S. Kaplan and David P. Norton, Harvard Business Review, January–February 1992
- How to Read a 10-K — U.S. Securities and Exchange Commission
- Use charts and graphs in your presentation — Microsoft Support
- Overview of PivotTables and PivotCharts — Microsoft Support
- Data Studio and Beautify an existing PPT or PDF — Tosea AI Help Center
- Tosea AI product updates — Tosea AI