


Operations improvement prompt for PowerPoint
A prompt for a 10-slide operations review aimed at a COO, plant managers and supply chain leads. It works from production, quality, downtime and delivery files, ranks downtime causes, and ends with the first constraint to fix and a 90-day recovery plan.
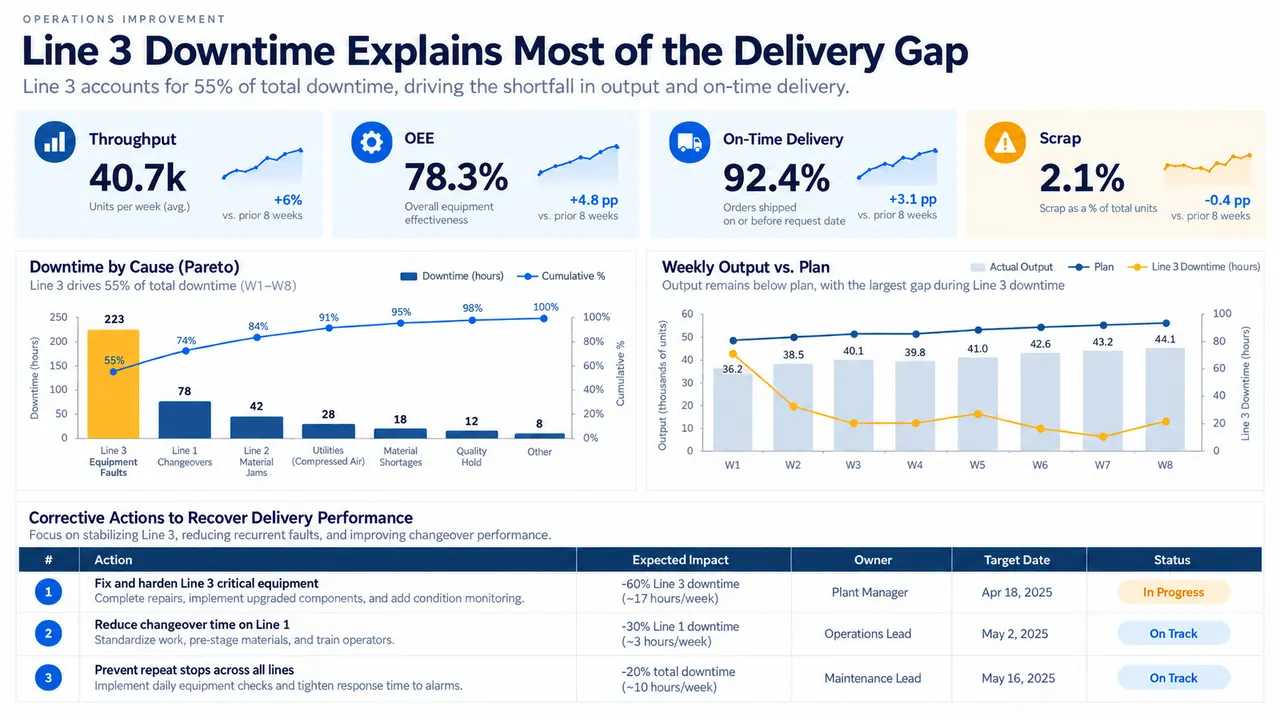
Operations improvement review prompt
Fill in any highlighted fields, then copy or run it.
Create a 10-slide operations review from production, quality, downtime, and delivery files.
Audience: COO, plant manager, and supply chain leads.
Decision: select the first constraint to fix and assign a 90-day recovery plan.
Show throughput, OEE, delivery, scrap, downtime causes, capacity, and supplier issues.
Use a Pareto chart, trend, root-cause view, and action tracker.
Do not claim causality without evidence. Flag inconsistent definitions.
Why this prompt works
One constraint, not ten
"Select the first constraint to fix" pushes the deck toward the single bottleneck that limits output, rather than a long list of improvement ideas.
A Pareto ranks the causes
A Pareto chart sorts downtime causes by hours with a cumulative line, so the audience sees which few causes account for most of the lost time.
No causality without evidence
"Do not claim causality without evidence" keeps the root-cause view honest when the data only shows that two things happened in the same weeks.
Definitions are checked
"Flag inconsistent definitions" catches plant data where OEE or on-time delivery is measured differently across lines or sites.
Adapt it to your own deck
Match your metrics
Swap in the KPIs you track. A warehouse might write "Show order cycle time, pick accuracy, dock-to-stock time and labor productivity" in place of OEE and scrap.
Change the recovery window
Ninety days suits a plant issue. For a supplier problem with long lead times, ask for "a 6-month plan with monthly checkpoints and named owners."
Present to the shop floor
For a team huddle, set "Audience: line supervisors" and cut to 3 slides: the Pareto, the weekly trend and the action tracker with owners and dates.
Operations improvement review FAQ
What does an operations improvement presentation cover?
It reviews throughput, quality, delivery and downtime, identifies the constraint that limits performance, and assigns corrective actions with owners and dates. The goal is a decision on what to fix first and who is accountable.
What is OEE?
Overall equipment effectiveness measures how much planned production time is truly productive. It multiplies availability, performance and quality, so an OEE of 78% means about a fifth of planned time was lost to stops, slow running or defects.
Can I paste this into ChatGPT, Claude or Gemini?
Yes. You will get an outline, chart suggestions and slide text to build yourself. In Tosea you attach your production report with the prompt, choose a template, and get slides you can edit and export to PowerPoint (.pptx).
Figures on the example slides are illustrative.
Prefer not to write a prompt?
Upload the document. Tosea drafts the deck, you edit and export.
Start for free