


Wall method scorecard prompts for PowerPoint
Five prompts that build a Wall method financial health scorecard for finance teams, credit analysts and investment reviewers: a total score out of 100, the weight model behind it, ratios against benchmarks, an audit-ready calculation table and a sensitivity check.
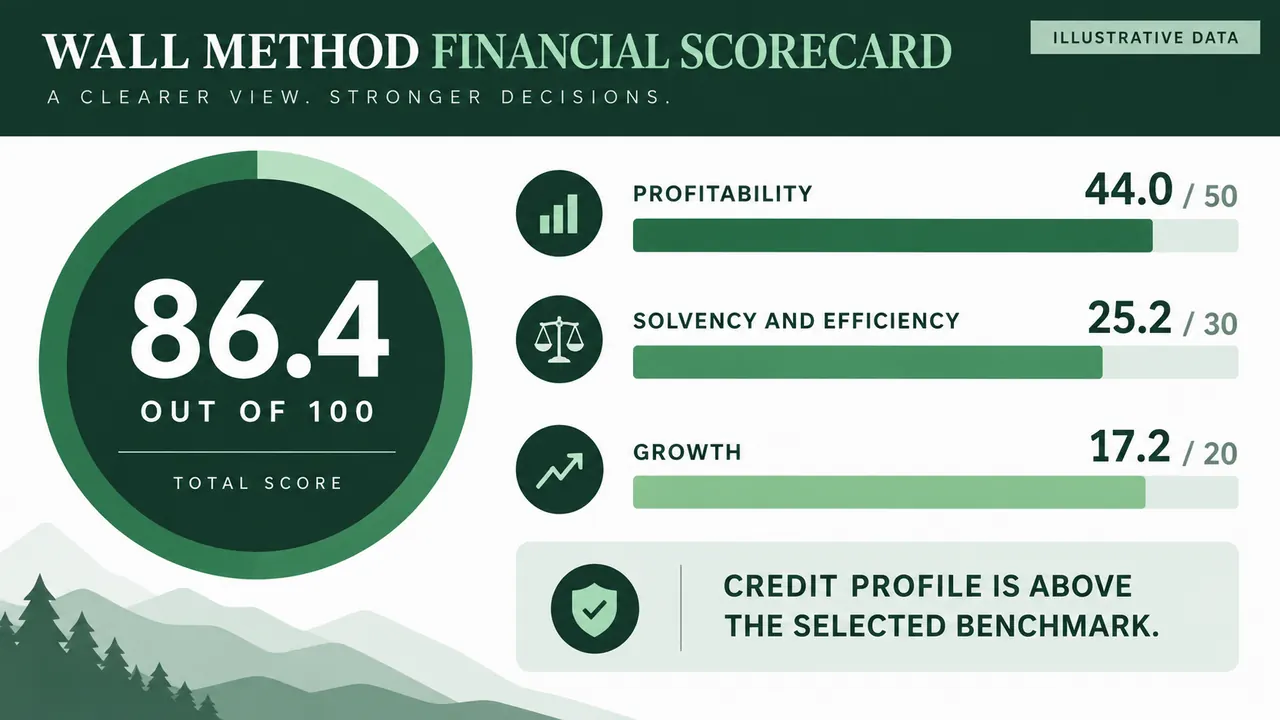
Wall method prompt
Pick a slide, fill in any highlighted fields, then copy or run it.
Create a 16:9 executive Wall method scorecard in forest green, mint, white, and charcoal. Lead with a decision title. Show the total out of 100 and category contributions of 50, 30, and 20. Add benchmark source, reporting period, and Illustrative Data. Use no logos.
Design a 16:9 methodology slide. Divide 100 points across profitability 50, solvency and efficiency 30, and growth 20. List metrics and weights in three aligned cards. Mark the weights as illustrative. Use restrained green bands, whitespace, and editable labels.
Build a 16:9 dumbbell chart for six ratios. Show actual and benchmark values with units. Use dark green for favorable results and amber for gaps. Add two short implications plus benchmark source and period. Use no brand marks.
Create a 16:9 audit-friendly calculation table with metric, actual, benchmark, direction, weight, raw score, and capped score. Add the formula and flag reverse-direction metrics. Use pale rows, a dark green header, one amber caveat, and complete sources.
Create a 16:9 sensitivity slide comparing raw and capped totals. Show reverse-direction logic, outlier dominance, and mismatched benchmarks. Chart base, stress, and alternative peer cases. Use green, amber, and muted red. End with two governance actions.
Why these prompts work
The title states the verdict
The scorecard prompt asks for a decision title, the dumbbell prompt for two short implications, and the sensitivity prompt ends with two governance actions. Each slide says what the score means.
Every score can be recomputed
The table prompt asks for actual, benchmark, direction, weight, raw score and capped score columns plus the formula, so a reviewer can check any row by hand.
Reverse metrics and outliers are flagged
Higher is not always better. The prompts flag reverse-direction metrics and chart outlier dominance, two common ways a Wall score gets inflated without anyone noticing.
Benchmarks carry a source and period
The scorecard, dumbbell and table prompts ask for the benchmark source and reporting period, and the weights are marked illustrative. A score is only as good as the peer set behind it.
Adapt it to your own deck
Score your own company
Attach the annual report or a ratio sheet and add: "Calculate each ratio from the attached statements for the latest fiscal year and cite the page. Remove the Illustrative Data label only when every figure is sourced."
Change the metrics and weights
The 50, 30, 20 split in the prompts is illustrative. A lender may weight solvency higher. Edit the numbers in both the scorecard and weight prompts so they still sum to 100, and drop inventory turnover if you hold no stock.
Fit your template and audience
Swap forest green and mint for your brand palette but keep amber for gaps. For a board, show the scorecard and sensitivity slides; for a credit committee, lead with the audit table.
Wall method FAQ
What is the Wall method in financial analysis?
The Wall method, also called the Wall scoring method, is named after Alexander Wall, an early 20th-century pioneer of credit ratio analysis. It combines several financial ratios into one weighted score, usually out of 100, by comparing each ratio with a benchmark.
How is a Wall method score calculated?
Divide each metric's actual value by its benchmark, inverting the ratio for metrics where lower is better. Multiply by the metric's weight and add the results. A common refinement caps each metric's score so one extreme ratio cannot dominate the total.
Are the numbers on the example slides real?
No. The prompts ask the model to label the data and weights as illustrative, and the example slides carry that label. Replace them with your own figures and a named benchmark before you share the deck.
Can I use these prompts in ChatGPT, Claude or Gemini instead of Tosea?
Yes. A chat assistant returns the slide text, an outline and possibly the calculations. Tosea takes the prompt plus an attached file, such as your financial statements, and turns them into slides you can edit and export to PowerPoint.
Figures on the example slides are illustrative.
Prefer not to write a prompt?
Upload the document. Tosea drafts the deck, you edit and export.
Start for free