Diagnostic AI Adoption: What 96 Stakeholder Barriers Show and How to Present Them
A new concept-mapping study maps 96 barriers to diagnostic AI adoption in 11 clusters. What it found, what it cannot show, and four hospital-ready slides with reusable AI prompts.
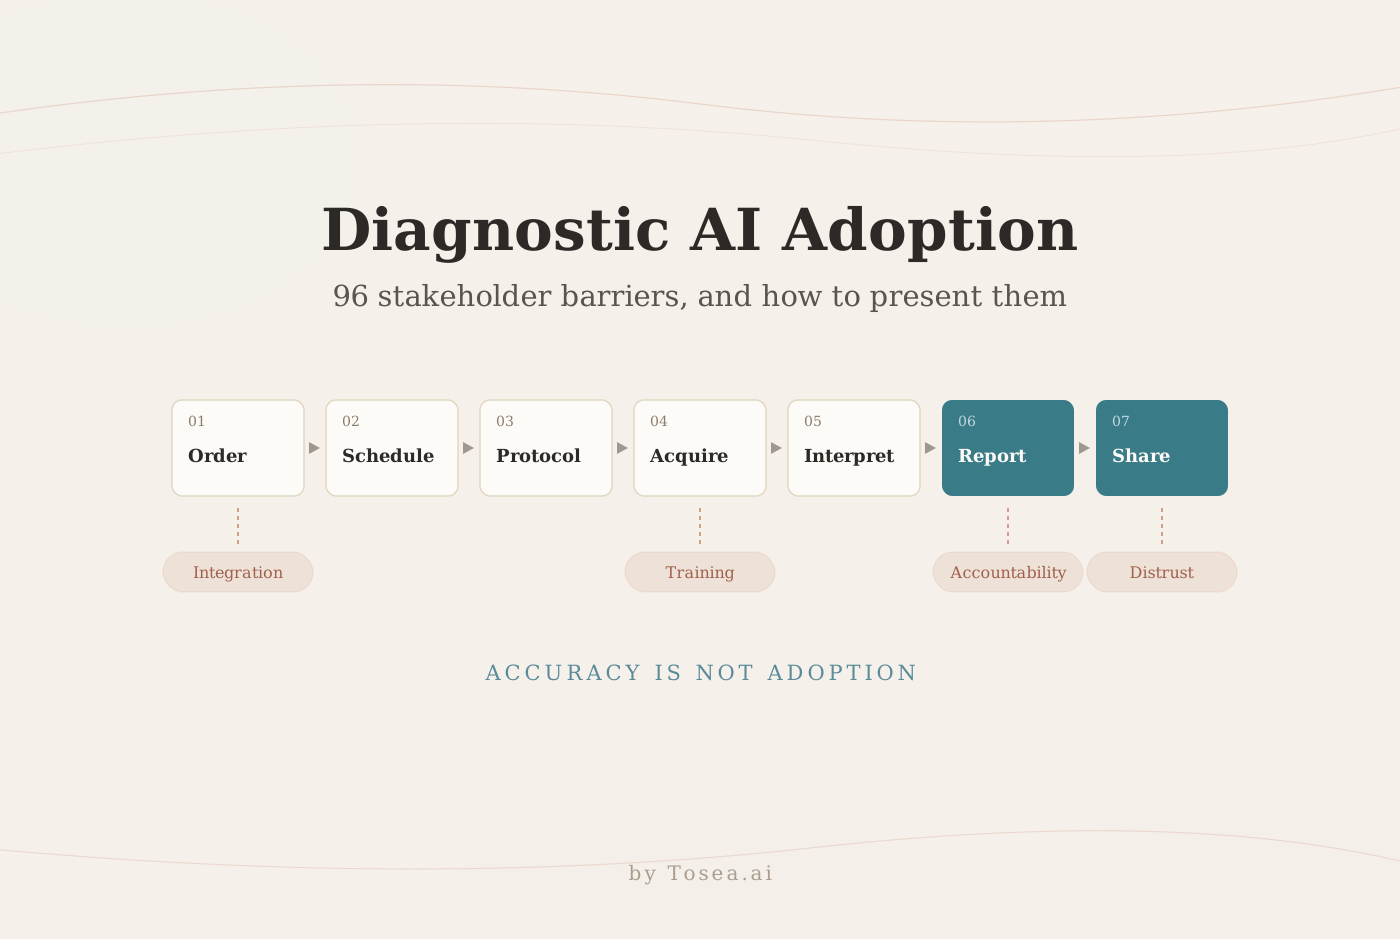
Diagnostic AI adoption can stall long after a team has seen an impressive accuracy score. A tool has to fit into a chain of people, systems, and decisions: someone orders a test, someone acquires it, and someone is responsible for what happens after the report. A preprint posted on November 2, 2026 maps 96 barriers described by stakeholders. It offers a practical starting point for a hospital implementation presentation: show where a tool could get stuck and what evidence would resolve the uncertainty.
This guide summarizes what the study did, what it found, what it cannot tell you, and how to turn it into four slides for a steering committee or implementation workshop.
What the researchers studied
Ali Fathi Jouzdani and colleagues used concept mapping to study barriers to AI diagnostic decision support in Implementation Science Driven Identification of Barriers to AI Diagnostic Decision Support (arXiv:2611.02554, medical physics). The team worked within a Knowledge-to-Action framework with an integrated knowledge translation approach, bringing people who develop and use AI into the process of identifying and interpreting problems. Stakeholders generated statements in response to a focus prompt, sorted related ideas into piles, and rated the resulting barriers on five dimensions.
The paper reports 36 participating stakeholders overall, with 14 contributing interviews, 12 completing sorting, and 10 completing ratings. The rating sample comprised five AI users (three physicians and two radiology technicians) and five AI developers. These are participation counts for different activities and should not be summed. The participants were selected for familiarity with AI underuse in clinical settings at BC Cancer, so the rankings reflect a small group working in similar project contexts. They are useful for asking better local questions, but cannot establish how common a barrier is across hospitals.
The study at a glance
| Item | What the paper reports |
|---|---|
| Design | Structured concept mapping within a Knowledge-to-Action framework |
| Workflow model | Seven-step diagnostic chain (Kapoor et al.): ordering, scheduling, protocoling, acquisition, interpretation, report generation, report communication |
| Participants | 36 stakeholders; 14 interviews, 12 sorting, 10 rating |
| Raters | 5 AI users and 5 AI developers |
| Output | 96 statements organized into 11 clusters |
| Rating dimensions | Reasons to Use, Means to Use, Method to Use, Desire to Use, Importance |
| Analysis | Non-metric multidimensional scaling, hierarchical clustering, pattern match graphs, Go-Zone plots |
| Materials | Questionnaire, statements, Go-Zone plots, and code on GitHub |
The 11 barrier clusters
| Cluster | What it covers |
|---|---|
| Infrastructure and integration barriers | Hardware, software, and interoperability gaps |
| Clinical skepticism and loss of human-centered decision-making | Concern that AI erodes the clinician's role |
| Insufficient adaptability to clinical complexity | Tools not flexible enough for real workflows and patients |
| Trust and accountability issues in AI-generated reporting | Reliability, traceability, and transparency of reports |
| Ethical, legal, financial, and privacy concerns | Data security, liability, and cost-benefit |
| Lack of training and familiarity with AI tools | Limited formal training and user experience |
| Workflow disruption and lack of standardization | No standard procedures for incorporating AI |
| Workforce resistance due to job security concerns | Fear of displacement or professional devaluation |
| Limitations of AI in handling complex or atypical cases | Rare, ambiguous, or high-variability situations |
| Clinical distrust and concerns over AI decision-making | Lack of confidence in AI clinical reasoning |
| Bias, reliability, and quality challenges in AI performance | Algorithmic bias and inconsistent outputs |
Listed in the order of Section III-D. The paper's results figures use separate cluster numbers, so the slides below refer to clusters by name.
Some barriers interact. A reporting tool may perform adequately in a test environment, yet staff still need a reliable way to review output, handle missing context, and communicate a correction. The preprint maps stakeholder perceptions; it does not measure patient outcomes or demonstrate that an intervention resolves these problems. It discusses digital twins as a forward-looking context without directly studying their implementation.
What the paper does not show
Before building slides, make the limits explicit. They decide which claims belong on a page.
- No outcome data. The study measures perceived barriers, not diagnostic accuracy, patient outcomes, or time savings.
- No prevalence estimate. Ten raters from one setting cannot tell you how common a barrier is elsewhere.
- No tested intervention. The paper proposes using results to guide intervention selection, but it does not evaluate one.
- Relative, not absolute, priority. Go-Zone quadrants divide ratings at group means. A barrier "above average" is above this group's average, not above a fixed threshold.
The four original presentation examples below show how to use the evidence in a planning discussion within those limits. They are editorial illustrations rather than screenshots from Tosea AI. Use each prompt with the source paper and approved local documentation.
1. Show where the tool enters the diagnostic chain
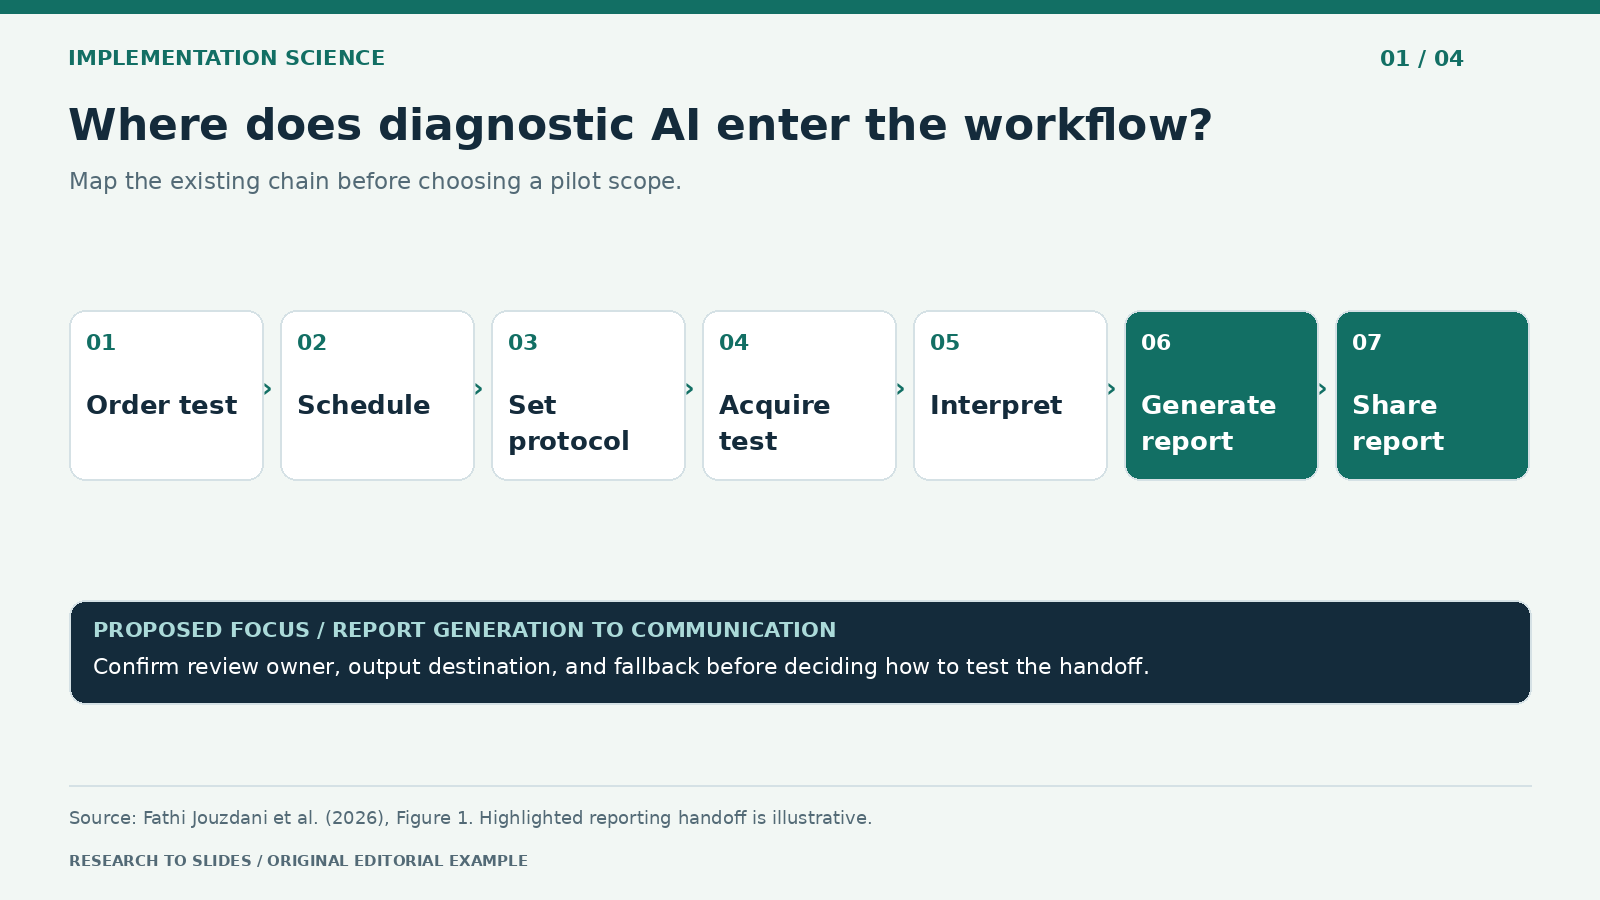
Figure 1. Seven workflow stages from the preprint, with an illustrative reporting handoff.
A steering committee needs to see what changes on a typical workday. Start by mapping the existing workflow, from ordering and scheduling through protocoling, acquisition, interpretation, report generation, and communication. Mark the one step where the proposed tool acts, and trace the handoff to the next team. A pilot that only measures time spent drafting may miss additional review or rework later in the chain.
For a reporting proposal, describe the output, where it appears, who reviews it, and what happens if it is unavailable. Put those decisions on the page instead of burying them in notes. Label any missing owner or workflow detail as a question for the local team. The diagram should help the audience choose what to investigate next.
Create one 16:9 slide for a diagnostic service steering committee. Draw the seven-stage chain from Figure 1 of the uploaded preprint. Highlight report generation and the handoff to communication as an illustrative pilot scope. Add fields for review owner, output destination, and fallback. Use only approved local inputs or mark them to confirm. Cite the preprint and do not claim measured time savings or improved diagnosis.
2. Put users and developers on the same slide
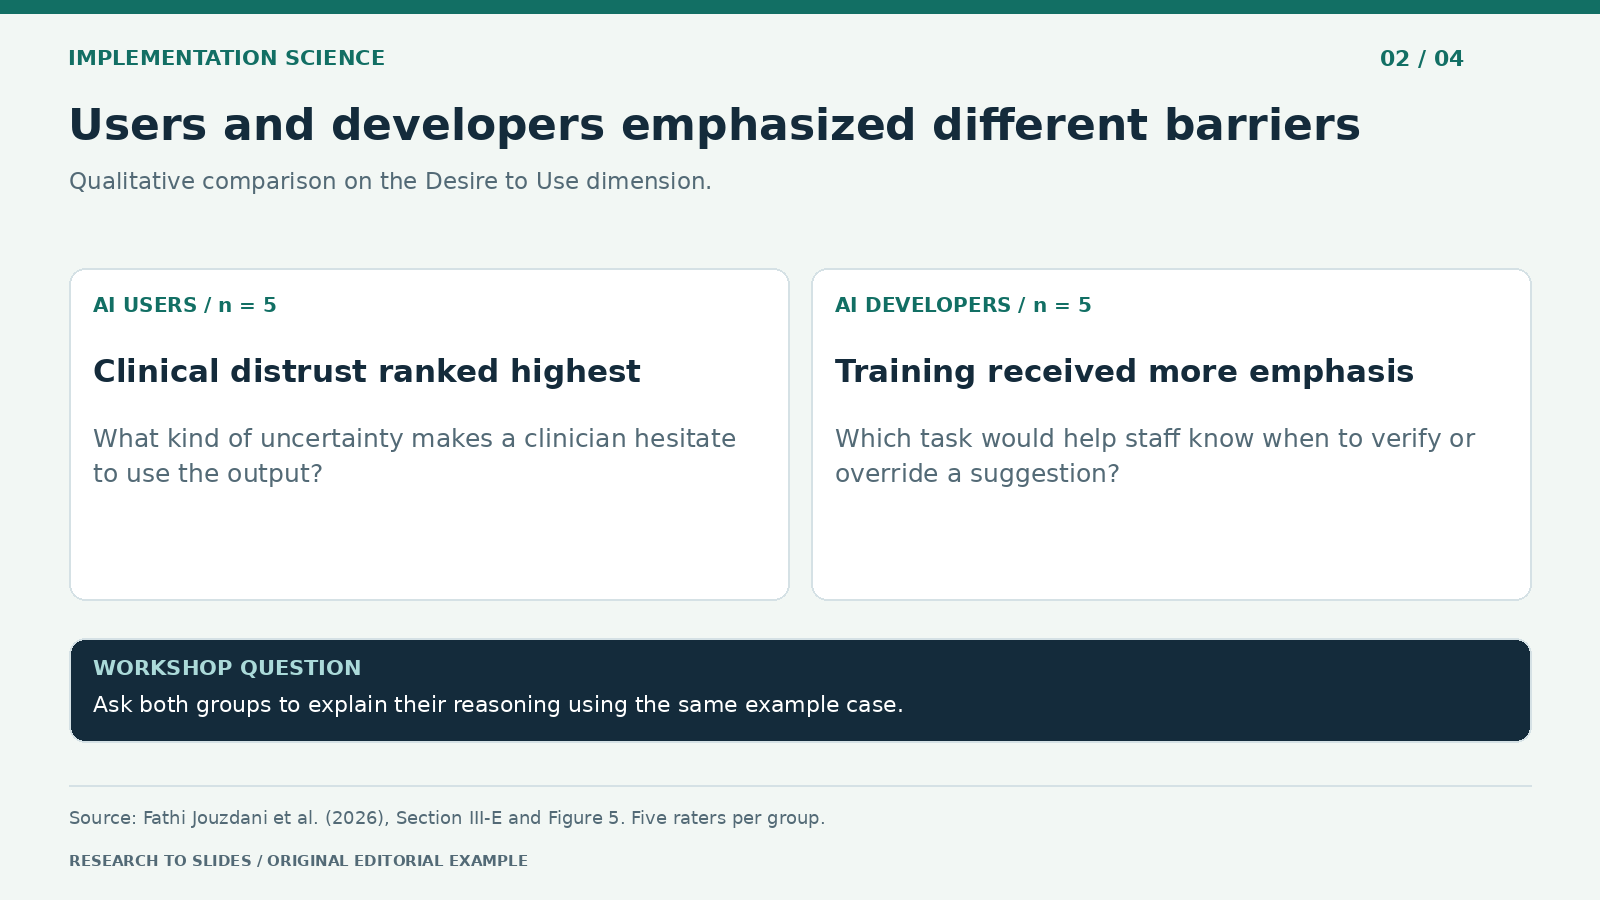
Figure 2. Qualitative comparison from the Desire to Use dimension in Section III-E; each group had five raters.
The same barrier list can lead to different conversations. On Desire to Use, AI users ranked clinical distrust and concerns about AI decision-making highest, while developers placed it substantially lower and gave more weight to lack of training and familiarity. Users also rated infrastructure and integration higher, whereas developers gave more weight to trust and accountability in AI-generated reporting. On Importance, users ranked insufficient adaptability to clinical complexity among the most important barriers; developers placed it lower.
Neither result makes a stakeholder group the final authority on what to fix. The comparison reveals where teams may be assuming different reasons for hesitation. Use the meeting to ask for concrete examples. What kind of uncertainty would make a clinician hesitate to rely on the output? Which training task would help a staff member recognize when to check or override it? A shared test case can help teams distinguish unfamiliarity with a tool from a concern the tool design has not addressed.
Design a two-column stakeholder slide for a joint clinical and development workshop. Use Section III-E and Figure 5 to summarize the qualitative contrast under Desire to Use only. Show five raters per group. Use barrier names instead of cluster numbers, omit unverified scores, and add one follow-up question per group. Label workshop questions as proposed, not findings.
3. Find shared priorities without inventing consensus
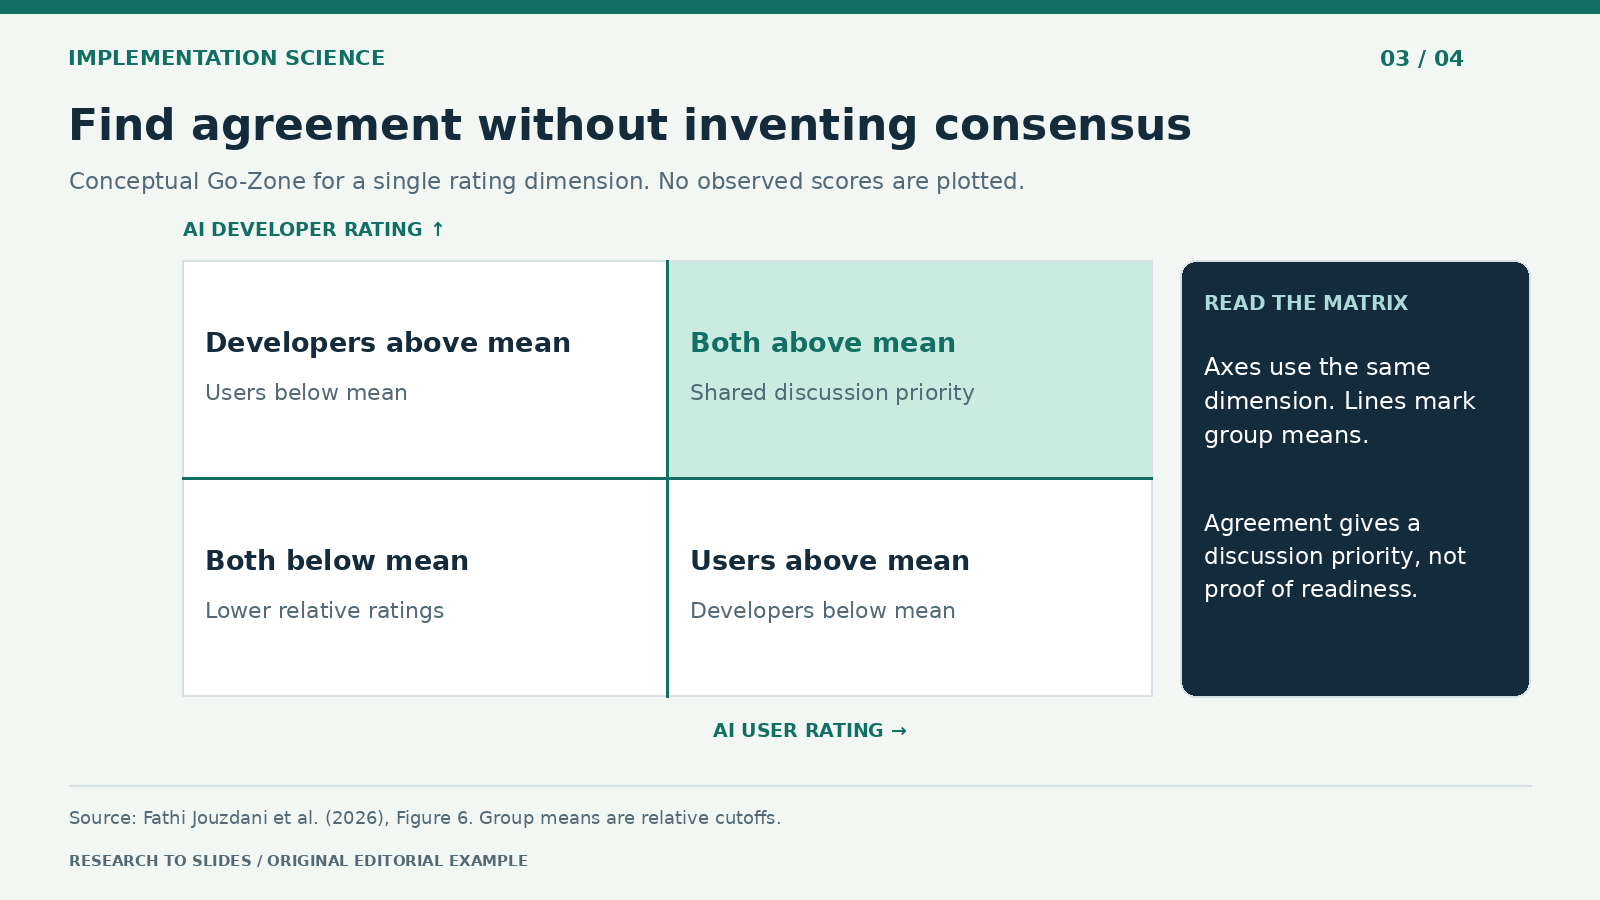
Figure 3. Diagram adapted from the logic of Figure 6. There are no measured coordinates or plotted barriers.
The Go-Zone can help a workshop decide which barriers deserve a joint discussion. In Figure 6 of the paper, each point is a statement positioned by its mean rating from AI users (x-axis) and its mean rating from AI developers (y-axis) for a given dimension, with one plot per cluster. The upper-right quadrant contains statements above both groups' means. The remaining quadrants show one-sided or lower relative ratings.
The paper's text also borrows the classic Go-Zone vocabulary of importance and feasibility. Because these axes compare two stakeholder groups on the same dimension, it is clearer on a slide to label quadrants by who rated the barrier above average, as the figure caption does. Start with one rating dimension and keep it consistent on both axes. If one group rates a barrier relatively highly and the other does not, invite each group to explain what it assumed about the local workflow. Above-average agreement is a signal for discussion, not proof that an intervention is ready.
Create a 2-by-2 Go-Zone explainer. Label the horizontal axis AI user rating and the vertical axis AI developer rating for the same selected dimension. Divide each axis at its group mean. Highlight the quadrant above both means. Use no points or fabricated values. Add one line explaining why agreement does not establish feasibility. Cite Figure 6.
4. Convert the research into a pilot decision
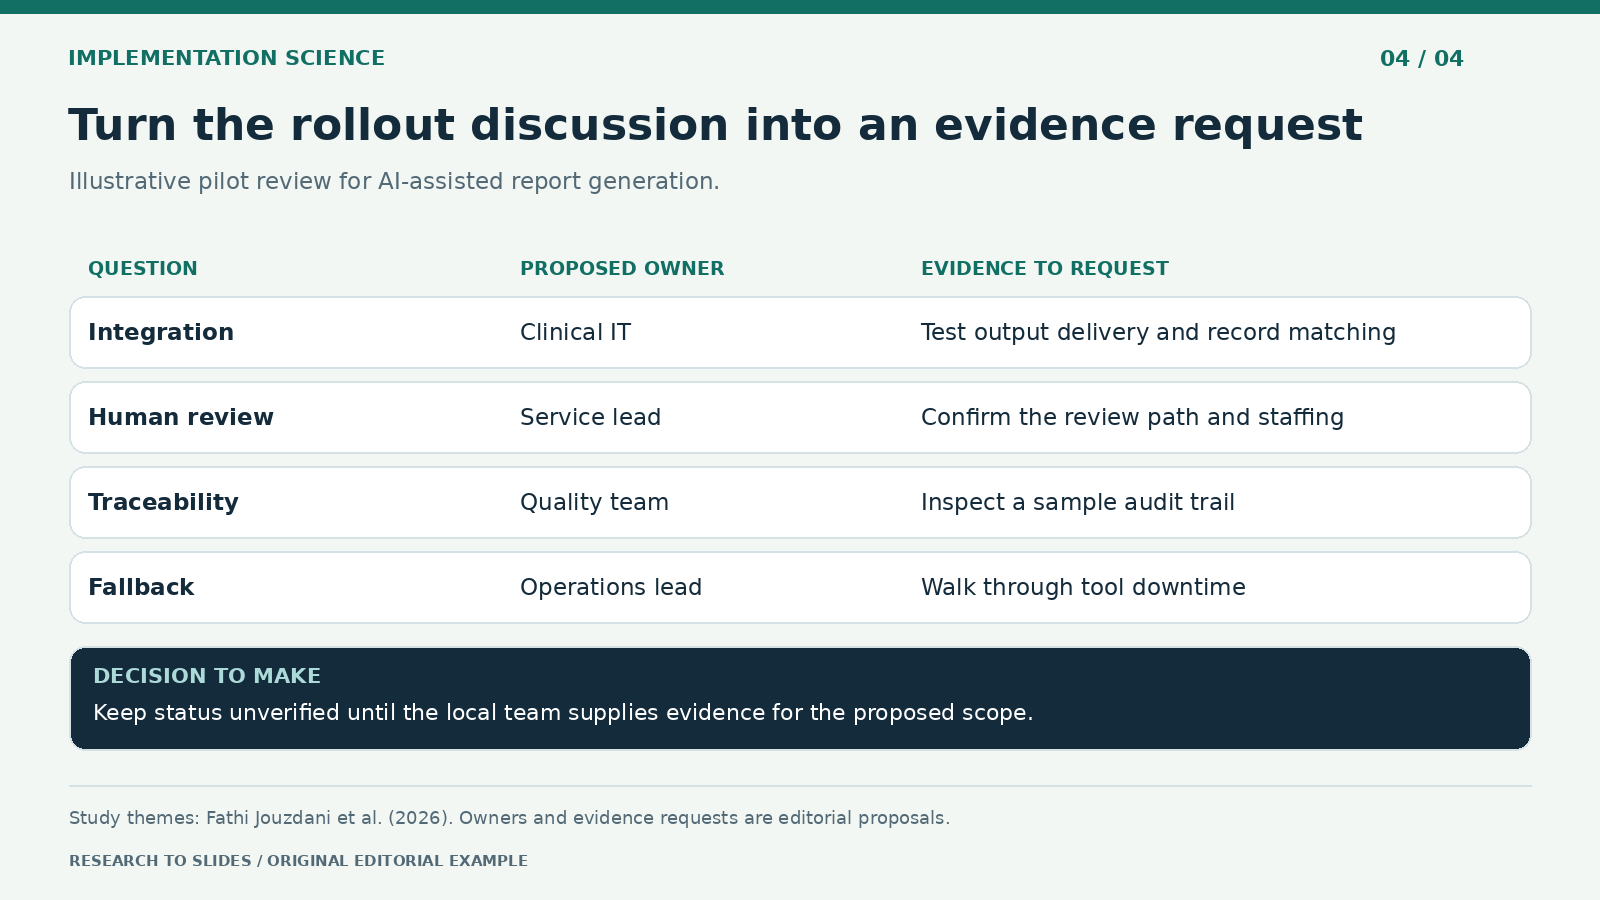
Figure 4. Proposed readiness questions inspired by the research, not a validated clinical checklist.
An implementation deck should finish with a bounded decision. Select one handoff, define what evidence the team needs, and assign someone to collect it. For a report-generation pilot, relevant questions could cover integration, review capacity, traceability, and a fallback when the tool is unavailable. Those four rows roughly correspond to the infrastructure, workflow, and reporting-accountability clusters. A quality team can then agree on local measures such as review time and correction burden and specify how they will be collected.
Distinguish an open question from a failed check. For example, mark review capacity as unverified until the service confirms who would review output under ordinary staffing. If the team has no local data, avoid coloring the row green. This makes the deck useful for deciding whether to keep investigating, revise the proposed scope, or proceed through the institution's review process.
Create a one-slide pilot review table for an illustrative report-generation workflow. Include integration, human review, traceability, and fallback. For each row show proposed owner role and evidence to request. Leave status unverified unless the supplied records support it. Separate source themes from proposed actions. Do not invent patient information, institutional approvals, validation thresholds, or clinical benefits.
Five mistakes to avoid when presenting this paper
- Calling the rankings representative. Ten raters in one setting generate hypotheses for your hospital, not a national priority list.
- Summing participant counts. 14, 12, and 10 are overlapping groups doing different tasks, not 36 separate people per task.
- Plotting invented Go-Zone points. The paper's plots are in Figure 6 and the supplement. Do not redraw them from memory; use the conceptual version or cite the original.
- Turning stakeholder perception into a performance claim. "Users distrust AI decision-making" is a finding about perception, not evidence that the tool reasons poorly.
- Treating the digital twin section as a result. It is positioned as future context and is not studied directly.
Tailor the same evidence to each audience
| Audience | Their question | Lead with | Keep visible |
|---|---|---|---|
| Steering committee | Where would a tool get stuck in our workflow? | The seven-step chain and one handoff | No outcome data in the study |
| Joint clinical and AI team | Why do we disagree about hesitation? | User versus developer contrast | Five raters per group |
| Quality and safety | What evidence do we need before a pilot? | Pilot review table | Checklist is editorial, not validated |
| Research seminar | How does concept mapping work? | Method, 11 clusters, Go-Zone logic | One setting, small rating sample |
For a related example of presenting governance research to decision-makers, see our guide to presenting AI risk disclosure findings from UK annual reports. For the general method of turning a paper into a talk, see the research paper to slides workflow.
Build and refine the deck in Tosea AI
Upload the public research PDF to Tosea AI and use one prompt per slide. For a local briefing, use materials approved for the platform and omit identifiable patient information. Ask the outline to separate research observations, unresolved local questions, and proposed actions, so the editorial checklist never reads as a study result.
In the outline, use the Layout and Diagram picker to match the visual to the argument: a process diagram for handoffs, split columns for stakeholder differences, a matrix for Go-Zone logic, and a table for pilot questions. After generation, change the layout or diagram on a rendered slide if the reading order or hierarchy needs work. For previously approved copy, use Layout Only and verify the text and sources before export.
Healthcare decks carry extra review obligations. Before circulating, check that every barrier name matches the paper, that participant counts carry their task labels, and that the pilot table is marked as a proposal. Export an editable PPTX so the clinical lead can adjust owner roles without rebuilding the slide. For more on keeping AI-generated slides faithful to the source, see our zero-hallucination AI slides guide.
Q&A
Does the preprint prove that diagnostic AI improves patient outcomes?
No. It describes stakeholder-perceived barriers and their relative ratings. It does not compare clinical outcomes, establish a universal priority order, or test a deployment intervention.
Why does the paper mention digital twins?
The authors position digital twins as a related, forward-looking context, because many digital twin systems are expected to rely on the same AI-driven prediction and data integration. The barriers may therefore matter for future digital twin deployments, but the study does not examine them directly.
Can Tosea AI redesign my existing PowerPoint without changing the content?
Yes. Upload the PPTX or a PDF with Beautify PPT/PDF (available on Pro and above) and keep the default "Keep source pages" option, which preserves the page count, order, and content while redesigning the layout. Use Layout Only for later visual changes. Compare the result with the original, including labels, footnotes, and slide elements.
How do I upload a PowerPoint and ask Tosea AI to redesign each slide?
Upload the PPTX or PDF with Beautify, keep the source pages, and choose a template or describe the desired look. Inspect each redesigned slide before exporting.
Can I upload my own PowerPoint template to Tosea AI?
Yes, custom template upload is available on eligible paid plans. The custom template guide describes the Image mode workflow. Check the required layouts, fonts, colors, logo placement, and any master-slide rules in the output.
Can Tosea AI use custom brand colors, fonts, and a logo?
Yes. Specify approved colors and fonts, then supply a logo or custom template where supported by your plan. Verify font availability, color values, logo clear space, and contrast in PowerPoint.
Can Tosea AI match the style of my old company presentations?
Use a representative deck as design guidance. This does not mean the model is permanently trained on your style. For repeatable results, use an approved template and check the new slides against the organization's brand guidelines.
Does Tosea AI preserve PowerPoint formatting after export?
Editable PPTX export is designed to stay close to the preview while leaving supported elements editable. Complex graphics, fonts, and the viewing application can affect fidelity. Open the export in the PowerPoint environment where it will be presented.
Can I tell AI to edit the layout only and keep the exact wording?
Yes. Select Layout Only when the wording is already approved. After the edit, verify the text, labels, citations, footnotes, and line breaks against the source.
Make the rollout question visible
Tosea AI can turn a dense paper and approved workflow notes into a reviewable presentation with layouts you can adjust before and after rendering. Start with one handoff, attach the evidence, and make the next decision clear. For more research-to-slides examples, see Tosea's analysis of AI classroom engagement research and the guide to presenting a game-theory model of academic hiring.
Sources
- Implementation Science Driven Identification of Barriers to AI Diagnostic Decision Support: A Stakeholder-Informed Concept Mapping Study — Ali Fathi Jouzdani et al., arXiv preprint, November 2, 2026
- Full paper PDF — arXiv (participants in Section III-A; clusters in Section III-D; pattern match in Section III-E and Figure 5; Go-Zone in Figure 6)
- Knowledge-to-Action-Approach supplementary materials and code — Mohammad R. Salmanpour, GitHub
- Workflow Applications of Artificial Intelligence in Radiology and an Overview of Available Tools — Kapoor, Lacson and Khorasani, Journal of the American College of Radiology, 2020
- Layout and diagrams and Beautify an existing PPT or PDF — Tosea AI Help Center