2026 Massachusetts Biopharma Snapshot: Complete Guide and AI Presentation Prompts
What the 2026 MassBio Industry Snapshot reports on venture capital, employment, NIH funding, clinical trials, and China — plus five slide use cases with reusable AI prompts.
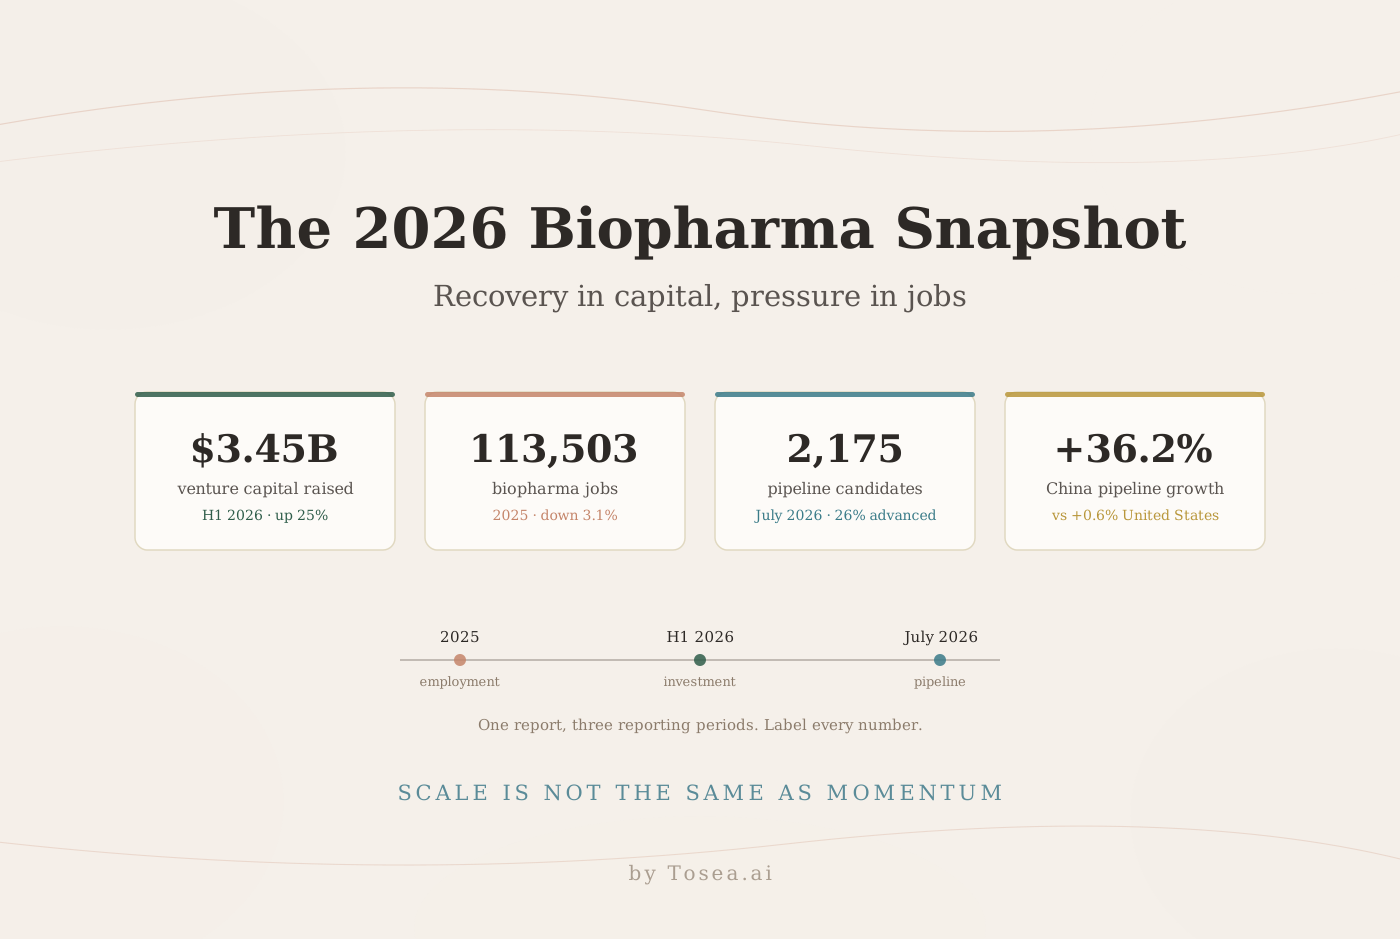
The 2026 Massachusetts Biopharma Industry Snapshot presents an industry that is recovering financially while still facing pressure in employment, federal research support, startup formation, laboratory demand, and international competition. Published by MassBio, the 41-page report combines workforce, venture capital, public-market, licensing, clinical-trial, drug-pipeline, and real-estate data. This guide explains the findings, identifies what decision-makers actually need to know, and provides reusable AI prompts for turning the report into a professional presentation.
Contents
- What the 2026 MassBio report says
- Data cautions that belong in every presentation
- Five slide use cases with reusable AI prompts
- The questions the report raises but does not answer
- Building the presentation with Tosea AI
- Frequently asked questions
What the 2026 MassBio Report Says
Massachusetts-headquartered biopharma companies raised $3.45 billion in venture capital during the first half of 2026, the largest first-half total since 2023 and an increase of 25 percent year over year. That figure represents 25.0 percent of all US biopharma venture funding, up from 22.5 percent a year earlier and trailing only California at 43.4 percent. Eight companies completed initial public offerings, as many as 2024 and 2025 combined, while 11 were acquired for a reported $18.0 billion.
The workforce moved in the opposite direction. Employment declined 3.1 percent in 2025, falling from 117,108 to 113,503 jobs — the first annual decline in the more than two decades MassBio has tracked this data. Total wages rose 2.2 percent to $26.45 billion. Research and development absorbed the losses, shedding 2,563 jobs for a 3.9 percent decline, while biomanufacturing added jobs for the first time in three years.
Massachusetts received $477 in National Institutes of Health funding per resident, the highest level in the country, and accounted for 9.3 percent of total NIH funding. Award counts fell 6.2 percent. The state's pipeline contains 2,175 drug candidates, 26 percent of them in advanced modalities — a higher concentration than California or the US overall, both at 21 percent — plus roughly 2,400 trials in active development.
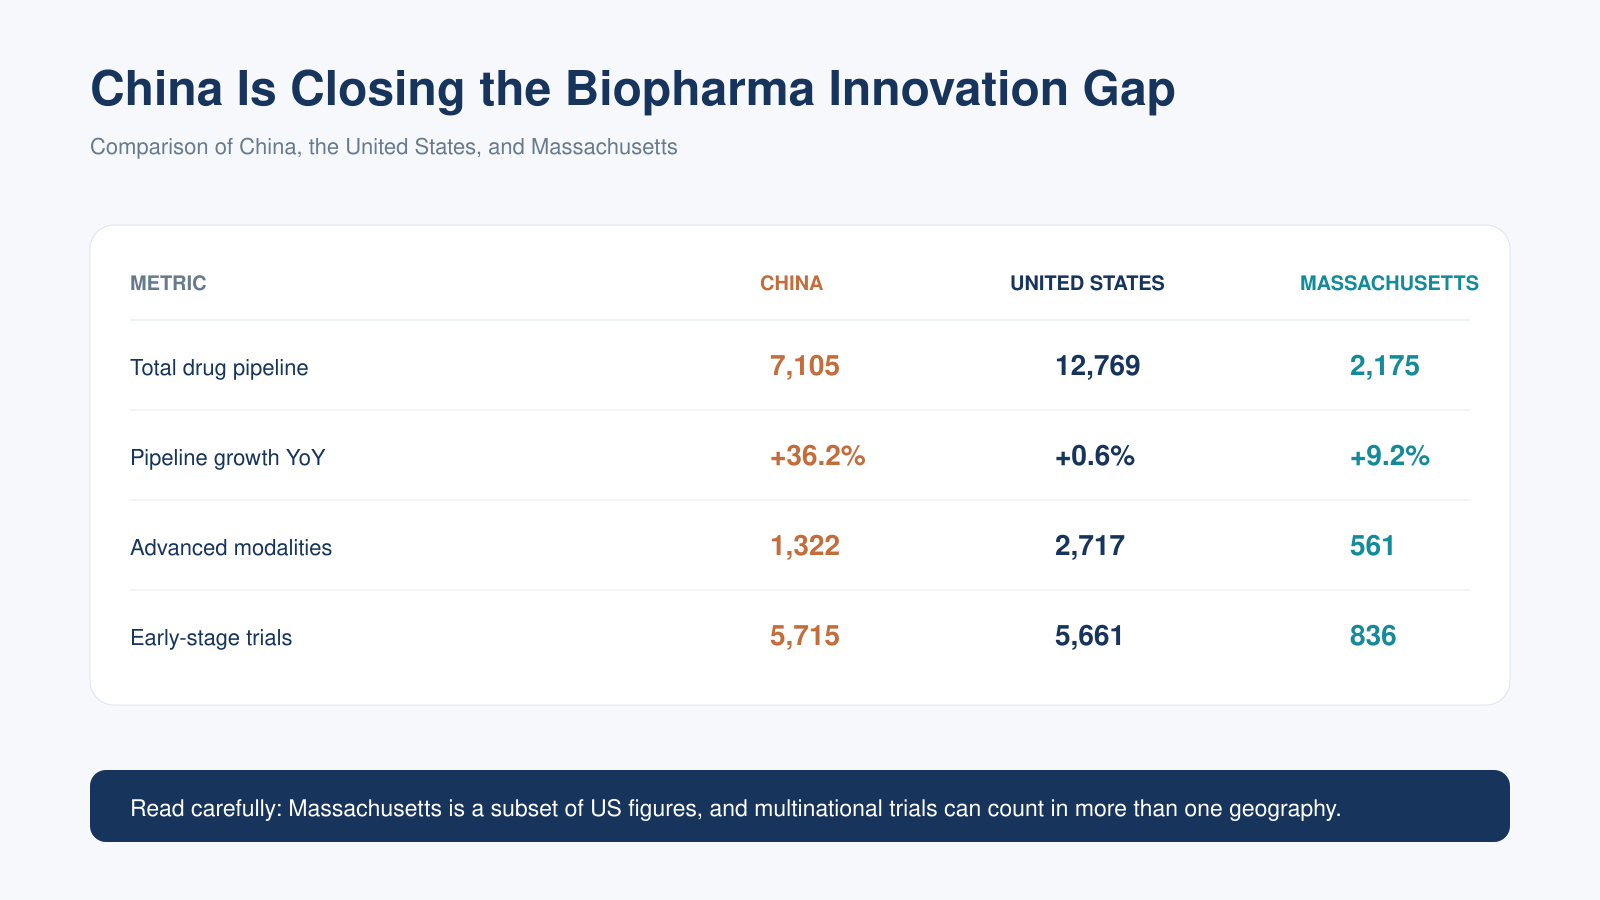
China expanded its drug pipeline 36.2 percent year over year to 7,105 candidates, passing Europe's 6,891 for the first time, against 0.6 percent growth for the United States and 9.2 percent for Massachusetts. China also recorded 5,715 early-stage trials, slightly more than the US total of 5,661.
Consult the original report through the MassBio Industry Snapshot page. Check employment through the Bureau of Labor Statistics Quarterly Census of Employment and Wages and federal awards through NIH RePORTER.
Data Cautions That Belong in Every Presentation
The report combines different measurement periods. Employment and federal data cover full-year 2025, investment data cover the first half of 2026, and pipeline data represent a July 2026 snapshot. These values should not be presented as if they describe one identical period — and the report itself says so in a footnote that most summaries drop.
Clinical-trial geographies overlap. Massachusetts is included within US totals, and a multinational trial is counted in every region where it runs, which means the regional columns cannot be summed to a global total. Licensing figures represent disclosed potential value, including contingent milestones, rather than cash already received. These distinctions are essential for an evidence-led presentation.
| Data set | Period covered | Source in the report |
|---|---|---|
| Employment and wages | Full-year 2025 | BLS QCEW |
| Venture capital, IPOs, M&A | First half of 2026 | PitchBook, July 2026 |
| Drug pipeline | July 2026 snapshot | Evaluate |
| Clinical trials | Active development, 2026 | Trialtrove |
| Lab real estate | Mid-2026 | JLL, Colliers, CBRE |
Put this table — or its equivalent — in the appendix of any deck built from the report. It answers the first question a careful reader will ask.
Use Case 1: Executive Biopharma Market Overview
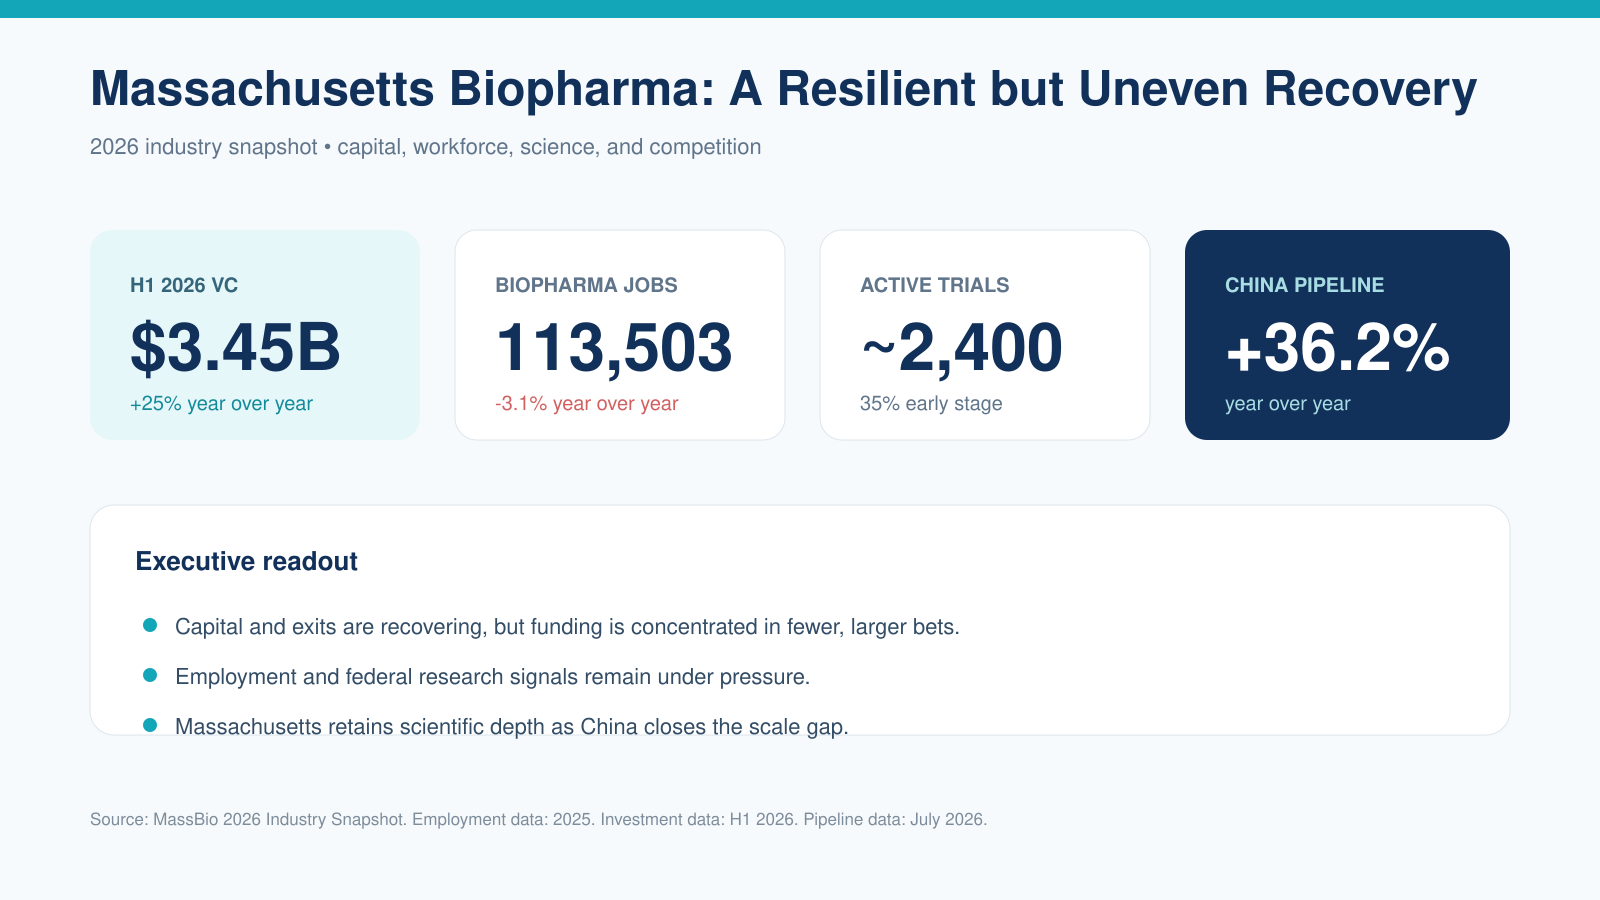
Senior leaders need a compact dashboard that balances recovery indicators with risk. Combine capital, employment, trials, and international competition on one slide, then state the strategic interpretation below the metrics.
The evidence this page must carry: the reporting period under every metric. The failure mode: four numbers from four periods presented as one moment in time.
Reusable AI prompt
Create one executive dashboard slide titled Massachusetts Biopharma: A Resilient but Uneven Recovery. Use four metric cards: 3.45 billion dollars in H1 2026 venture capital, 113,503 biopharma jobs in 2025, approximately 2,400 active clinical trials, and 36.2 percent year-over-year growth in China's drug pipeline. Add three conclusions: capital and exits are recovering, employment and federal research remain under pressure, and Massachusetts retains scientific depth while China closes the scale gap. Place reporting periods beneath each metric. Use a clean life-sciences palette with navy, teal, white, and light blue.
Use Case 2: Venture-Capital and Startup Funding Analysis
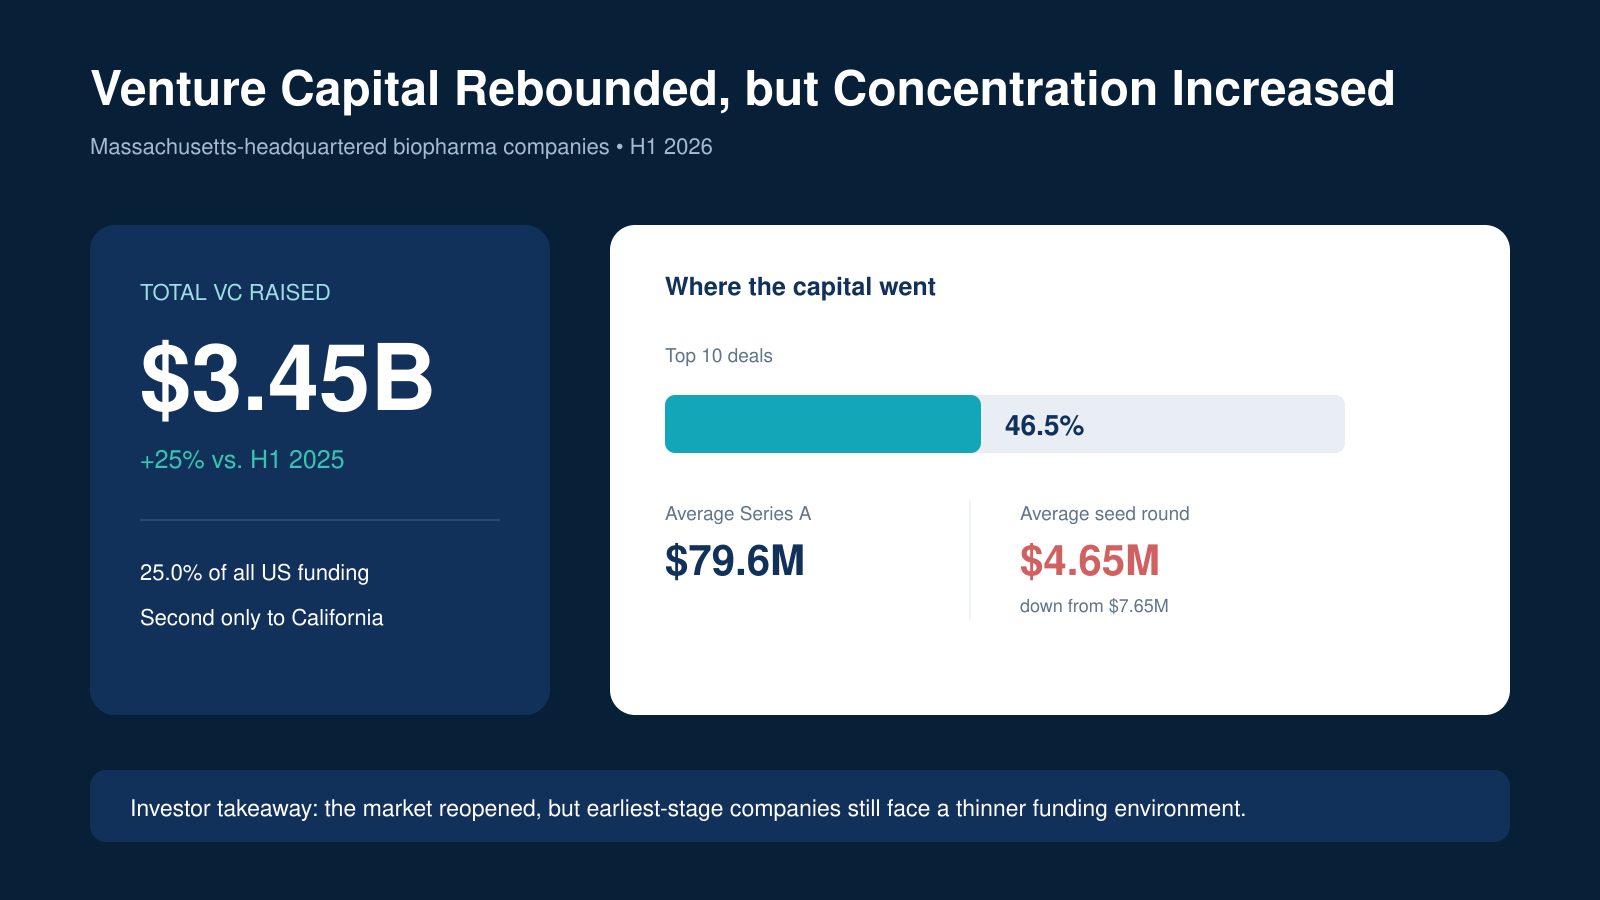
The headline funding recovery can hide unequal access to capital. The top 10 deals captured 46.5 percent of Massachusetts funding. The average Series A grew to $79.64 million from $61.68 million, while the average seed round fell to $4.65 million from $7.65 million — even though the number of seed deals rose from 15 to 21. The average Massachusetts round, at $34.1 million, ran well above the $21.4 million national average.
That combination matters more than the headline. The report makes the link explicit: today's IPO class was funded five to eight years ago, so a thinner seed and Series A environment now determines the size of the class at the end of the decade. A deck that celebrates eight IPOs without showing the seed line is telling half the story.
The evidence this page must carry: the distribution, not just the total. The failure mode: a single large funding number with no concentration measure beside it.
Reusable AI prompt
Design one investor presentation slide titled Venture Capital Rebounded, but Concentration Increased. Show 3.45 billion dollars raised in H1 2026, up 25 percent year over year and equal to 25 percent of US funding. Add a horizontal bar showing that the top 10 deals received 46.5 percent of Massachusetts capital. Compare the 79.6 million dollar average Series A with the 4.65 million dollar average seed round, down from 7.65 million. End with the implication that the market reopened while earliest-stage companies still face a thinner funding environment. Keep all numbers source-linked and editable.
Use Case 3: Workforce and Wage Divergence
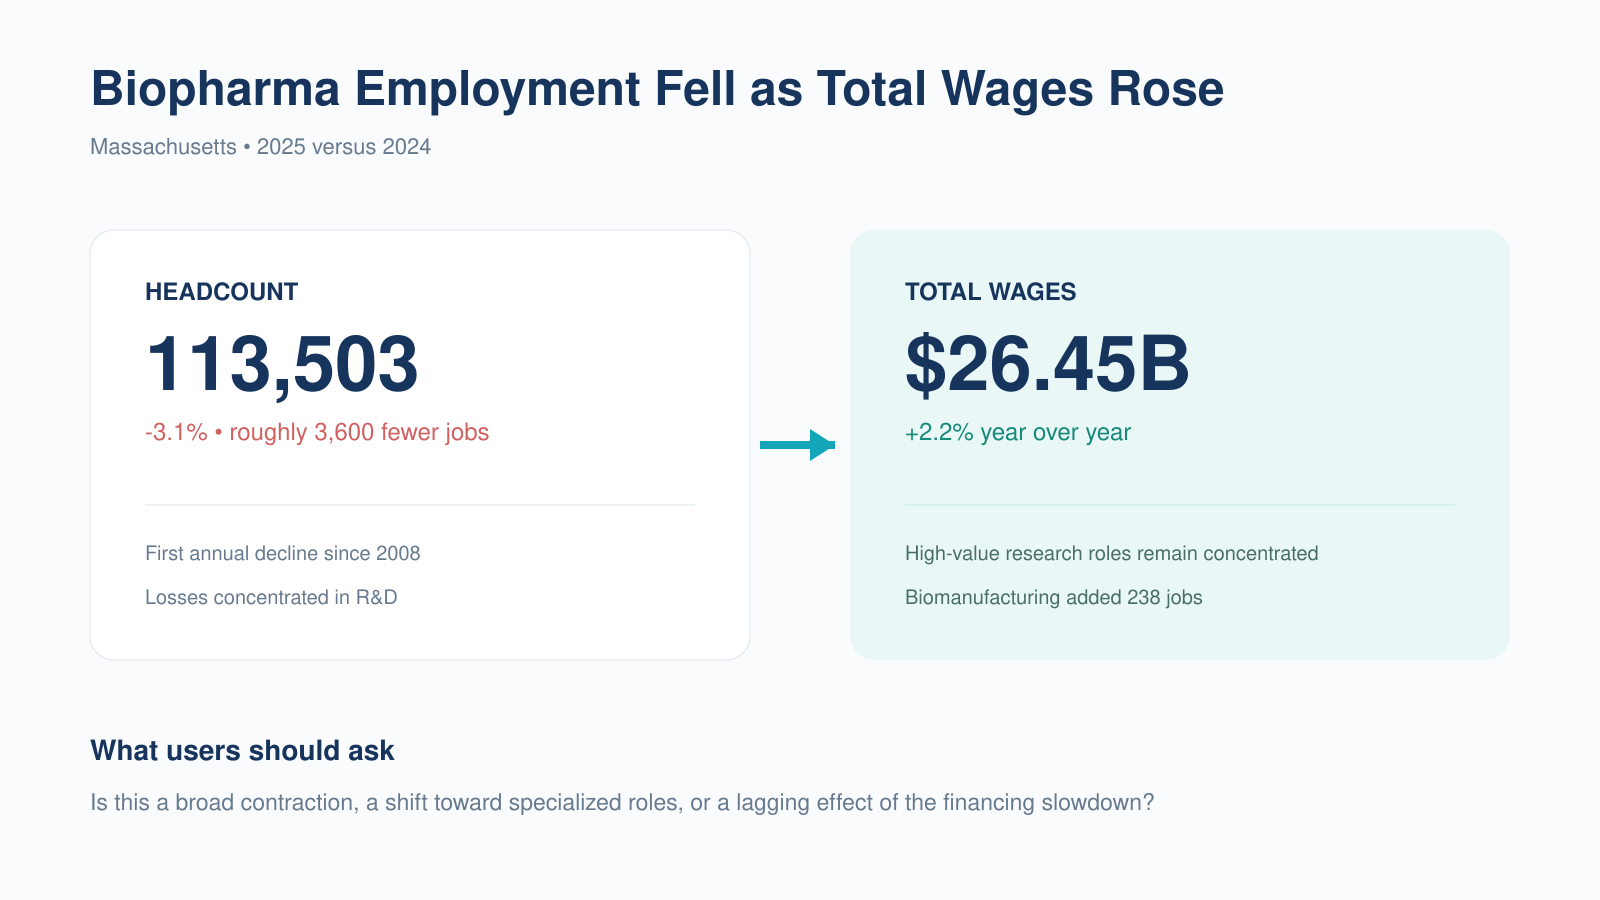
The employment section is useful for workforce planning, recruitment, public policy, and regional economic analysis. The key story is not simply job loss. Headcount declined while total wages increased, R&D absorbed most of the losses, and biomanufacturing returned to modest growth.
The R&D detail is where the competitive read sits. Massachusetts lost 2,563 R&D jobs in 2025, a 3.9 percent decline and the steepest among the major R&D hubs, while California held roughly flat at plus 0.3 percent. The gap between the two leading R&D states widened from about 400 jobs a year earlier to more than 3,100.
The evidence this page must carry: the divergence between headcount and wages, and which function absorbed the loss. The failure mode: dividing total wages by headcount to produce an "average salary" the data does not support.
Reusable AI prompt
Build one analytical slide titled Biopharma Employment Fell as Total Wages Rose. Compare 113,503 jobs, down 3.1 percent, with 26.45 billion dollars in total wages, up 2.2 percent. Note that this was the first annual employment decline in the more than two decades MassBio has tracked the data, that losses were concentrated in R&D, and that biomanufacturing added jobs. Add a discussion question asking whether the pattern reflects broad contraction, greater specialization, or a lagging effect of the financing slowdown. Do not calculate average compensation unless the methodology is explained.
Use Case 4: Clinical-Trial and Pipeline Positioning
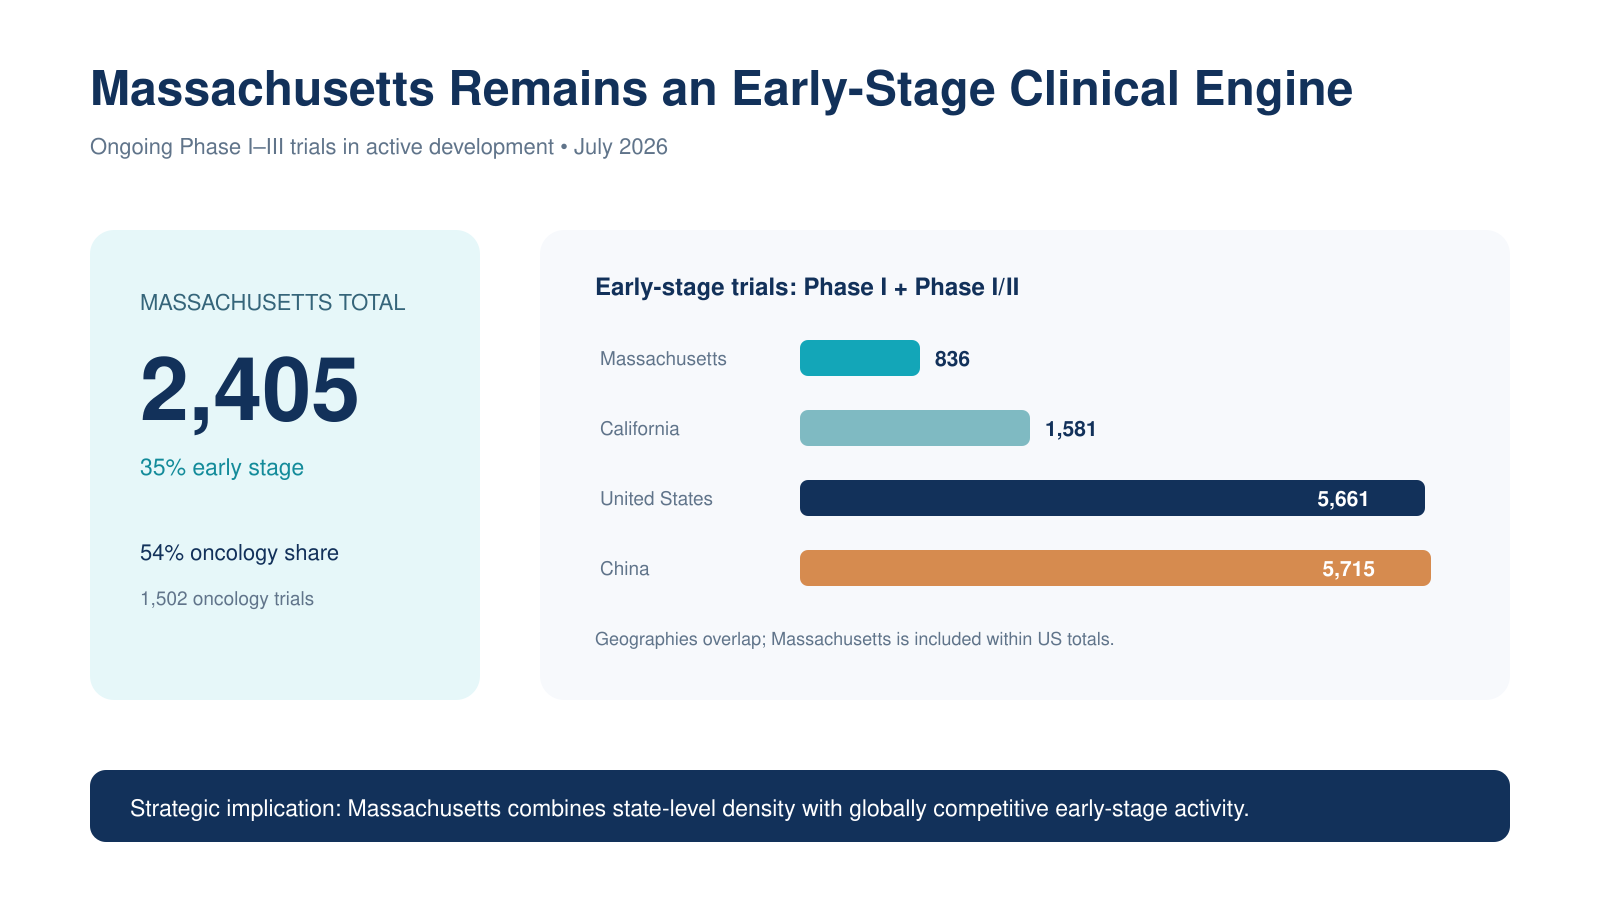
For pharmaceutical strategy teams, contract research organizations, hospitals, and academic centers, the most useful question is where new research begins. Massachusetts supports 2,405 ongoing Phase I to Phase III trials, with 35 percent in Phase I or Phase I/II. Oncology represents 54 percent of the state's therapeutic-area trials, above California's 51 percent and behind only China's 57 percent.
The early-stage comparison is the part worth putting on a chart:
| Region | Phase I | Phase I/II | Early-stage share | Total, Ph I–III |
|---|---|---|---|---|
| Massachusetts | 461 | 375 | 35% | 2,405 |
| California | 915 | 666 | 37% | 4,267 |
| United States | 3,763 | 1,898 | 45% | 12,718 |
| China | 4,230 | 1,485 | 46% | 12,378 |
The evidence this page must carry: a note that Massachusetts sits inside the US totals. The failure mode: a stacked bar implying the regions can be added together.
Reusable AI prompt
Create one clinical-development slide titled Massachusetts Remains an Early-Stage Clinical Engine. Show 2,405 ongoing Phase I to Phase III trials, 836 early-stage trials, a 35 percent early-stage share, and a 54 percent oncology share. Compare early-stage counts for Massachusetts at 836, California at 1,581, the United States at 5,661, and China at 5,715. Add a footnote that Massachusetts is included within US totals and that trial geographies can overlap. Use proportional bars without implying that the categories can be summed.
Public trial records can be investigated through ClinicalTrials.gov, although its search definitions may not reproduce commercial Trialtrove counts exactly.
Use Case 5: China, the United States, and Massachusetts
The China Watch section works best as a benchmark table rather than a dramatic race graphic. It compares scale and growth across the drug pipeline, advanced modalities, licensing, and clinical trials. The United States still leads in total pipeline scale and total ongoing trials, but China leads the geographies analyzed in early-stage trials and is expanding much faster.
The licensing line is the one most often missed. The report puts China's 2025 out-licensing value at roughly $79 billion, against $20.6 billion for the United States and $10.9 billion for Massachusetts — the dollar-denominated counterpart to the pipeline growth, and a more direct signal of how global pharma is sourcing science.
The evidence this page must carry: the growth rate next to the absolute level. The failure mode: presenting the comparison as a geopolitical narrative the source does not make.
Reusable AI prompt
Create one strategy slide titled China Is Closing the Biopharma Innovation Gap. Build a table comparing China, the United States, and Massachusetts across total drug pipeline, year-over-year pipeline growth, advanced-modality programs, and early-stage trials. Use these values: 7,105, 12,769, and 2,175 for total pipeline; 36.2 percent, 0.6 percent, and 9.2 percent for growth; 1,322, 2,717, and 561 for advanced modalities; and 5,715, 5,661, and 836 for early-stage trials. State that Massachusetts is a subset of the US figures. Avoid geopolitical language that is not supported by the source.
The Questions the Report Raises but Does Not Answer
Business users typically need more than a summary. Four questions come up in every review of this report, and a good deck states them as open rather than pretending the data settles them.
Does the capital recovery reach seed-stage companies? The totals say yes and the averages say no. Seed deal count rose from 15 to 21 while the average round nearly halved, which means more companies are being funded at a scale that buys less runway.
Which roles account for the employment losses? The report gives the function — R&D, down 2,563 jobs — but not the composition. Whether that is early-career scientists, senior staff, or contract conversion changes the hiring implication entirely.
Does wage growth reflect specialization or composition? Total wages rose while headcount fell. That is consistent with a shift toward higher-paid roles, with the loss of lower-paid ones, or with both. Do not resolve it on a slide without a methodology note.
What does the lab vacancy signal mean? Statewide lab and manufacturing vacancy reached roughly 31 percent by mid-2026, up from about 28 percent a year earlier, on an inventory of 63.2 million square feet that has nearly tripled since 2015. The same number supports two readings — weak current demand, or room to expand without new construction — and the report's own example, Biogen's 580,000-square-foot Cambridge lease in 2025, shows anchor tenants still committing.
For any decision deck, separate reported facts from interpretation. Preserve source dates, define every denominator, avoid adding overlapping geographies, and distinguish potential deal value from realized revenue.
Build the Presentation with Tosea AI
Tosea AI can turn a long industry report into an editable presentation while keeping the underlying narrative visible for review. Upload the MassBio PDF, define the audience and decision objective, choose the number of slides, and instruct the AI to retain source notes and reporting periods.
Tosea AI supports one-click layout and diagram selection at two points. During the outline stage, assign a comparison table, timeline, metric dashboard, process, or chart before rendering begins. After the slides are rendered, continue modifying the layout or diagram without rebuilding the entire deck. Use Layout Only when the wording is approved and only the visual structure should change.
A practical workflow is to upload the source, confirm the audience, review the outline, choose a layout for each section, generate the deck, verify every number against the report, and export an editable PPTX for final testing. For a report this dense, the verification step is the one that cannot be skipped — a generated slide is a presentation of the numbers you supplied, not an audit of them. Our guide on turning a research paper into a presentation covers the same discipline for academic sources.
Frequently Asked Questions
What is the MassBio Industry Snapshot?
It is an annual report published by MassBio, the Massachusetts Biotechnology Council, covering the state's biopharma sector across employment, wages, venture capital, public markets, NIH funding, drug pipeline, clinical trials, and lab real estate. The 2026 edition runs 41 pages and adds sections on licensing, clinical trials, and China.
Why did Massachusetts biopharma employment fall in 2025?
The report records a 3.1 percent decline to 113,503 jobs, concentrated in research and development, which lost 2,563 positions. It presents this as the first annual decline in the more than two decades MassBio has tracked the data, and links it to the broader financing slowdown rather than to any single cause.
Can the clinical-trial figures for different regions be added together?
No. A multinational trial is counted in every region where it runs, and Massachusetts is included within the US totals. Regional counts are comparisons, not components of a global sum.
Can Tosea AI redesign my existing PowerPoint without changing the content?
Yes. Export the PowerPoint as a PDF, upload the PDF to Tosea AI, and request a redesign that keeps the original wording. Use Layout Only when the goal is to refresh visual structure without rewriting the content. Review the result to confirm that every label, footnote, and slide element remains complete.
How do I upload a PowerPoint and ask Tosea AI to redesign each slide?
First export the PowerPoint file as a PDF. Upload that PDF to Tosea AI and explain that you want each slide redesigned while preserving its content and sequence. Choose a template or describe the visual direction, generate the deck, and inspect each slide before exporting the revised presentation.
Can I upload my own PowerPoint template to Tosea AI?
Tosea AI supports custom templates on eligible paid plans. Upload or configure the template according to the product workflow, then use it when generating the research presentation. Check that required slide layouts, fonts, colors, logo placement, and master-slide rules are represented correctly before sharing the final deck.
Can Tosea AI use custom brand colors, fonts, and a logo?
Yes. Specify the required brand colors and fonts in the presentation instructions and upload the logo or use a custom template where supported. Custom logo and custom template features are available on eligible plans. After export, verify font availability, color values, logo clear space, and contrast in PowerPoint.
Can Tosea AI match the style of my old company presentations?
Tosea AI can use a representative company deck as design guidance, but learning a style should not imply permanent model training. For stronger consistency, use an approved custom template containing the company layouts, colors, fonts, and logo. Compare the generated deck with the original brand guidelines before distribution.
Does Tosea AI preserve PowerPoint formatting after export?
Tosea AI editable PPTX export is designed to remain close to the generated preview while keeping elements available for further editing. Results can vary with fonts, complex graphics, and the application used to open the file. Test the exported deck in the exact PowerPoint environment used for delivery before presenting.
Can I tell AI to edit the layout only and keep the exact wording?
Yes. Tosea AI provides a Layout Only editing mode for changing visual layout without intentionally rewriting the slide content. This is useful when wording has already been approved. After the edit, compare the new slide with the source to confirm that labels, citations, footnotes, and line breaks remain correct.
Turn Complex Biotech Data into a Decision-Ready Deck
The 2026 Massachusetts Biopharma Industry Snapshot shows why a strong industry presentation must hold several truths at once: investment and exits can recover while employment falls, scientific density can remain exceptional while competitors scale faster, and abundant laboratory space can support future growth while signaling weak current demand.
Use Tosea AI to transform the report into an editable, source-aware presentation, select layouts and diagrams during the outline, and refine the visual structure after rendering.
Continue with these related guides: how to turn a research paper into a presentation, the best AI tool for science presentations in 2026, scientific figure skills for researchers, biology and medical research topics for presentations, and the best prompts for academic presentation slides.
Sources
- 2026 MassBio Industry Snapshot — Massachusetts Biotechnology Council, August 2026
- Quarterly Census of Employment and Wages — US Bureau of Labor Statistics
- NIH RePORTER — National Institutes of Health
- ClinicalTrials.gov — US National Library of Medicine
Figures in this article are drawn from the 2026 MassBio Industry Snapshot and its cited providers, including PitchBook, Evaluate, Trialtrove, Biomedtracker, JLL, Colliers, and CBRE. The slide examples are original and illustrative.