


Experience curve prompt for PowerPoint
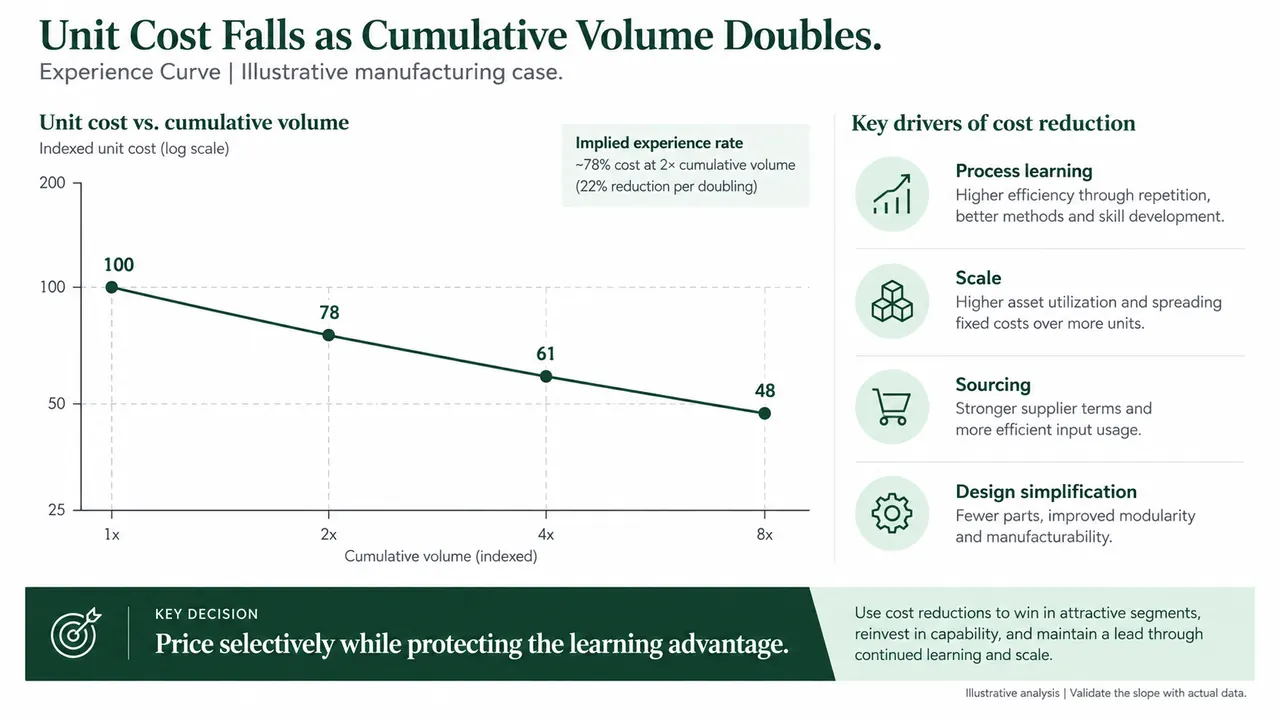
A BCG-style prompt for one slide that tests whether accumulated volume is lowering your costs. It plots inflation-adjusted unit cost against cumulative volume, estimates the cost change per doubling and ties the result to a pricing, capacity, sourcing or investment decision.
Experience curve prompt
Fill in any highlighted fields, then copy or run it.
Create one 16:9 Experience Curve slide for [product or operation].
Decision: [pricing, capacity, sourcing, or investment decision]
Use only these verified data: [date, cumulative volume, unit cost, inflation adjustment, sources].
Plot real unit cost against cumulative volume and estimate the cost change per doubling.
Separate actual observations from forecasts.
Show the contribution of process learning, scale, sourcing, and design changes where supported.
State the commercial implication and one risk to the curve.
Use a restrained green consulting layout with an action title and source footer.
Do not fabricate missing observations.
Why this prompt works
Costs are in real terms
The prompt asks for an inflation adjustment and plots real unit cost. Without it, general price inflation can hide a learning effect or fake one.
The slope becomes one number
The model estimates the cost change per doubling of cumulative volume, which is the figure a pricing or capacity discussion actually needs.
Forecasts are kept apart
Actual observations and forecasts must be shown separately, and missing points must not be fabricated, so the curve never looks smoother than the data.
Drivers are split out
Where the evidence supports it, the slide splits the decline into process learning, scale, sourcing and design changes, then names one risk to the curve.
Adapt it to your own deck
Feed it your cost history
Attach the cost ledger or volume report and add "Use only dated observations from the attached file and state the deflator you applied."
Point it at your decision
Replace the decision placeholder with the one on the table. For a pricing question, add "Overlay average market price on the same axes." The gap between price and cost is the story.
Compare two products or plants
Add "Plot both on the same log-log axes and report the cost change per doubling for each." Keep it to two series so the slide stays readable.
Experience curve FAQ
What is an experience curve?
An observation popularized by BCG in the 1960s: each time cumulative production doubles, real unit cost tends to fall by a roughly constant percentage. It is plotted on log scales so the relationship appears as a straight line.
How is it different from a learning curve?
A learning curve usually tracks labor time or labor cost as workers repeat a task. The experience curve is broader and covers total unit cost, including scale, sourcing and design effects, which is why the prompt asks for those drivers.
Can I run this prompt in ChatGPT, Claude or Gemini?
Yes, and you will get the per-doubling estimate and a slide outline as text. Tosea uses the same prompt with your attached data file to lay out the chart and drivers as an editable slide that exports to PowerPoint.
Is this an official BCG template?
No. The experience curve is a public concept, and "BCG-style" describes the green, conclusion-led layout. Tosea is not affiliated with BCG.
BCG-style describes a common consulting framework. Tosea is not affiliated with Boston Consulting Group. Figures on the example slides are illustrative.
Prefer not to write a prompt?
Upload the document. Tosea drafts the deck, you edit and export.
Start for free