How to Make a Deloitte-Style RFM Analysis PowerPoint with AI
Build a Deloitte-style RFM analysis PowerPoint with AI: calculate recency, frequency, and monetary value, map eight customer segments, and turn them into measurable actions.
An RFM analysis PowerPoint should turn customer transactions into a decision, not decorate three letters on a slide. This guide shows consultants, CRM teams, and commercial analysts how to calculate Recency, Frequency, and Monetary value, reduce the model to eight usable segments, and present the result in a concise executive deck. With Tosea AI, you can bring in research files or transaction data, shape the storyline, select a layout or diagram, create editable charts in Data Studio, and export an editable PPTX for final review.
The slide examples below are original editorial references built with illustrative data. They are not Deloitte templates, and Tosea AI is not affiliated with or endorsed by Deloitte.
In brief: Define one observation date, one purchase window, and one defensible measure for each RFM variable. Segment customers only after checking returns, duplicate orders, currencies, and missing IDs. Then connect every segment to an owner, treatment, timing rule, and measurable outcome.
What is the RFM model?
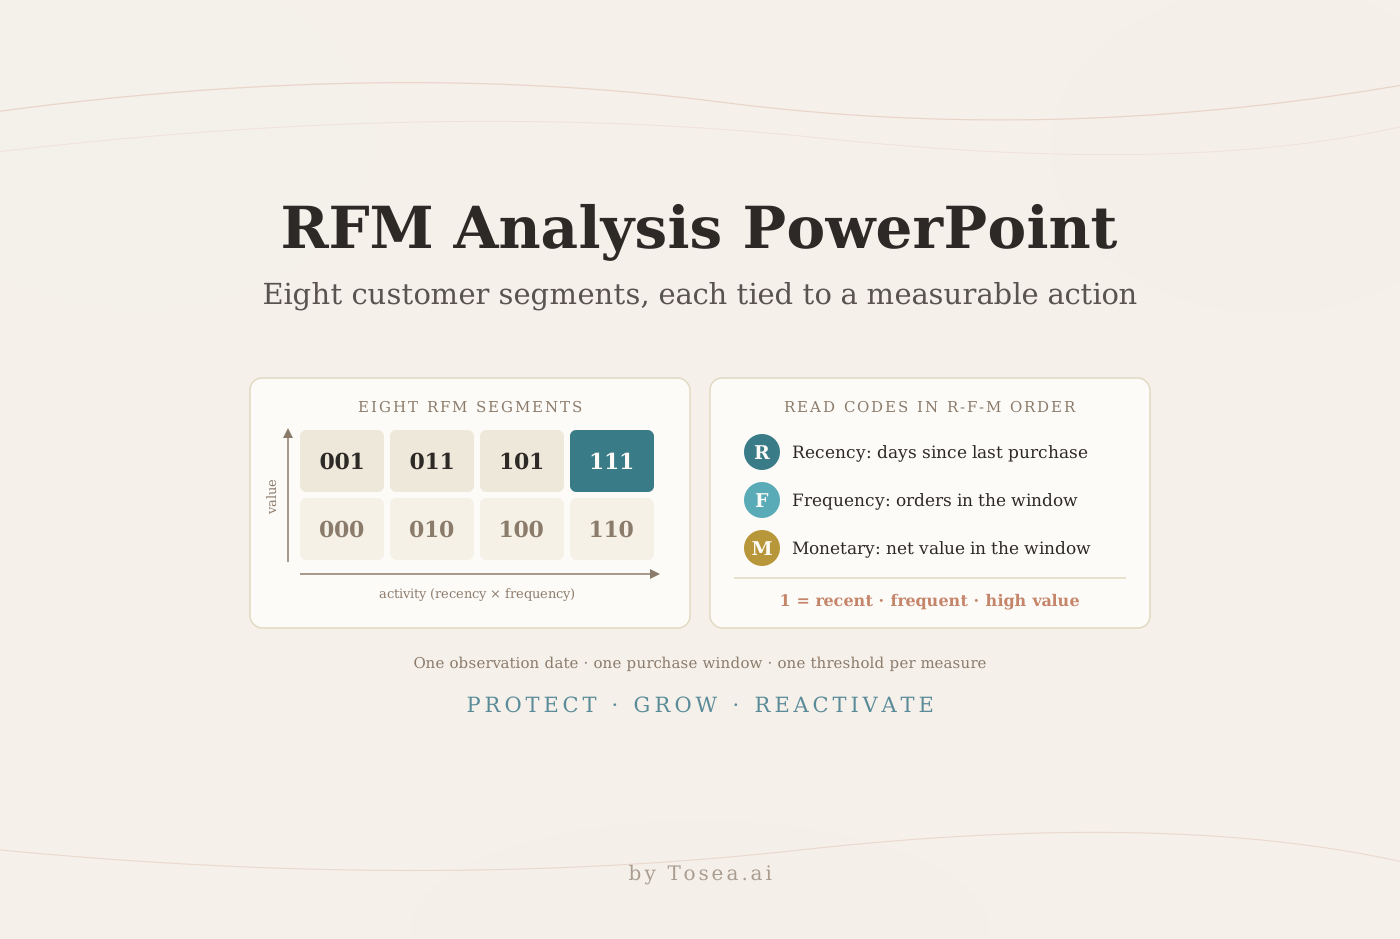
RFM is a behavioral customer segmentation method based on three measures:
- Recency: the time since a customer last completed a qualifying purchase. A smaller raw value normally indicates stronger recent activity.
- Frequency: the number of qualifying purchases within a defined period.
- Monetary value: the value generated in that period. Depending on the decision, this may be net revenue, gross margin, contribution, or another consistent measure.
Recent academic work continues to use RFM as a practical representation of purchasing behavior. A 2026 open-access study in Quality & Quantity defines recency as elapsed days, frequency as transaction count, and monetary value as the sum of transaction values before applying clustering methods. The paper also demonstrates why preprocessing and treatment of unusual observations matter when the customer base is large. See the Springer study on RFM customer segmentation.
Traditional quintile scoring creates up to 5 x 5 x 5, or 125, combinations. That level of detail can be useful for modeling, but it is hard to operate in a campaign calendar or management meeting. A binary high-low split produces eight combinations. It is easier to explain, assign, and test. The tradeoff is less granularity, so retain the underlying continuous values for analysis.
Build the data before building the slide
Start with customer-level fields that can be reconciled to the source system.
| Measure | Practical calculation | Decision to document |
|---|---|---|
| Recency | Observation date minus latest qualifying order date | What counts as a completed purchase? |
| Frequency | Distinct qualifying orders in the analysis window | Are cancellations, returns, and subscriptions included? |
| Monetary | Sum of net value in the same window | Revenue, margin, or contribution? |
| Segment | High or low score for R, F, and M | Median, percentile, business threshold, or category norm? |
Use the same time window for frequency and monetary value. Recency needs one fixed observation date, otherwise two analysts can obtain different scores from the same file. If purchase cycles vary widely by category, score within comparable groups rather than applying one company-wide threshold. RFM is a snapshot, so validate whether customers move between segments over time instead of treating the label as permanent.
How to read an RFM segment code
Each binary code reads in R-F-M order, and 1 always means the favorable side of the threshold: recent for recency, frequent for frequency, and high value for monetary. So 011 means not recent, frequent, and high value, a loyal customer who has gone quiet. 101 means recent, not yet frequent, and high value. Writing this rule in the slide footnote prevents the most common labeling error on RFM maps, where codes and descriptions drift apart.
The worked example below uses an observation date of September 30, a 12-month window, and three business thresholds: purchased within 60 days, at least 4 orders, and at least 600 USD in net revenue.
| Customer | Days since last order | Orders in 12 months | Net revenue (USD) | Code | Segment |
|---|---|---|---|---|---|
| C-101 | 12 | 9 | 2,340 | 111 | Champions |
| C-102 | 140 | 7 | 1,180 | 011 | At-Risk Loyalists |
| C-103 | 25 | 1 | 920 | 101 | Promising High Spenders |
| C-104 | 210 | 2 | 1,450 | 001 | Win-Back Targets |
| C-105 | 18 | 6 | 310 | 110 | Loyal Regulars |
| C-106 | 34 | 1 | 85 | 100 | New Buyers |
| C-107 | 95 | 5 | 260 | 010 | Drifting Regulars |
| C-108 | 300 | 1 | 40 | 000 | Dormant Low Value |
In a real deck, each row would be a segment with customer counts, revenue share, and average order value rather than a single customer. The logic is the same: the code is derived from the thresholds, and the segment name is derived from the code, never the other way around.
Use case 1: Explain the model to executives
The first slide should answer what the model measures, which customers matter now, and what management should do. Avoid a long methodology lecture. Define R, F, and M on the left, then show the four priority segments and one decision-led takeaway.
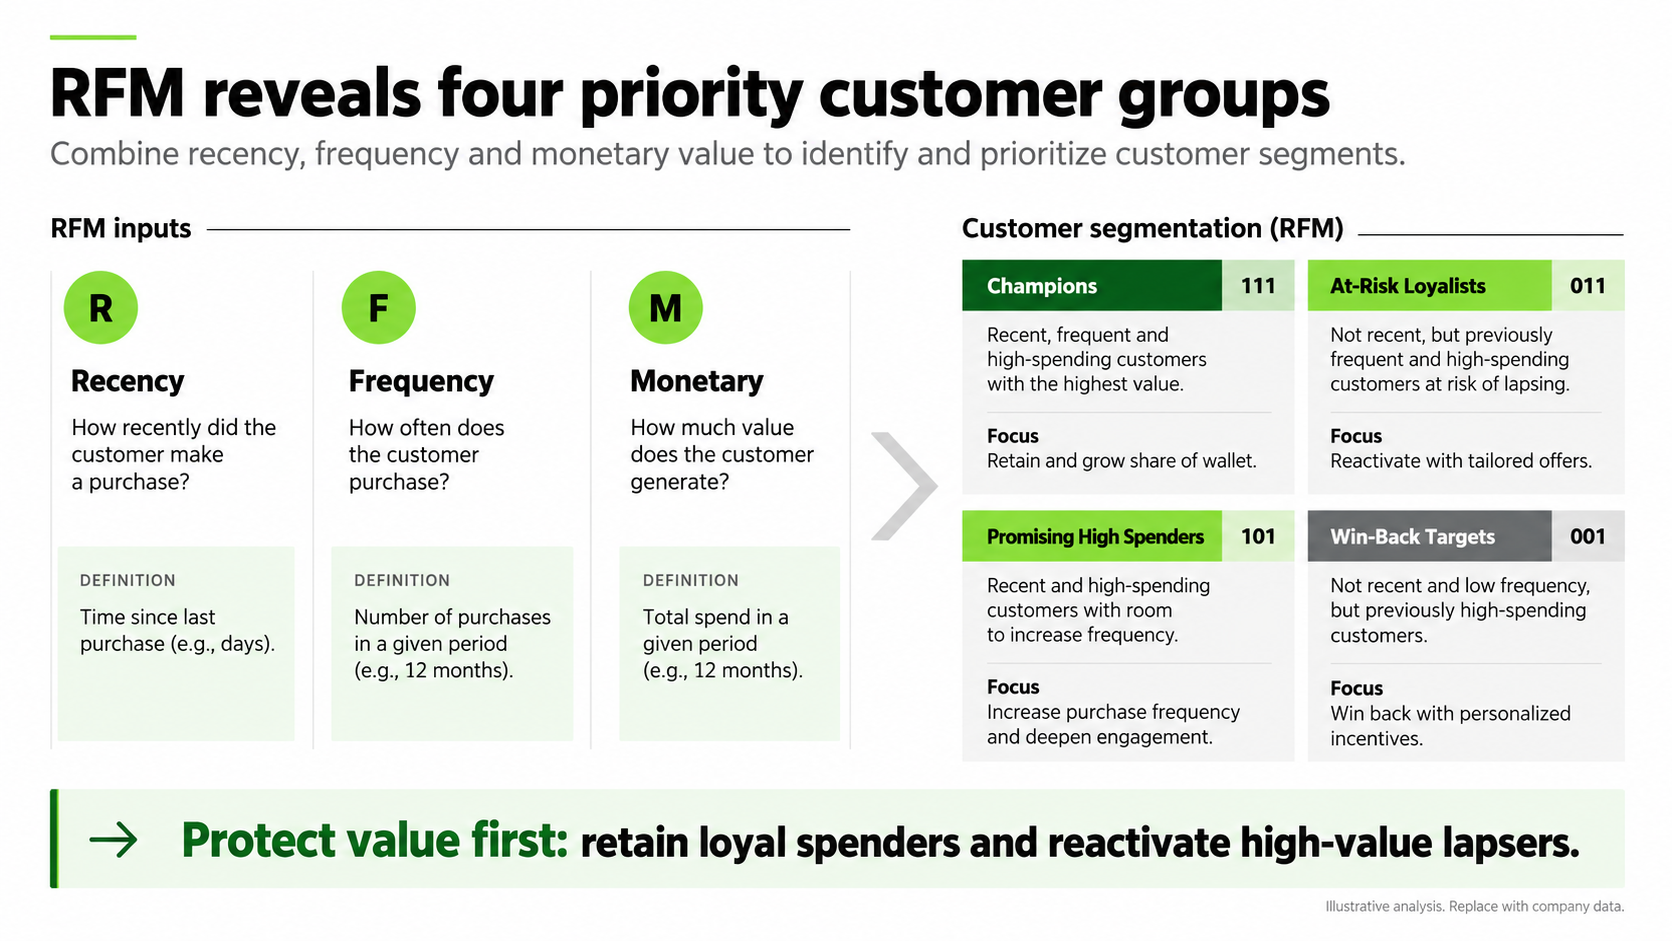
Copyable AI prompt
Create one 16:9 executive RFM analysis slide for a customer strategy review.

Show Recency, Frequency, and Monetary value with one plain-English definition and one calculation note for each. Present four priority segments: 111 Champions, 011 At-Risk Loyalists, 101 Promising High Spenders, and 001 Win-Back Targets. Add one action for every segment and finish with a conclusion-led recommendation.

Use a white background, black type, vivid green highlights, pale mint support areas, and a precise consulting grid. Do not use logos. Label every figure as actual, estimated, or illustrative. Do not invent missing data.
Use case 2: Turn eight segments into an action map
An eight-segment page is useful for CRM governance and campaign planning. The common mistake is to name every cell without defining the treatment. Add the desired action beside the map: protect, grow, reactivate, or deprioritize. Also state how high and low were calculated.
Because the vertical axis in the example is monetary value, every code in the top row ends in 1 and every code in the bottom row ends in 0. Along the horizontal axis, activity rises from customers who are neither recent nor frequent (left) to customers who are both (right). Checking those two rules takes seconds and catches misplaced cells before a reviewer does.
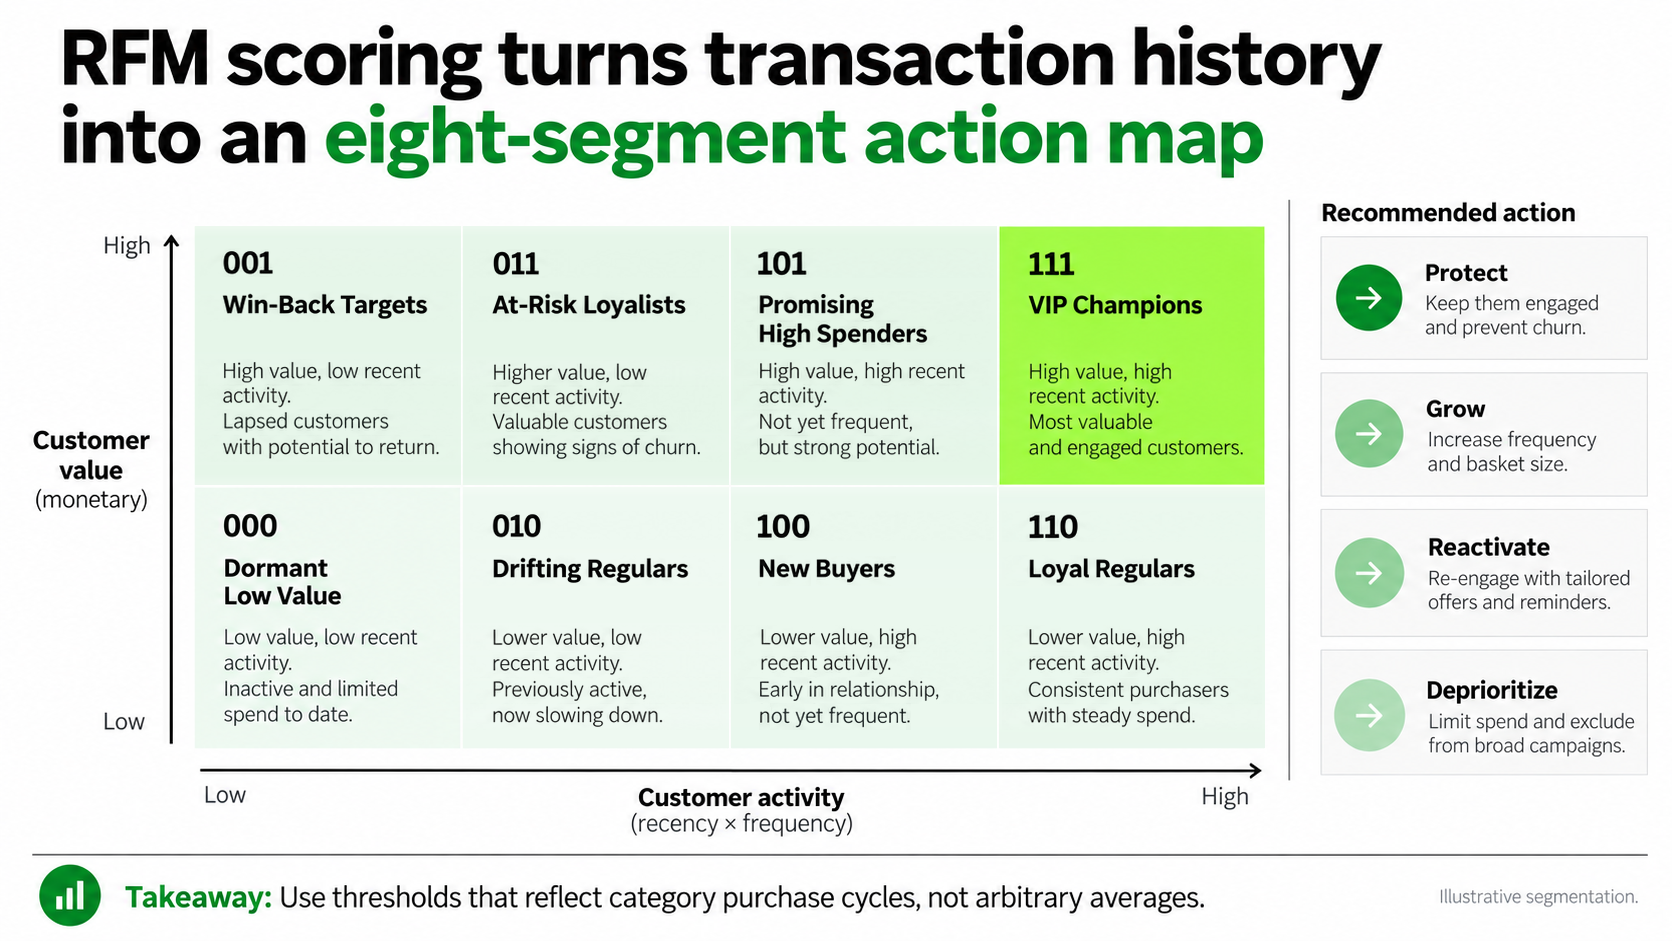
Copyable AI prompt
Build one 16:9 RFM customer action map using the eight binary combinations from 000 to 111.

For every cell, show segment name, behavioral description, recommended action, and owner. Use customer activity on the horizontal axis and customer value on the vertical axis. Read every code in R-F-M order, so all high-value codes (ending in 1) sit in the top row. Highlight 111 as the priority group. Add the scoring threshold, analysis period, observation date, and customer count in a source note.

Use a restrained green consulting palette and a conclusion-led title. Keep the original data and terminology. Flag any segment that lacks an agreed treatment.
Use case 3: Design measurable segment treatments
RFM becomes useful when a segment receives a different treatment and the team can measure incremental impact. A campaign slide should connect the audience, commercial objective, offer, channel, timing, and success metric. Use a holdout group where the business can support one. Report incremental revenue and margin after incentives, not response rate alone.
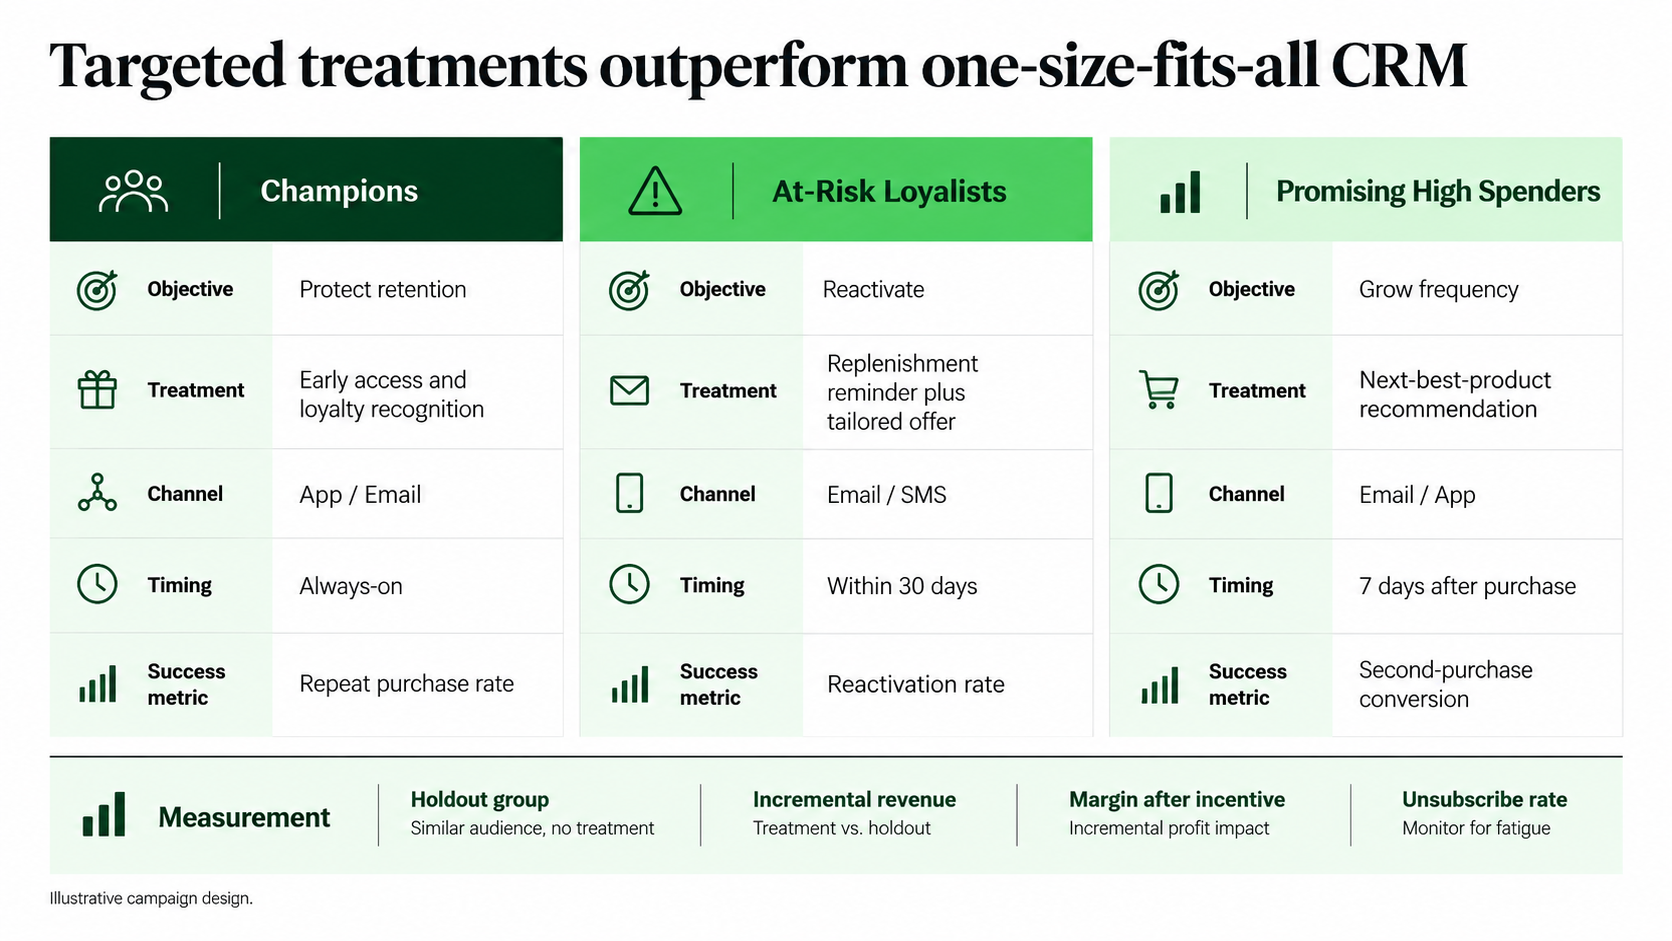
Copyable AI prompt
Create one 16:9 CRM treatment slide for three RFM segments: Champions, At-Risk Loyalists, and Promising High Spenders.

For each segment, specify objective, treatment, channel, trigger timing, owner, and success metric. Add a measurement strip covering holdout group, incremental revenue, margin after incentive, unsubscribe rate, and test duration. Separate source facts from proposed actions.

Use a white background, dark green headers, lime emphasis, compact tables, and generous whitespace. Do not claim that a treatment works unless experimental results are provided.
The example slide's title states a hypothesis about targeted treatments. In a real deck, keep a title like that only after a holdout test supports it; before the test, phrase it as a plan, such as "Three segment treatments will be tested against a holdout."
Use case 4: Show where RFM fits and where it needs adjustment
RFM works naturally in businesses with repeat purchases or renewals, including retail, beauty, grocery, restaurants, telecom, maintenance, travel, and financial services. It needs adjustment when buying cycles are long, purchases depend on contracts, or several stakeholders influence one account. In those cases, add product usage, engagement, service interval, contract status, profitability, or account-level relationship measures.
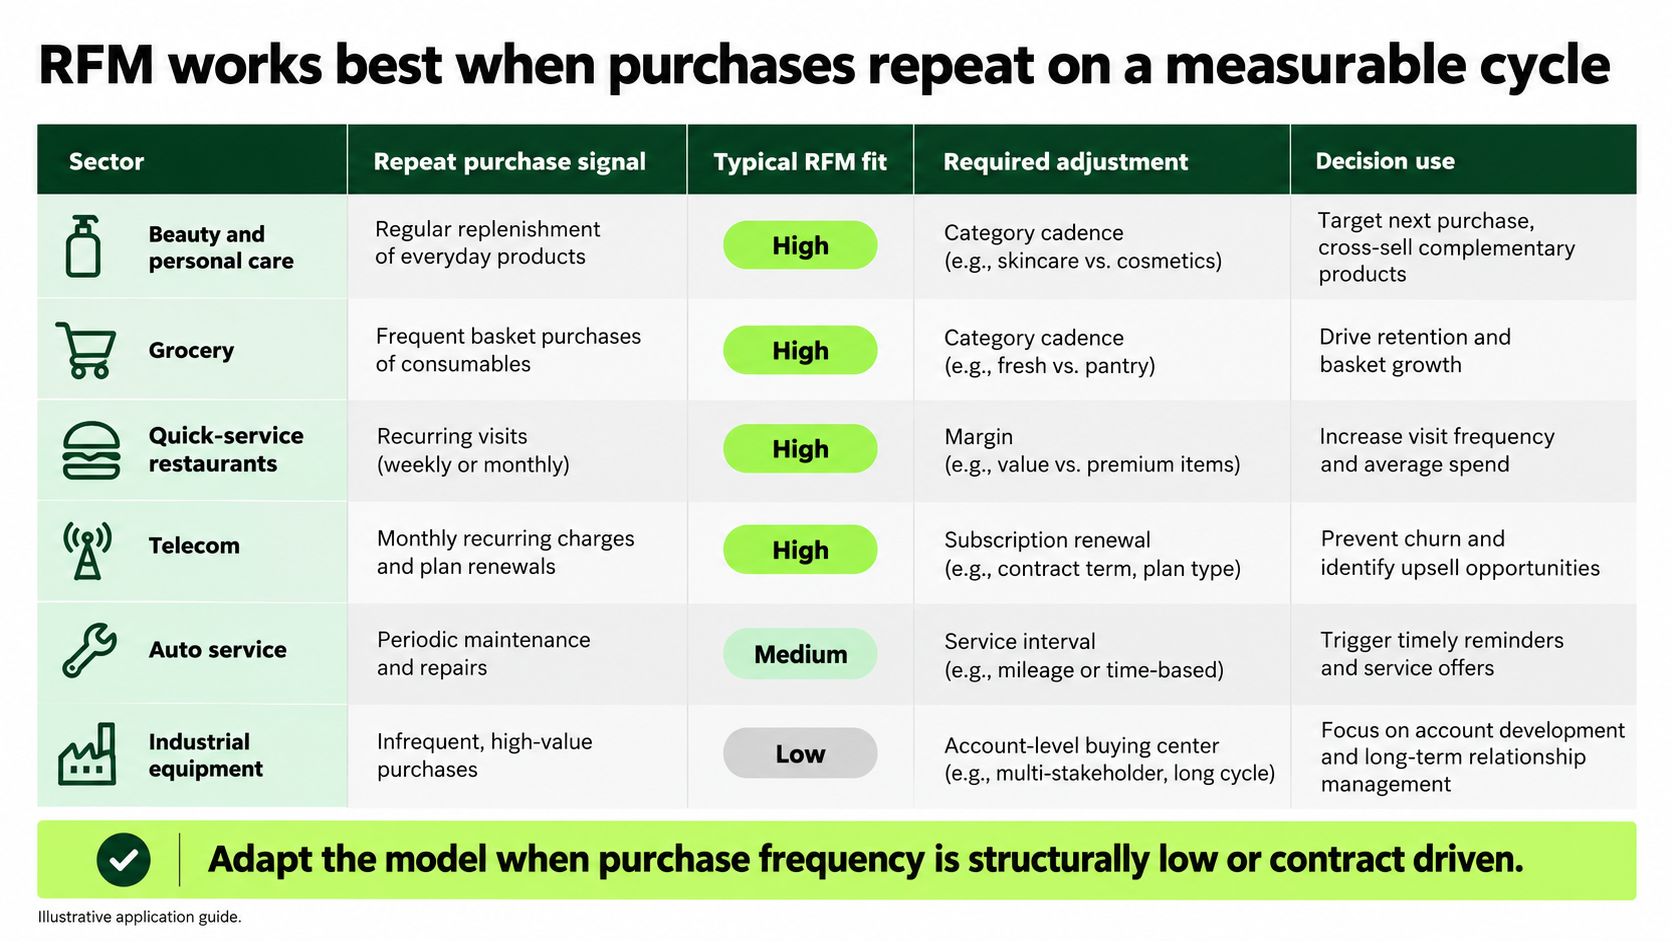
Copyable AI prompt
Create one 16:9 industry applicability slide for the RFM model.

Compare beauty, grocery, quick-service restaurants, telecom, auto service, and industrial equipment. For each sector, show repeat purchase signal, typical RFM fit, required adjustment, and decision use. Rate fit as high, medium, or low only when the stated purchase logic supports the rating.

Use a simple consulting table with green emphasis and one takeaway banner. Mark the content as an application guide rather than empirical evidence.
Five mistakes that make RFM slides misleading
- Mismatched windows. Frequency over 12 months and monetary value over 24 months produce segments that cannot be compared.
- Gross instead of net value. Without returns and discounts removed, heavy returners look like high-value customers.
- One threshold for every category. A grocery shopper and a furniture buyer have different natural purchase cycles.
- Treating segments as permanent. RFM is a snapshot; show migration between periods if the deck supports a retention decision.
- Response rate without a holdout. A campaign can earn responses from customers who would have purchased anyway. Report incremental results.
For a broader method of presenting commercial data to leadership, see our executive sales data presentation framework.
Make the deck feel professional without copying a brand
Use green as an information signal, not as wallpaper. Keep most of the page white, reserve a dark green for section headers, and use brighter green for one priority or recommendation. Write an action title that states the conclusion. Place definitions, dates, sample size, units, and source notes where a reviewer can find them.
Do not rely on color alone. Microsoft recommends using text, patterns, or shapes in addition to color and adding descriptive alternative text to visual objects. Its PowerPoint accessibility guidance also recommends simple table structures with clear headers.
Turn RFM data into editable charts with Tosea AI Data Studio
RFM source data often starts in Excel, CSV, a CRM export, or a chart trapped inside a report. Tosea AI Data Studio can import Excel or CSV data and recognize values from charts and tables in uploaded material. You can review the extracted data, edit labels and values, choose another chart type, and apply colors that follow the presentation theme.
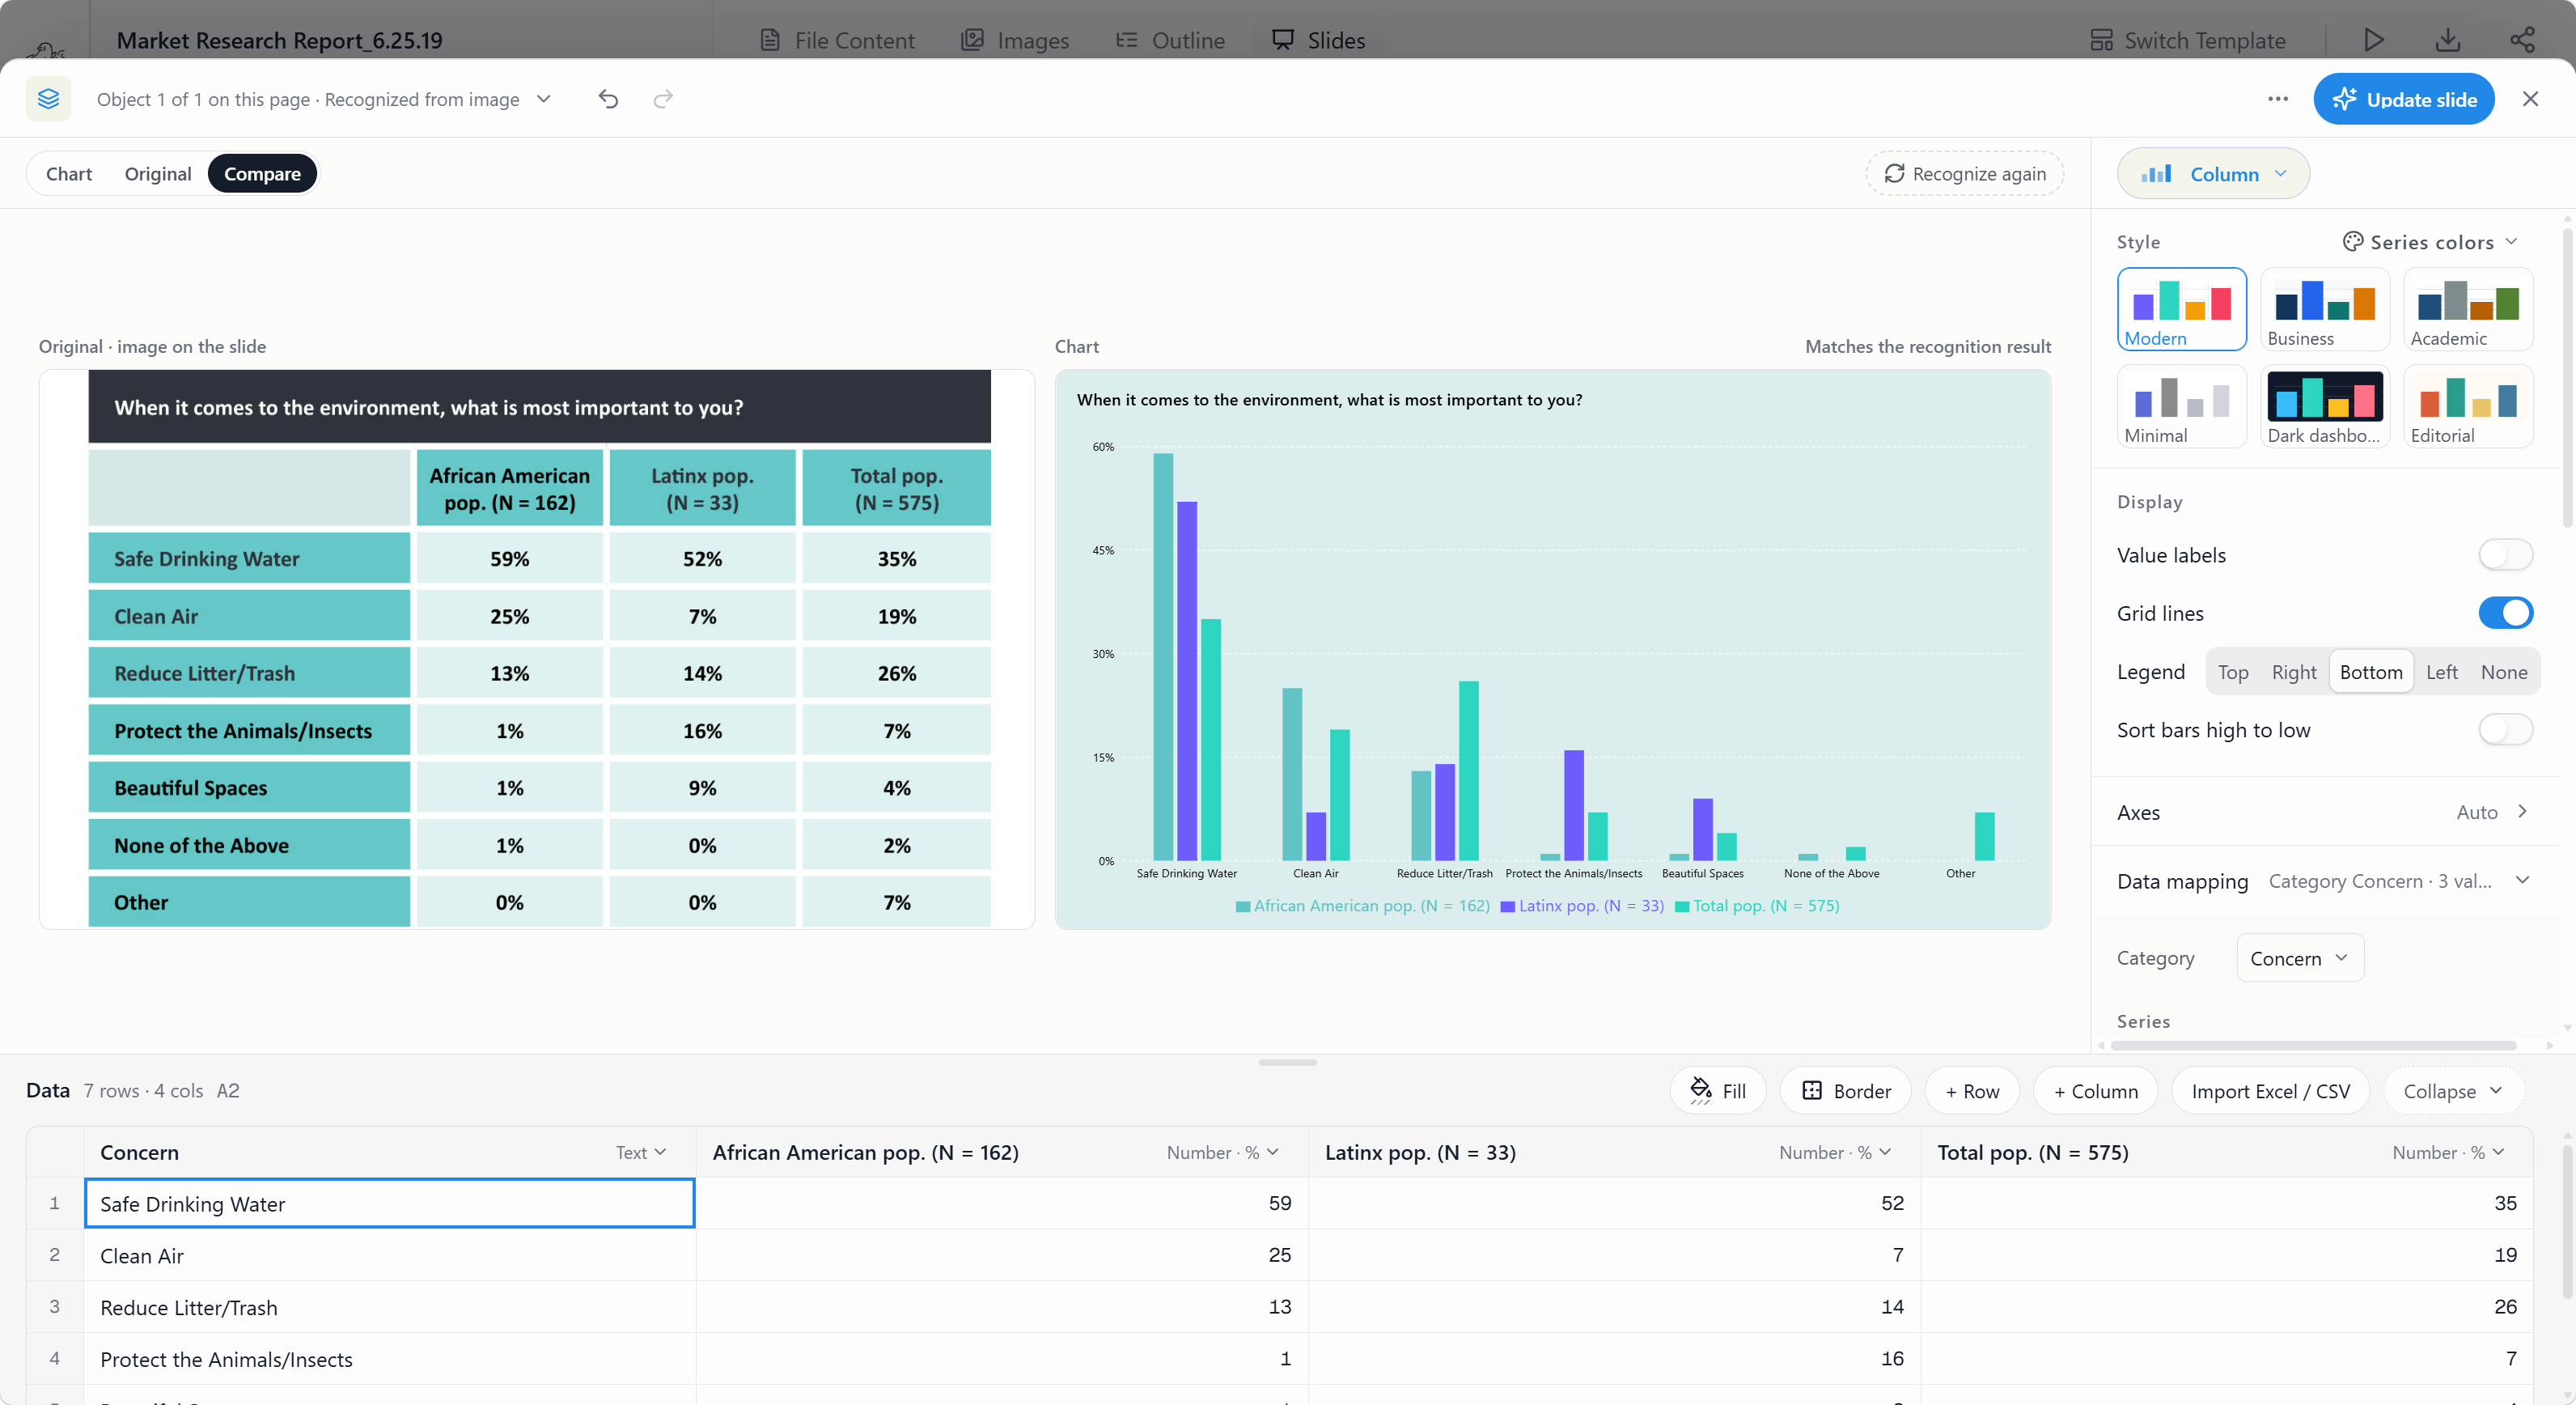
For an RFM deck, use column charts to compare segment size or revenue, line charts to track movement over time, scatter plots to examine frequency and value, and heatmaps to show the full score distribution. The analyst still needs to verify customer counts, denominators, currencies, observation dates, and returns against the source.
For a detailed workflow, read AI Think-Cell Alternative: Complete Guide to Editable PowerPoint Charts.
Choose layouts and diagrams before or after rendering
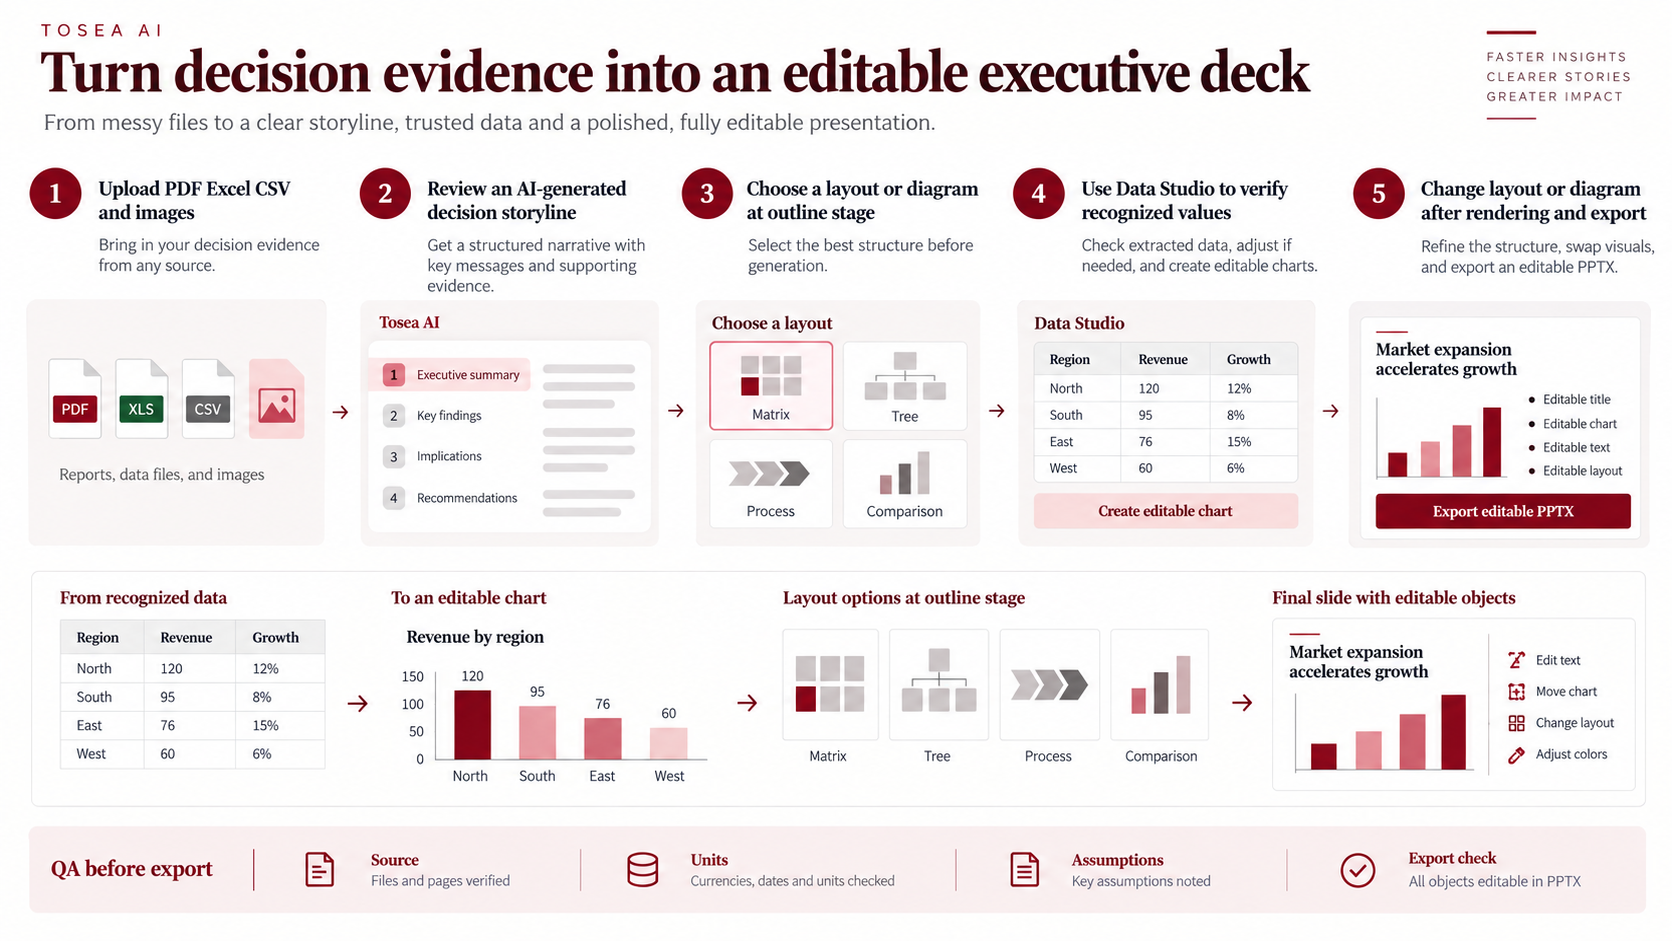
Tosea AI lets you select a layout or diagram during the outline stage. An RFM section can become a three-part definition page, an eight-cell matrix, a segment treatment table, a heatmap, or a before-and-after comparison. This is useful when you know the analytical structure before the slides are rendered.
After rendering, you can continue changing the layout or diagram. Layout Only is designed for visual restructuring without intentionally rewriting approved wording. That makes it practical when the content has passed review but the page still feels crowded.
Quality checklist before exporting the PPTX
- Record the observation date and analysis window.
- Reconcile customer counts and monetary totals with the source.
- Confirm whether monetary value means revenue, margin, or contribution.
- Explain the high-low threshold and any category adjustment.
- Check that every segment code matches its description and its position on the map.
- Attach an action, owner, and success metric to every priority segment.
- Mark slide examples and forecasts as illustrative or estimated.
- Open the exported PPTX in the exact PowerPoint environment used for delivery.
Frequently asked questions
Can Tosea AI redesign my existing PowerPoint without changing the content?
Yes. Export the PowerPoint as a PDF, upload it to Tosea AI, and request a redesign that preserves the original wording. Use Layout Only when you want to refresh the visual structure. Compare the result with the source to confirm every label, number, footnote, and slide element remains complete.
How do I upload a PowerPoint and ask Tosea AI to redesign each slide?
Export the PowerPoint as a PDF and upload the PDF to Tosea AI. Ask for a slide-by-slide redesign that preserves content and sequence. Choose a template or describe the visual direction, generate the presentation, inspect each slide, and then export the revised deck.
Can I upload my own PowerPoint template to Tosea AI?
Tosea AI supports custom templates on eligible paid plans. Configure the template through the available workflow, then verify the required layouts, fonts, colors, logo placement, and master-slide rules before sharing the deck.
Can Tosea AI use custom brand colors, fonts, and a logo?
Yes. Specify the required colors and fonts, then upload a logo or use a supported custom template. Custom branding features are available on eligible plans. After export, check font availability, color values, contrast, and logo clear space in PowerPoint.
Can Tosea AI match the style of my old company presentations?
Tosea AI can use a representative company deck as design guidance, but this does not mean permanent model training. For stronger consistency, use an approved custom template and compare the result with current brand guidelines before distribution.
Does Tosea AI preserve PowerPoint formatting after export?
Tosea AI editable PPTX export is designed to stay close to the generated preview while keeping elements available for editing. Fonts, complex graphics, and the application used to open the file can affect the result. Test the deck in the delivery environment before presenting.
Can I tell AI to edit the layout only and keep the exact wording?
Yes. Layout Only changes visual arrangement without intentionally rewriting the slide content. Use it after stakeholders approve the wording. Compare the new slide with the source to confirm that labels, citations, footnotes, numbers, and line breaks remain correct.
Build the RFM analysis PowerPoint in one workflow
A strong RFM analysis PowerPoint makes the logic auditable. It shows how the three variables were calculated, why the thresholds make sense, which customers need attention, and how the business will measure the result.
With Tosea AI, you can move from transaction files and source reports to an outline, assign layouts and diagrams, turn data into editable charts, refine individual slides, and export an editable PPTX. Keep the calculations visible and use AI to accelerate production, not to invent evidence.
For more consulting presentation patterns, read Best BCG Strategy Consulting PowerPoint Templates, How to Build a BCG-Style Storyline, and The Cognitive Architecture of McKinsey Deck Logic.
Sources
- RFM model customer segmentation from a graph theory perspective — Corrêa Vianna Filho, de Lima, and Kleina, Quality & Quantity, Springer, 2026 (open access)
- Customer segmentation using RFM analysis — TU Delft Repository
- Make your PowerPoint presentations accessible to people with disabilities — Microsoft Support