120 Best Geography Topics for Students, Research, and Classroom Presentations
120 focused geography topics across climate, cities, migration, health, GIS, and remote sensing, plus how to narrow one into a researchable question and build the presentation.
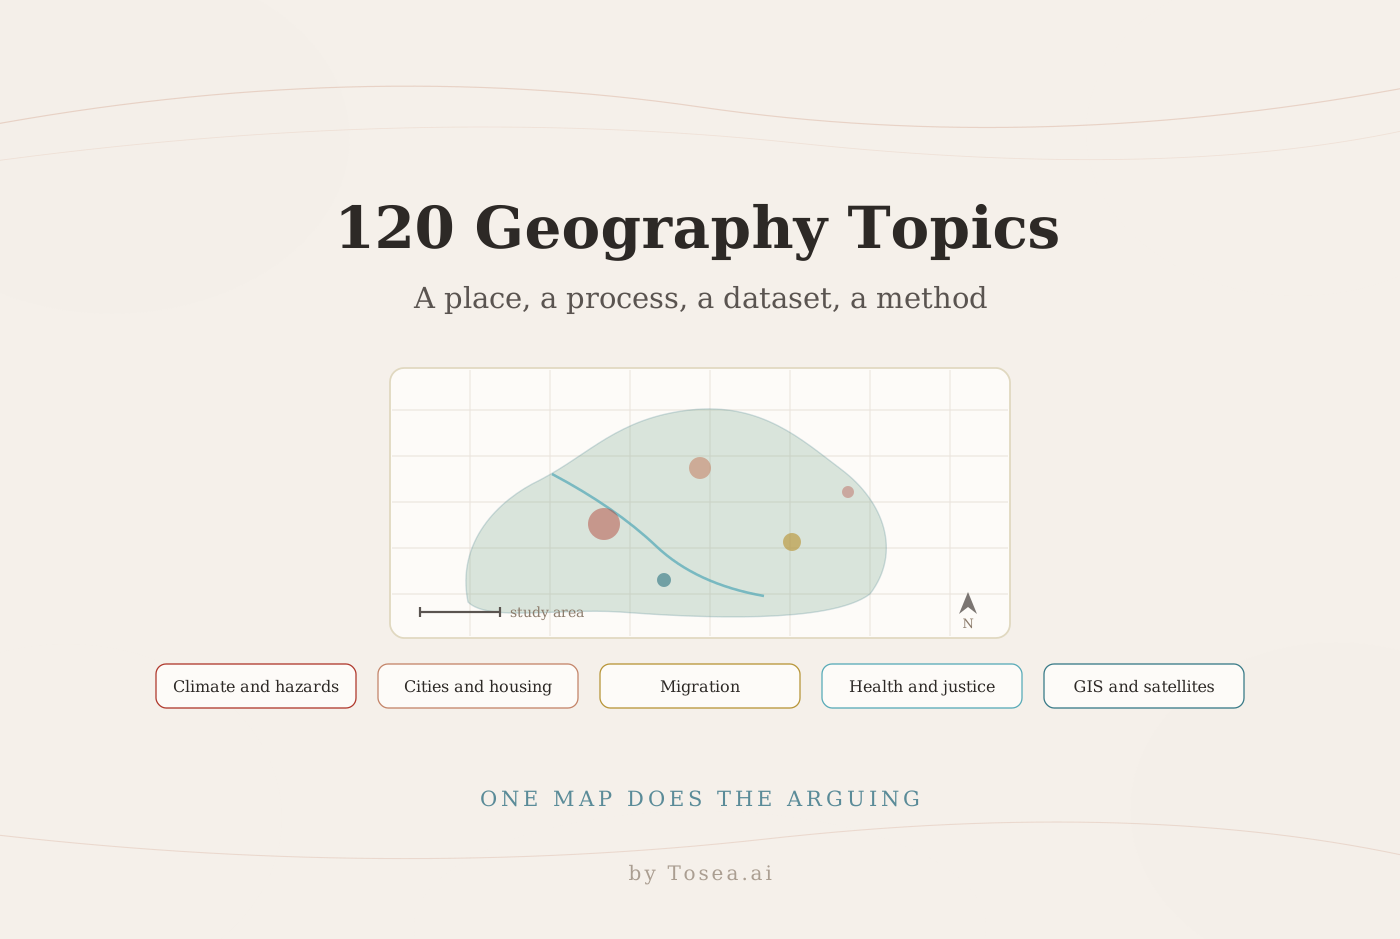
Finding strong geography topics for students is easier when each idea connects a place, a process, a dataset, and a method. This guide offers 120 focused topics for classroom presentations, research papers, thesis proposals, and geography seminars. The list covers physical geography, human geography, GIS, remote sensing, environmental change, cities, migration, health, transport, and political economy.
The categories reflect research areas covered by the Annals of the American Association of Geographers, Transactions of the Institute of British Geographers, Applied Geography, Political Geography, the Journal of Economic Geography, and Transactions in GIS.
What makes a strong geography research topic
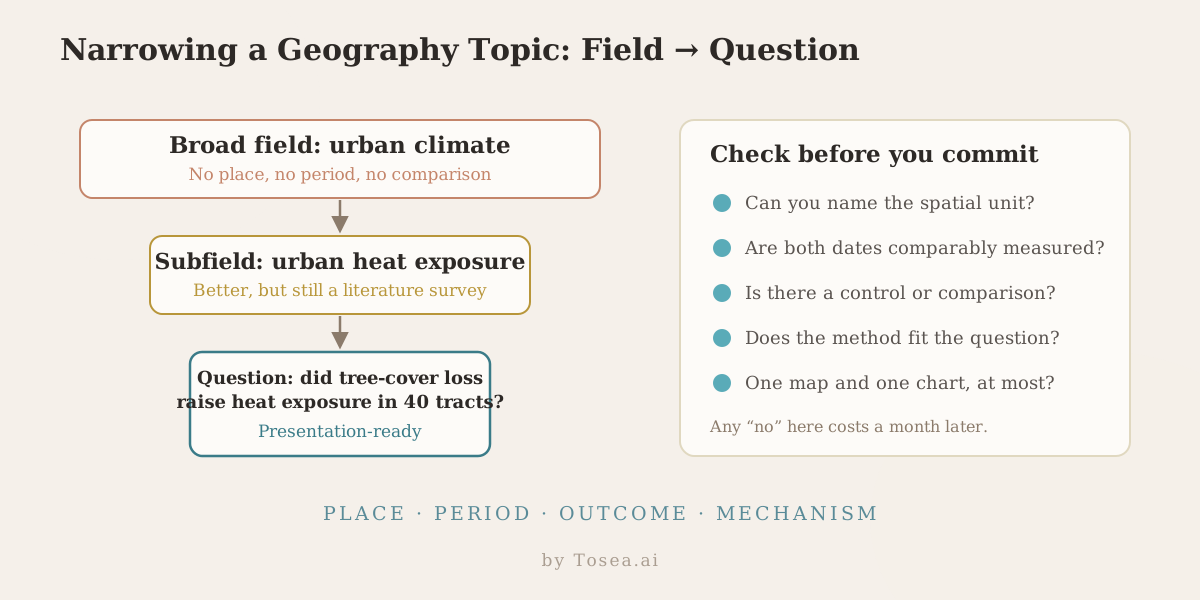
A workable topic has a study area, measurable outcome, plausible mechanism, accessible data, and suitable method. Replace "urban climate" with a testable question about whether tree-cover loss increased summer heat exposure in selected census tracts.
Before choosing, check five things:
- Can you name the spatial unit and study period?
- Is the outcome measurable with available data?
- Can you compare places, groups, or time periods?
- Does the method answer the question rather than decorate it?
- Can the result be explained with one map and one chart?
The four constraints that actually decide feasibility
Most abandoned geography projects fail for the same handful of reasons, and all four are visible before any work starts.
Spatial resolution. The unit you can get data for is rarely the unit your question is about. Health outcomes are released at district level; the mechanism you care about operates at street level. Either reframe the question to the available unit or find a proxy — and say which you did.
Temporal coverage. A "change over time" question needs at least two comparable observations, measured the same way. Administrative boundaries get redrawn, survey questions get reworded, and satellite sensors get replaced. Check that your two endpoints are genuinely comparable before committing.
Access and permission. Fieldwork, interviews, and any individual-level mobility or health data usually require ethics approval, and approval takes weeks. Build that into the timeline or choose a topic that runs on open data.
A control or comparison. A single case study describes; it does not test. Decide early what the comparison is — another neighborhood, an earlier period, a similar city that did not get the intervention — because retrofitting a comparison later is the most common cause of a rushed final month.
Climate change and natural hazards topics
Hazard geography rewards questions that pair an exposure layer with a social outcome. The interesting finding is rarely "where the hazard is" — that is usually already mapped — but who is exposed, who can move, and who absorbs the cost.
- Urban heat inequality using Landsat and census income data
- Flood exposure after wetland loss in a river basin
- Wildfire evacuation access across rural mountain communities
- Climate migration intentions after repeated coastal flooding
- Heatwave mortality and neighborhood tree-canopy coverage
- Drought impacts on smallholder crop switching
- Sea-level rise threats to schools and hospitals
- Compound flood risk from rainfall and storm surge
- Climate adaptation spending across vulnerable municipalities
- Insurance retreat from high-risk coastal housing markets
Geomorphology and cryosphere topics
These topics need a clear process claim and a way to observe change. Repeat imagery, historical maps, and digital elevation models make most of them tractable without fieldwork.
- Glacier retreat and downstream seasonal water availability
- Permafrost thaw impacts on Arctic road stability
- Shoreline change after coastal engineering projects
- Landslide susceptibility using terrain and rainfall indicators
- River-channel migration around expanding settlements
- Sand-dune mobility under changing wind regimes
- Soil erosion after wildfire and extreme rainfall
- Delta subsidence from groundwater extraction
- Mountain trail degradation under tourism pressure
- Sediment delivery changes below major dams
Hydrology and water geography topics
Water topics work well when the question spans a boundary — upstream and downstream, formal and informal supply, or two jurisdictions sharing a source. That boundary is usually where the data and the politics both get interesting.
- Groundwater depletion and agricultural intensification
- Drinking-water inequality across urban service zones
- River restoration effects on neighborhood flood risk
- Reservoir expansion and displaced rural livelihoods
- Seasonal water quality near informal settlements
- Irrigation efficiency and downstream water scarcity
- Rainwater harvesting suitability using multicriteria GIS
- Transboundary river cooperation during drought
- Stream-temperature change after riparian forest loss
- Water-access time burdens by gender and settlement type
Biogeography and conservation topics
Conservation questions are strongest when they test effectiveness rather than describe distribution. Matched comparisons — protected versus similar unprotected land — turn a map into an argument.
- Habitat fragmentation and pollinator connectivity
- Protected-area effectiveness using matched land-cover change
- Species range shifts along elevation gradients
- Road construction and forest-edge expansion
- Urban green corridors and bird diversity
- Mangrove recovery after community-based restoration
- Invasive species spread through transport networks
- Fire-regime change and savanna vegetation structure
- Conservation conflict around large carnivore habitats
- Biodiversity exposure to future renewable-energy sites
Urban geography and planning topics
Urban topics have the best open-data coverage of any category, which makes them popular — and makes originality depend on the comparison you choose rather than the dataset you find.
- Fifteen-minute city access across income groups
- Transit-oriented development and residential displacement
- Vacant land conversion and neighborhood heat reduction
- Short-term rentals and long-term housing availability
- Informal settlement growth near hazard-prone land
- School accessibility under rapid suburban expansion
- Nighttime economies and gendered safety perceptions
- Green gentrification around new urban parks
- Office vacancy and downtown land-use transition
- Building-height regulation and housing supply
Population, migration, and social geography topics
Migration questions need a stated push or pull mechanism. Without one, the analysis describes a flow that everyone already knew existed.
- Internal migration responses to regional wage shocks
- Refugee access to jobs through public transport
- Aging populations and rural service accessibility
- Student mobility and university-town housing pressure
- Return migration after climate-related displacement
- Digital connectivity and remote-work migration
- Spatial segregation across school catchment boundaries
- Language landscapes in multilingual neighborhoods
- Care-work travel patterns among low-income households
- Population decline and public-service consolidation
Economic and development geography topics
These topics hinge on a spillover claim: something located somewhere changed outcomes nearby. Define the distance band you expect the effect within, before you measure it.
- Logistics hubs and regional employment restructuring
- Industrial parks and nearby land-price change
- Digital-platform work across urban labor markets
- Border closures and cross-border retail economies
- Green investment clusters and regional inequality
- University research and local startup formation
- Port expansion and manufacturing location decisions
- Tourism dependence and recovery after external shocks
- Special economic zones and local wage spillovers
- Food supply chains and rural market accessibility
Political geography and geopolitics topics
Political geography topics need care with sources and framing. Use primary documents — boundary orders, treaty texts, procurement records — rather than commentary, and state where accounts conflict.
- Electoral boundary changes and representation inequality
- Border infrastructure and everyday cross-border mobility
- Water scarcity and subnational political conflict
- Critical-mineral extraction and Indigenous territorial rights
- Digital surveillance and the geography of public space
- Infrastructure corridors and competing territorial claims
- Refugee camps as spaces of temporary governance
- Climate adaptation and uneven municipal power
- Sanctions and rerouted international trade networks
- Election misinformation across regional media markets
Health geography and environmental justice topics
Environmental justice questions require an exposure measure and a population measure at a compatible unit. Getting those two to line up is usually the hardest part of the project, so check it first.
- Primary-care deserts and preventable hospital admissions
- Air-pollution exposure around freight corridors
- Food accessibility and diabetes risk by neighborhood
- Maternal-health travel times in remote regions
- Urban noise exposure and school performance
- Cooling-center accessibility during extreme heat
- Industrial contamination and property-value inequality
- Mental-health access after natural disasters
- Walkability and physical activity among older adults
- Waste-facility siting and environmental justice
Transport, mobility, and tourism topics
Accessibility questions depend on how travel time is computed. Say whether you used straight-line distance, a road network, or a timetabled transit routing, because the three give very different answers.
- Bus-network redesign and job accessibility
- Cycling infrastructure and injury-risk distribution
- High-speed rail and secondary-city development
- Airport expansion and neighborhood noise burdens
- Electric-vehicle charging access across rural regions
- Tourist crowding and resident mobility in historic centers
- Last-mile delivery and curb-space competition
- Gender differences in nighttime travel behavior
- Ferry reliability and island service accessibility
- Mobility changes after congestion pricing
GIS and spatial-analysis topics
These are methods topics, which means the contribution is the demonstration itself. Pick a method problem you can show clearly with a small, well-documented case rather than a large messy one.
- Spatial bias in volunteered geographic information
- Modifiable areal unit effects in health mapping
- Explainable machine learning for flood susceptibility
- Location privacy in mobile mobility datasets
- Spatial accessibility with variable travel-time networks
- Participatory GIS for community hazard planning
- Uncertainty propagation in multicriteria suitability models
- Geocoding error and neighborhood-effect estimates
- OpenStreetMap completeness across urban and rural areas
- Reproducible GIS workflows for local policy analysis
Remote sensing and Earth observation topics
Satellite topics are feasible on a student timeline when the processing is done in a cloud platform rather than locally. Cloud cover, sensor changes, and revisit intervals are the constraints that decide the study period.
- Crop-stress detection with multispectral time series
- Urban expansion using Sentinel land-cover classification
- Methane-emission monitoring from satellite observations
- Forest degradation before visible deforestation
- Coastal water quality from ocean-color imagery
- Building-damage assessment after earthquakes
- Snow-cover duration across mountain elevation zones
- Nighttime lights as a proxy for recovery
- Surface-mining expansion and landscape restoration
- Satellite-data bias under persistent cloud cover
Where to find the data for each category
| Topic category | Typical data sources | The constraint to check first |
|---|---|---|
| Climate and hazards | National meteorological services, Copernicus, NASA Earthdata, municipal adaptation plans | Whether the hazard layer and the population layer share a unit |
| Geomorphology and cryosphere | Digital elevation models, historical topographic maps, repeat aerial and satellite imagery | Whether two imagery dates are radiometrically comparable |
| Hydrology | National gauge networks, reservoir operator records, utility service-area maps | Gauge gaps and upstream abstraction that is not recorded |
| Conservation | Protected-area registries, land-cover time series, species occurrence databases | Sampling bias in occurrence records |
| Urban and transport | City open-data portals, OpenStreetMap, GTFS transit feeds, cadastral records | Whether the road or transit network is current for your study year |
| Migration and social | Census microdata, household surveys, administrative registers | Boundary changes between census rounds |
| Economic | Business registers, trade statistics, land-price series, firm-location data | Disclosure suppression in small areas |
| Political | Boundary orders, electoral commission results, treaty texts, procurement records | Contested accounts; cite the primary document |
| Health | Health-authority statistics, air-quality monitors, facility registries | Small-area privacy suppression |
| GIS and remote sensing | Copernicus, USGS, cloud geospatial platforms, national spatial data infrastructures | Licensing terms for redistribution in a public presentation |
Always record the resolution, date, missing-value rate, licence, and coordinate system for every layer you download. That record becomes the data slide later, and reconstructing it from memory at the end of a project never goes well.
How to turn one topic into a researchable question
Use this reusable prompt to narrow any idea without letting AI invent evidence:
Act as a geography research supervisor. Turn the selected topic into three feasible research questions for an undergraduate paper, a masters thesis, and a 12-minute classroom presentation. For each version, specify the study area, spatial unit, time period, dependent variable, proposed mechanism, accessible datasets, method, one map, one chart, limitations, and five search terms. Do not invent findings or citations.
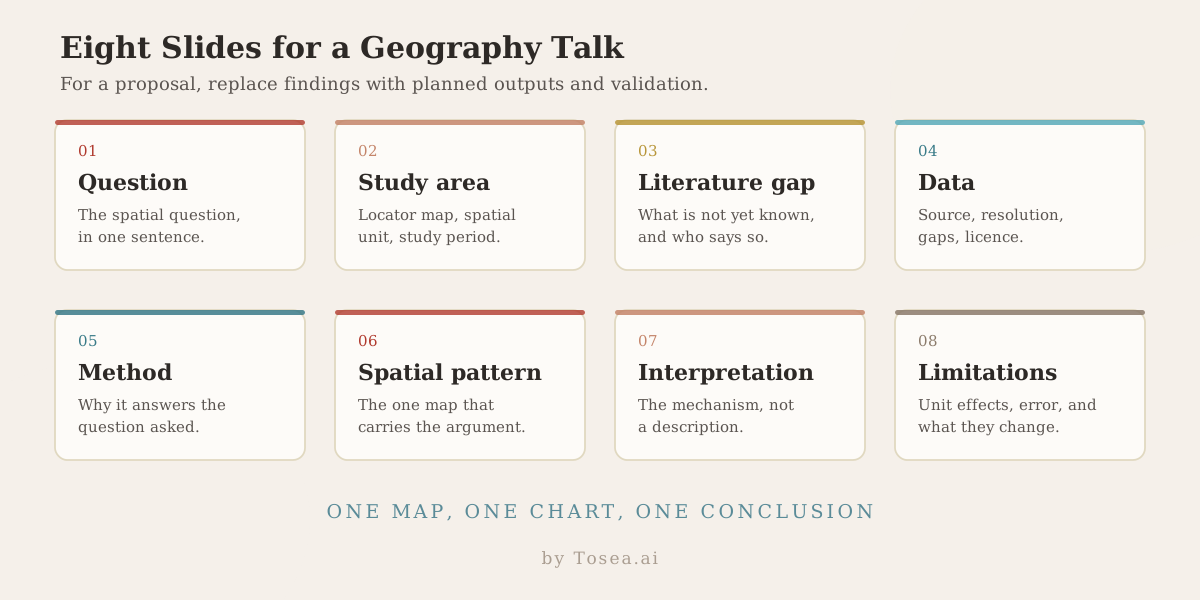
A useful eight-slide sequence covers the question, study area, literature gap, data, method, spatial pattern, interpretation, and limitations. For a proposal, replace findings with planned outputs and validation.
What separates a strong geography presentation from a weak one
One map does the arguing. Most geography talks carry too many maps and no argument. Choose the single map that shows the pattern your conclusion depends on, give it the largest slide, and move the rest to an appendix.
Cartography counts as evidence. A projection that distorts area, a class-break scheme chosen for visual effect, or a missing scale bar all undermine the claim you are making. Say which classification you used and why — quantile, natural breaks, or equal interval produce very different maps from identical data.
The limitations slide is not an apology. State the modifiable areal unit problem, the geocoding error, or the sensor gap plainly, and explain what it does and does not change about the conclusion. Examiners read a specific limitations slide as evidence of competence and a vague one as evidence of the opposite.
Place names deserve the same care as numbers. Spelling, official versus colloquial names, and contested naming are all checkable before the talk, and getting one wrong distracts an audience for the rest of the session.
Build the presentation with Tosea AI one-click layout
Once the evidence is ready, Tosea AI can turn a paper, report, or outline into a presentation draft. At the outline stage, choose the layout or diagram that fits each claim, such as a locator map, timeline, comparison, or process diagram.
After rendering, you can still change layouts and diagrams. Use Layout Only when the wording is approved. Before export, check projections, legends, scale bars, units, place names, accessibility, captions, and citations.
For a step-by-step version of the same workflow applied to an academic manuscript, see how to turn a research paper into a presentation and the research paper to slides workflow.
Frequently asked questions
What is a good geography topic for a classroom presentation?
Choose a question with a visible spatial pattern and accessible evidence. Narrow it to one place, period, comparison, and measurable outcome that can be explained with a map.
How can I find data for a geography research project?
Start with official statistics, city open-data portals, NASA Earthdata, USGS, Copernicus, OpenStreetMap, and research repositories. Check resolution, dates, missing values, licensing, uncertainty, and geographic units.
How narrow should an undergraduate geography topic be?
Narrow enough that you can name the spatial unit, the study period, and the comparison in a single sentence. "Flooding in Southeast Asia" is a course, not a project. "Whether flood exposure rose in three districts after upstream wetland conversion between 2015 and 2025" is a project.
Do I need GIS software to do a geography project?
Not always. Many of the urban, migration, and economic topics above can be answered with tabulated data and one reference map. Where a project does need spatial analysis, open-source and browser-based tools cover most student requirements without a paid licence.
Can Tosea AI redesign my existing PowerPoint without changing the content?
Yes. Export the PowerPoint as a PDF, upload it, and request a redesign that keeps the wording. Use Layout Only for visual changes. Check labels, place names, footnotes, citations, legends, and slide elements.
How do I upload a PowerPoint and ask Tosea AI to redesign each slide?
Export the PowerPoint as a PDF and upload it. Ask Tosea AI to redesign each slide while preserving content and sequence. Choose a template, generate the deck, inspect every map and chart, then export.
Can I upload my own PowerPoint template to Tosea AI?
Eligible paid plans support custom templates. Apply the template, then check layouts, fonts, colors, logo placement, map frames, and master-slide rules before sharing.
Can Tosea AI use custom brand colors, fonts, and a logo?
Yes. Specify colors and fonts, then upload the logo or use a supported template. Eligible plans include custom branding features. Verify font availability, colors, clear space, contrast, and map readability after export.
Can Tosea AI match the style of my old company presentations?
Tosea AI can use a representative deck as design guidance, without implying permanent model training. For consistency, use an approved template and compare the result with current brand guidelines.
Does Tosea AI preserve PowerPoint formatting after export?
Editable PPTX export aims to stay close to the preview while preserving editability. Fonts, complex graphics, maps, and software can affect results. Test the file in the delivery environment.
Can I tell AI to edit the layout only and keep the exact wording?
Yes. Layout Only changes visual structure without intentionally rewriting content. Compare the result with the source and verify labels, citations, footnotes, numbers, units, legends, and place names.
Turn geography research into a presentation people can follow
The best geography topics for students connect a spatial question to evidence that can be mapped, compared, and explained. Pick one topic, narrow the place and period, verify the data, then build the story around the result rather than the software.
Tosea AI helps students, researchers, and educators move from source material to a structured, editable presentation. For the next step, read how to turn a research paper into a presentation, the research paper to slides workflow, 155 best computer science topics, and 100 best economics topics.
Editorial note
These topics summarize active directions across geography and related spatial sciences. They are research prompts, not claims that a listed result already exists. Journal scope pages informed the categories, while every final question, dataset, method, ethical requirement, and citation should be checked against the selected study area and institution.
Sources
- Annals of the American Association of Geographers — American Association of Geographers
- Transactions of the Institute of British Geographers — Royal Geographical Society with IBG
- Applied Geography — Elsevier
- Political Geography — Elsevier
- Journal of Economic Geography — Oxford University Press
- Transactions in GIS — Wiley