How to Create an Aesthetic Academic Conference PPT with AI: Prompts, Layouts, and Checks
Design an aesthetic academic conference PPT with AI: a timed research story, a restrained visual system, six copy-ready prompts, and a final review that catches redrawn-figure errors.
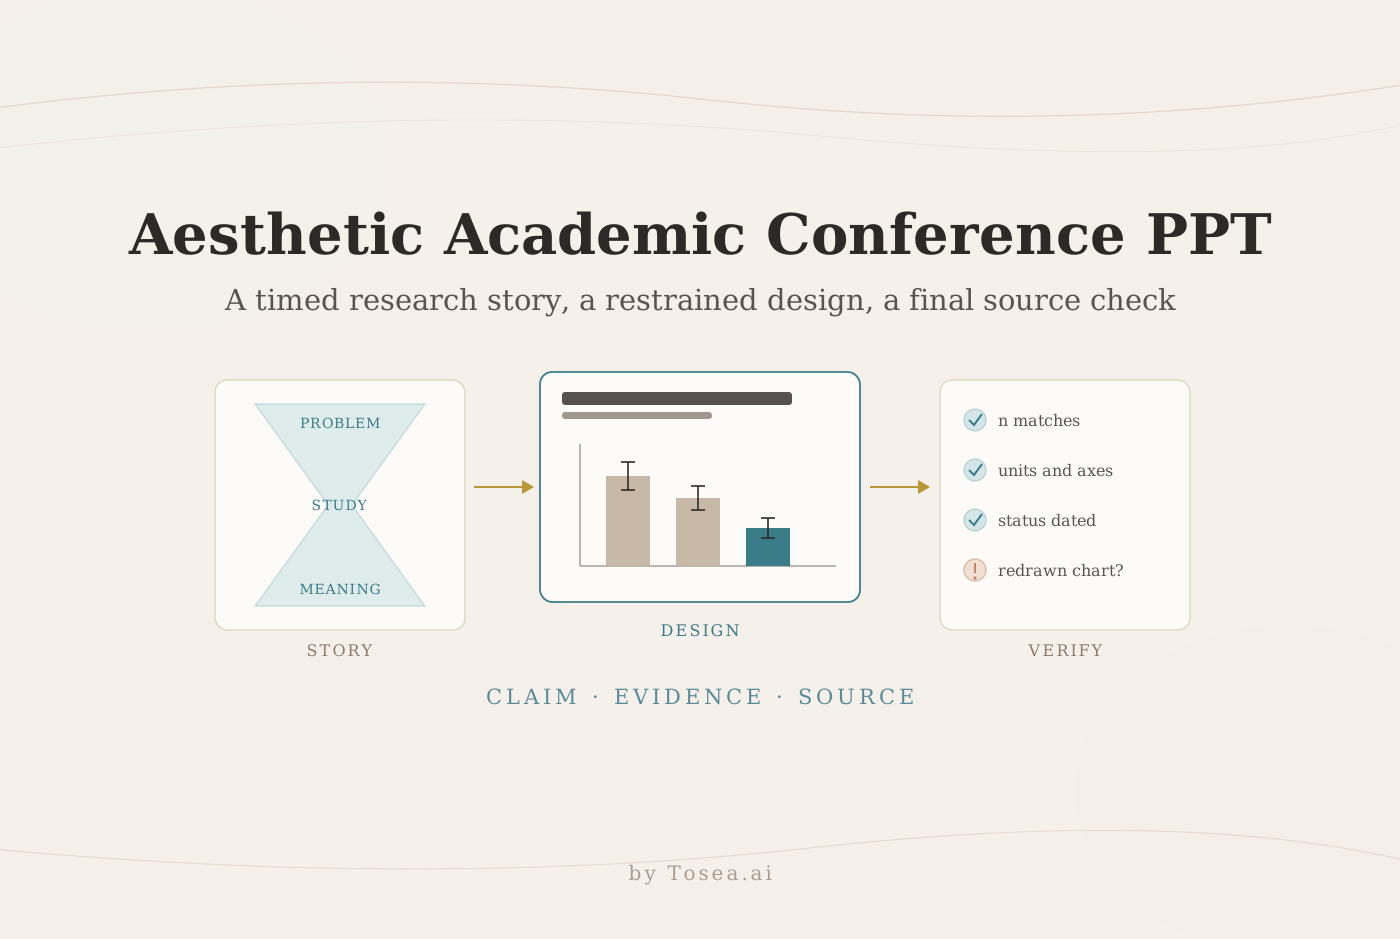
An aesthetic academic conference PPT with AI should make your research easier to understand and examine. For researchers preparing a symposium, clinical research meeting, or interdisciplinary conference, Tosea AI brings source documents, presentation outlines, templates, charts, and layout editing into one workflow. This guide explains how to turn a dense paper into a focused talk, gives you copy-ready prompts, and uses an eight-slide AI-generated example deck to show which design choices work and which errors a final review must catch.
Quick answer: Upload your approved paper, figures, and conference requirements. Ask AI for a timed outline with one supported message per slide. Select a restrained template, preserve scientific figures and uncertainty, then review the generated slides against the original sources before exporting and rehearsing.
Contents
- About the example deck
- Define the research story
- Build a consistent visual system
- Use prompts for specific conference slides
- Build the presentation in Tosea AI
- Check the deck before presenting
- Frequently asked questions
About the example deck
The slides shown in this guide come from an eight-slide deck generated with AI from the March 2026 corporate presentation of INOVIO Pharmaceuticals, a clinical-stage biotech company. It is an investor deck, not an academic talk. We use it because it contains the slide types a clinical research talk also needs: agenda, platform, background, trial design, results, mechanism, and discussion. It also contains mistakes that a careful presenter has to catch, which we document in the final section.
Read the images as layout references only. They are not a summary of INOVIO's data, and Tosea has no affiliation with INOVIO. Where a slide's content differs from INOVIO's own published information, the caption says so.
Define the research story
Start with the audience, time limit, and claim the evidence supports. Explain unfamiliar measurements before interpreting results.
The MIT Mechanical Engineering Communication Lab recommends identifying your message and goals as a presenter first, then using them to organize the talk. The MIT AeroAstro Communication Lab's hourglass structure gives that organization a shape: begin with the broader problem, narrow to your work, then widen again to what the results mean. That structure is useful when a paper contains more experiments than a conference slot can accommodate.
For a 15-minute slot including questions, start here and refine through rehearsal.
| Section | Speaking time | Slide purpose |
|---|---|---|
| Opening and research gap | 2 minutes | Establish relevance and the unanswered question |
| Study design | 2 minutes | Explain the comparison and measurement |
| Main findings | 5 minutes | Present two or three supported results |
| Interpretation and limitations | 2 minutes | State what the findings establish and leave unresolved |
| Closing message | 1 minute | Return to the question and identify the next step |
| Discussion | 3 minutes | Answer questions using backup slides |
Slide counts and timing vary by field. Our 15-minute conference talk guide covers slide budgets by discipline, the methodology trap, and Q&A tactics in more depth.
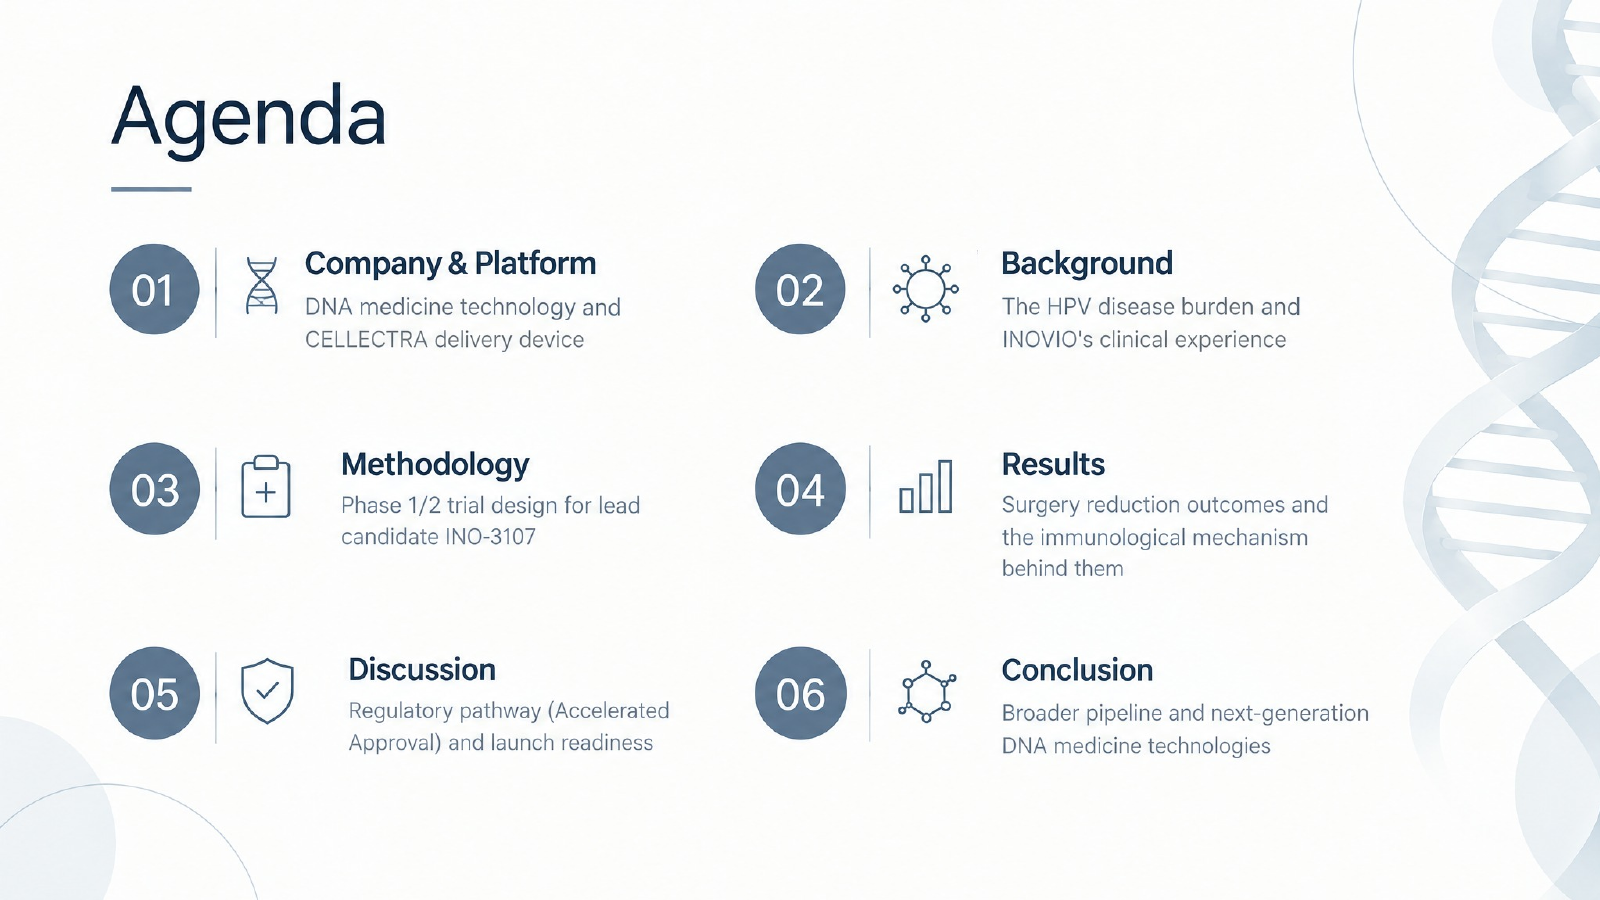
Example deck, slide 2: a six-section agenda built from numbered circles, icons, and two-line descriptions. For an academic talk, the same grid works with research question, methods, results, interpretation, limitations, and next steps.
Build a consistent visual system
In academic slides, aesthetic design comes from readable hierarchy, alignment, and deliberate use of space. Use one background system, consistent margins, and a small palette. A white background with dark navy text and a muted blue accent is a practical starting point for biomedical content.

Example deck, slide 1. The cover identifies the deck as a corporate presentation; the layout, not the content, is the reference here.
Make the title carry the message
A title such as Results tells the audience where they are. A sentence describing the observed result tells them what to examine. Keep that sentence within the limits of the evidence: an association does not establish causation, and a laboratory mechanism does not establish clinical benefit.
The Broad Institute Communication Lab slideshow guide recommends that each slide convey a single point, that visuals carry more weight than text, and that each figure be as simple as possible while still conveying its message. In practice, that means adapting publication figures for oral presentation: enlarge the relevant panel, explain the axes, and remove unrelated detail while preserving the information needed to interpret the finding.
Borrow layout, then adapt the content
The example cover places the heading on the left and a large DNA illustration on the right. That creates a clear reading order. For an academic talk, replace company metadata with the study title, authors, affiliations, conference, and required disclosures. Keep decorative molecular artwork away from results plots so it does not compete with the evidence.
Visual system at a glance
| Element | Starting setting | Why |
|---|---|---|
| Slide titles | 32 to 40 pt, one or two lines | Readable from the back of a room; a full sentence still fits |
| Body text | 24 to 28 pt | Keeps text short by forcing you to cut |
| Figure labels and axes | 18 pt or larger after scaling | Publication figures shrink on a projector |
| Palette | One text color, one accent, one highlight | The highlight can then mean "look here" |
| Data colors | A colorblind-safe set, never red versus green alone | Roughly 1 in 12 men has a color vision deficiency |
| Header style | One style for every content slide | Switching styles reads as switching sections |
These are starting settings, not universal conference rules. Contrast, screen size, and figure complexity also affect readability, so test the smallest labels from the back of the room. Microsoft accessibility guidance recommends 18-point or larger text, unique slide titles, a checked reading order, and alternative text. For data colors, Bang Wong's Points of View column on color blindness in Nature Methods gives a widely used colorblind-safe palette.
Use prompts for specific conference slides
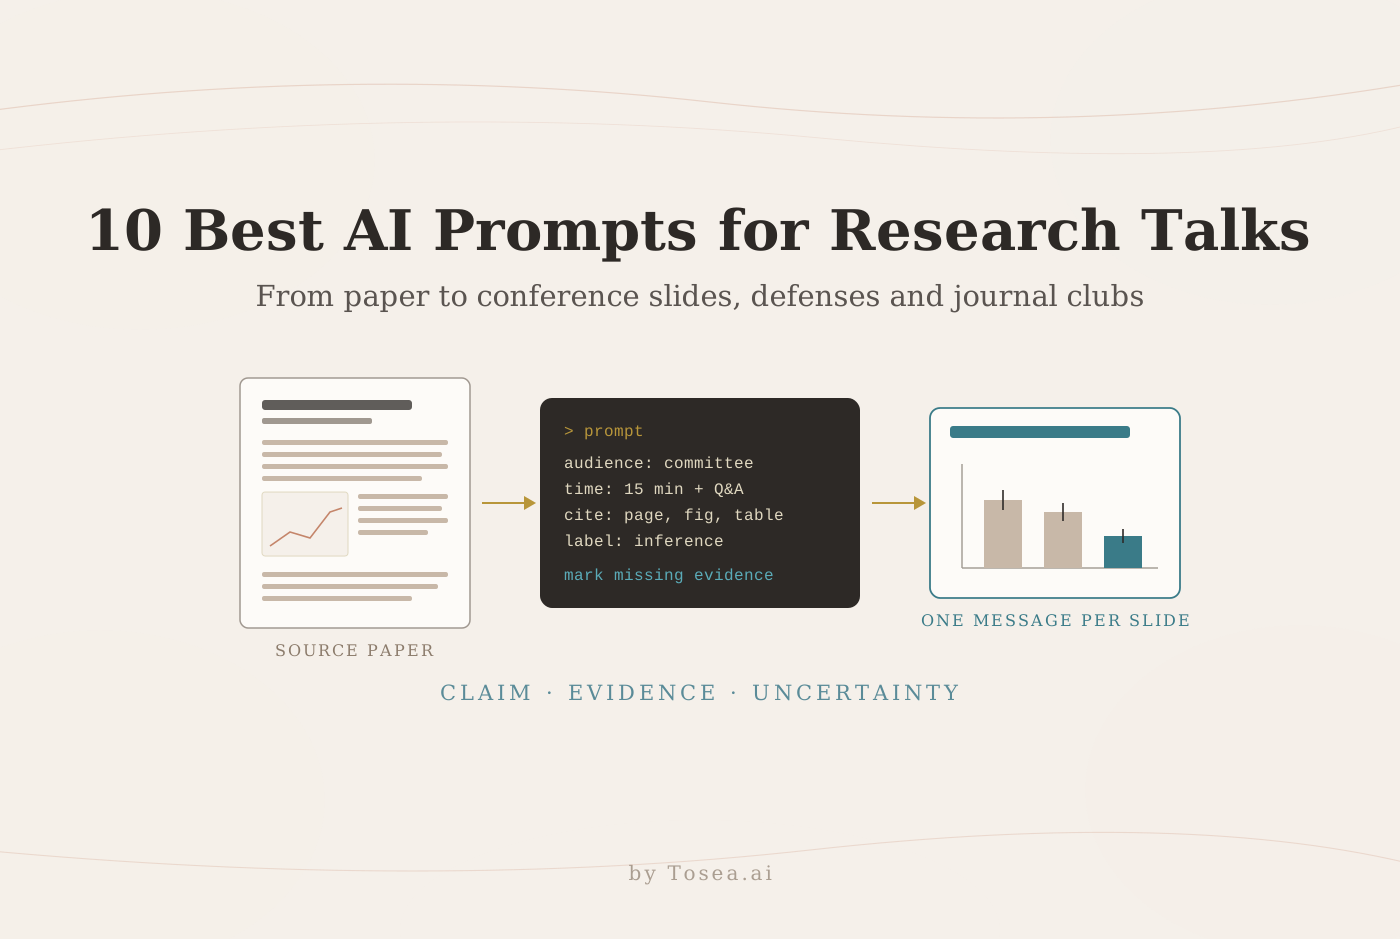
Supply the complete paper and approved figures. Replace bracketed fields before using these prompts. For more field-specific variants, see our 8 prompts for academic presentation slides.
1. The complete academic conference outline
Create an aesthetic academic conference PPT outline from the uploaded paper, supplementary material, and approved figures.
Audience: [discipline and familiarity].
Session: 15 minutes total, including 3 minutes of questions.
Central question: [research question].
Target: 9 to 11 main slides plus backup slides.
For each slide provide a message title, evidence, source page or figure, recommended layout, speaker notes, and estimated time.
Separate findings reported by the authors, established background, interpretation, and unresolved questions.
Preserve sample sizes, endpoints, units, uncertainty, and study limitations. Mark missing information as source required. Do not invent results or references.
2. A research-gap opening
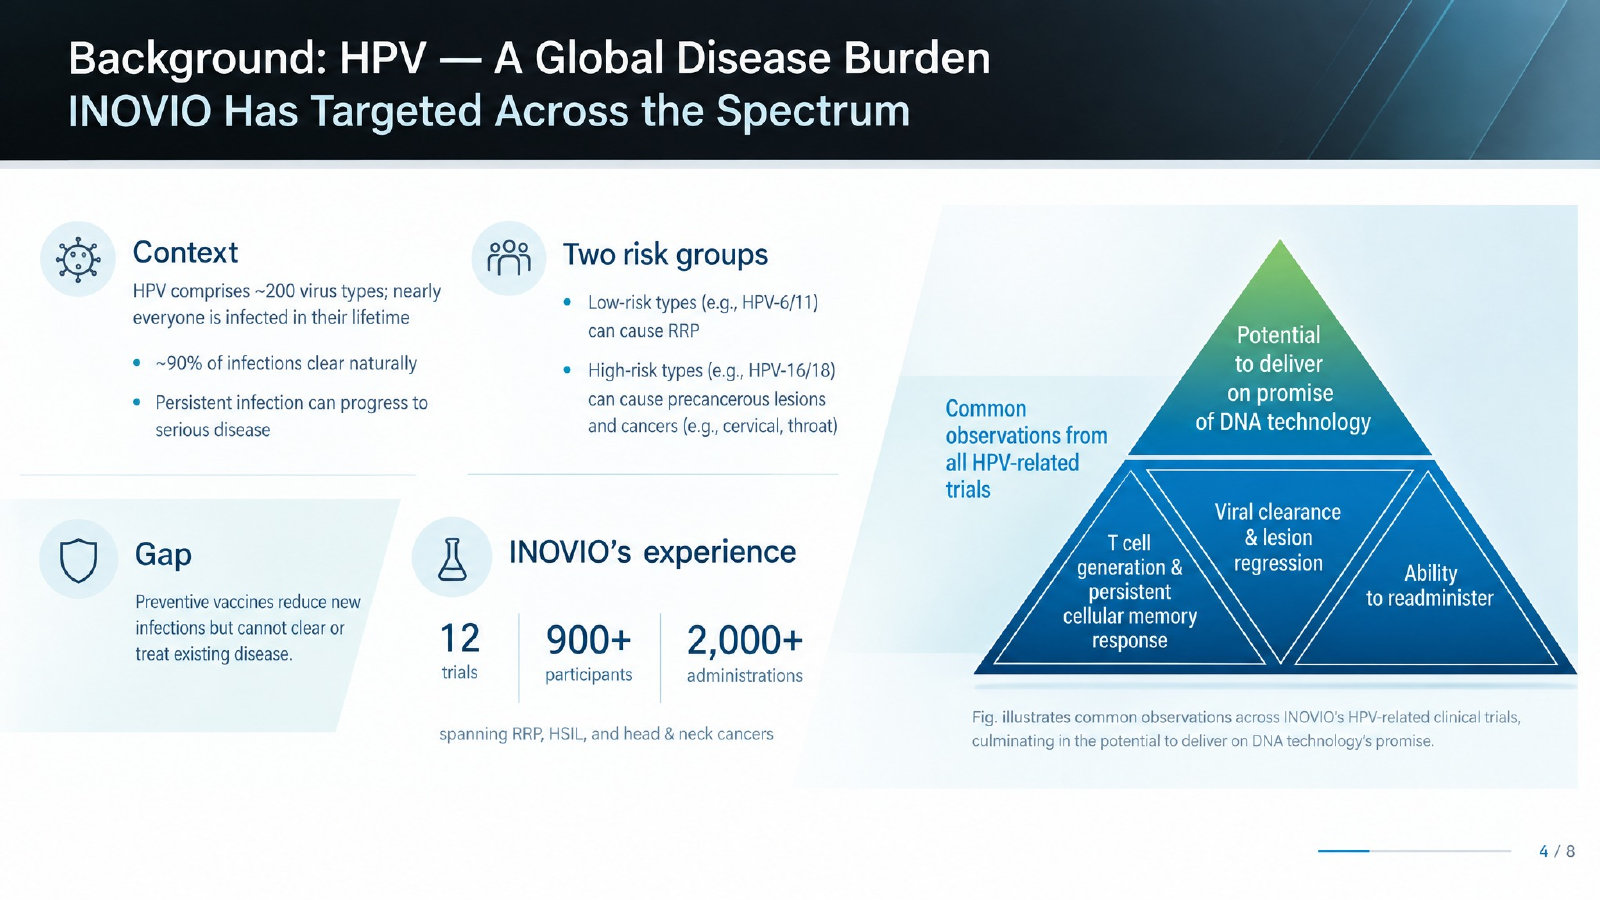
Example deck, slide 4: context, gap, and supporting evidence arranged in four labeled blocks beside one summary visual.
Using the supplied references, create two opening slides for [audience].
Slide 1: explain the practical or scientific problem.
Slide 2: compare established knowledge with the specific unresolved question this study addresses.
Attach a source to each background claim. Preserve disagreements between studies. End with the study objective, using no stronger novelty claim than the sources support.
3. A method or mechanism slide
The example platform slide pairs text with a biological process to explain the sequence before presenting measurements.
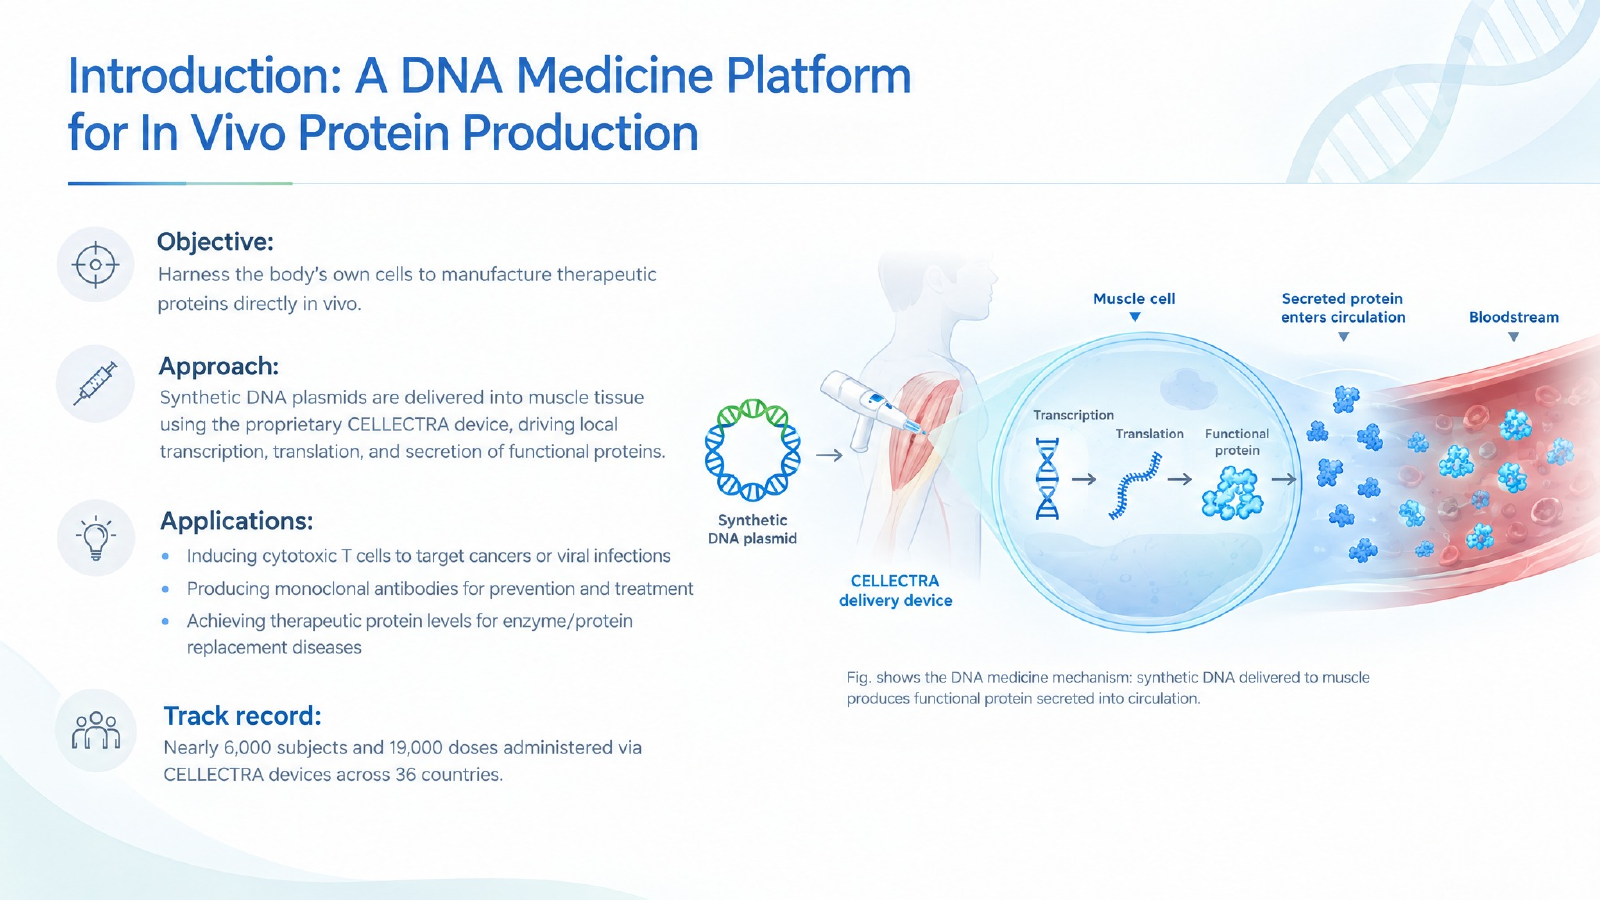
Example deck, slide 3. The arrangement shows how a labeled process can complement text. Verify any mechanism or product-specific statement against primary sources before reuse.
Turn the approved method into a labeled Input, Processing, Output diagram.
Show the study population or material, intervention or procedure, comparator, measurement, and analysis where applicable.
Use arrows only for relationships supported by the source. Label hypothetical links explicitly. Explain each abbreviation at first use.
Keep scientific images intact unless an approved adaptation is supplied. Add a source line and speaker notes for procedural detail.
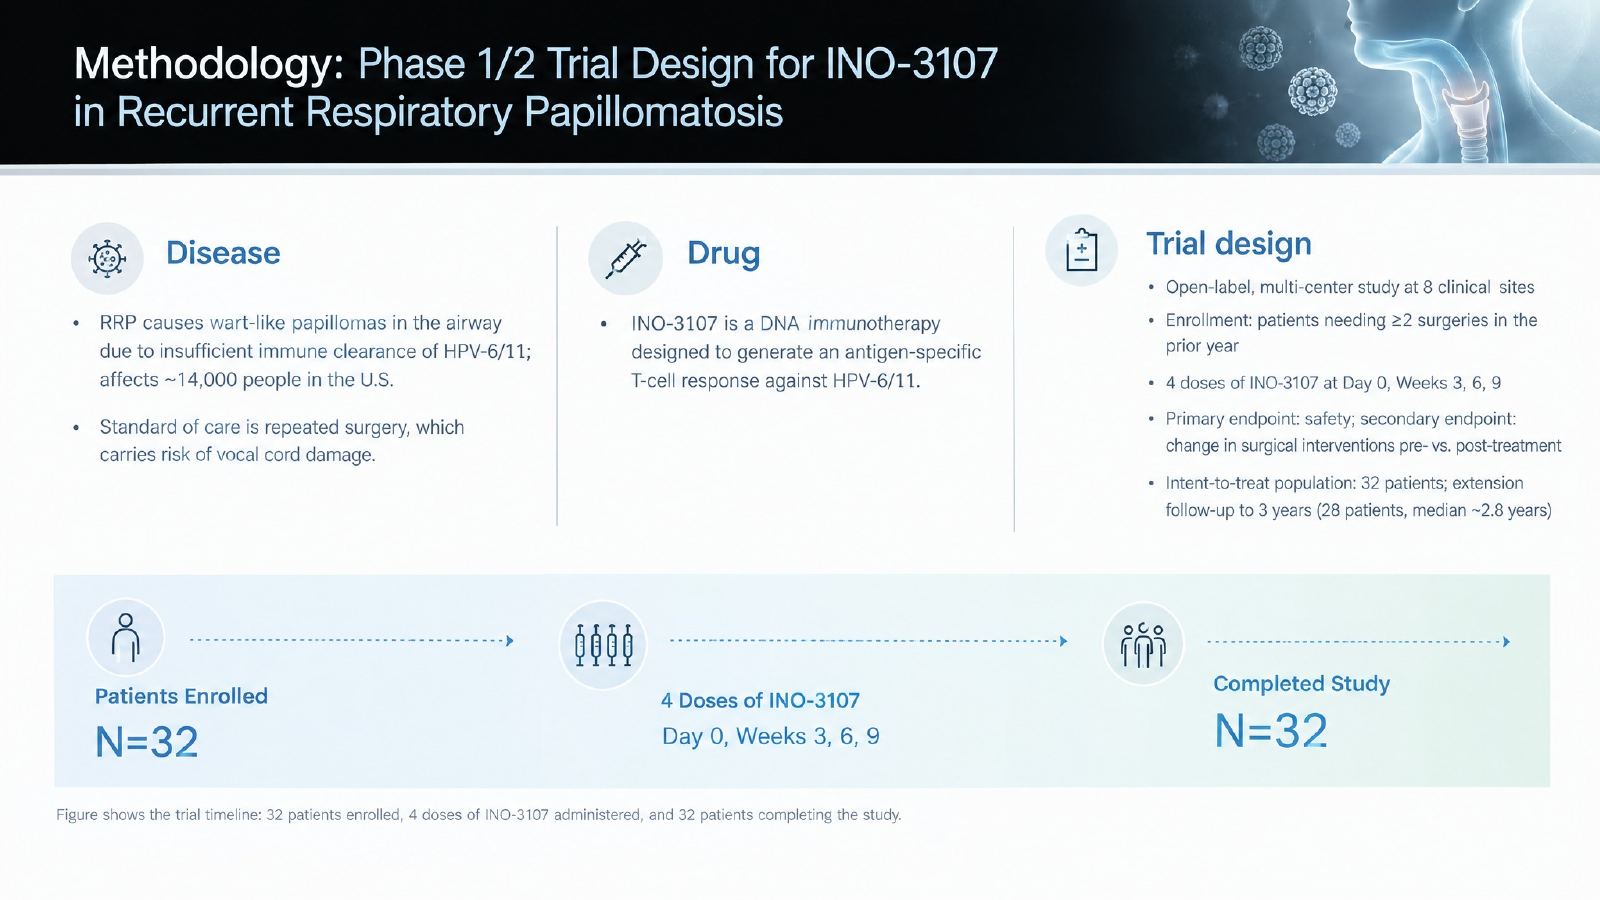
Example deck, slide 5: disease, intervention, and trial-design columns above a simple enrollment and dosing timeline.
4. A results slide with uncertainty
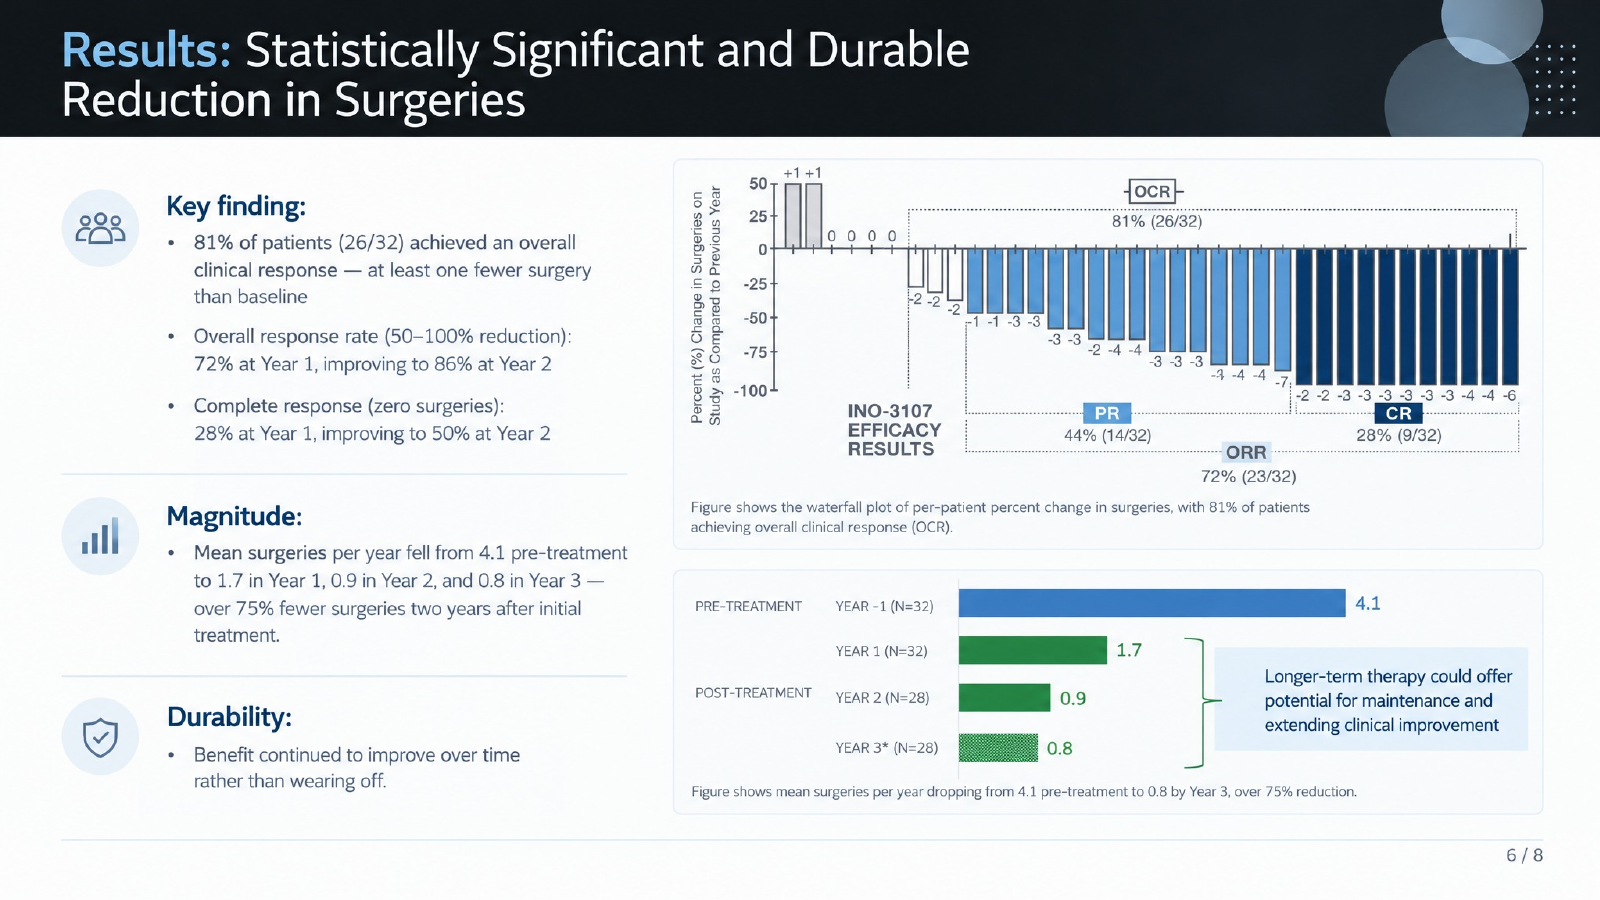
Example deck, slide 6. The layout of takeaways beside two charts works well. The redrawn waterfall plot does not: it contains 36 bars for a 32-patient study, with 16 bars colored as partial response and 11 as complete response, while its own labels report 14 and 9. A real talk should use the original figure.
Create one results slide from [approved figure or table].
Write a title limited to the observed finding. Display the relevant comparison, sample size, units, endpoint, and uncertainty definition supplied by the authors.
Preserve axis direction, scale, group labels, confidence intervals, and statistical annotations. Do not infer missing values from an image without flagging them for verification.
Recommend one visual emphasis and a short limitation beside the affected claim. Cite the original figure and source.
Verify the error-bar definition. If reconstruction is unreliable, retain the approved figure. For figure-specific tooling, our roundup of scientific figure skills for researchers compares options for rebuilding plots from data rather than from pixels.
5. Interpretation and mechanism without overclaiming
Split observations and interpretations across pages when necessary.
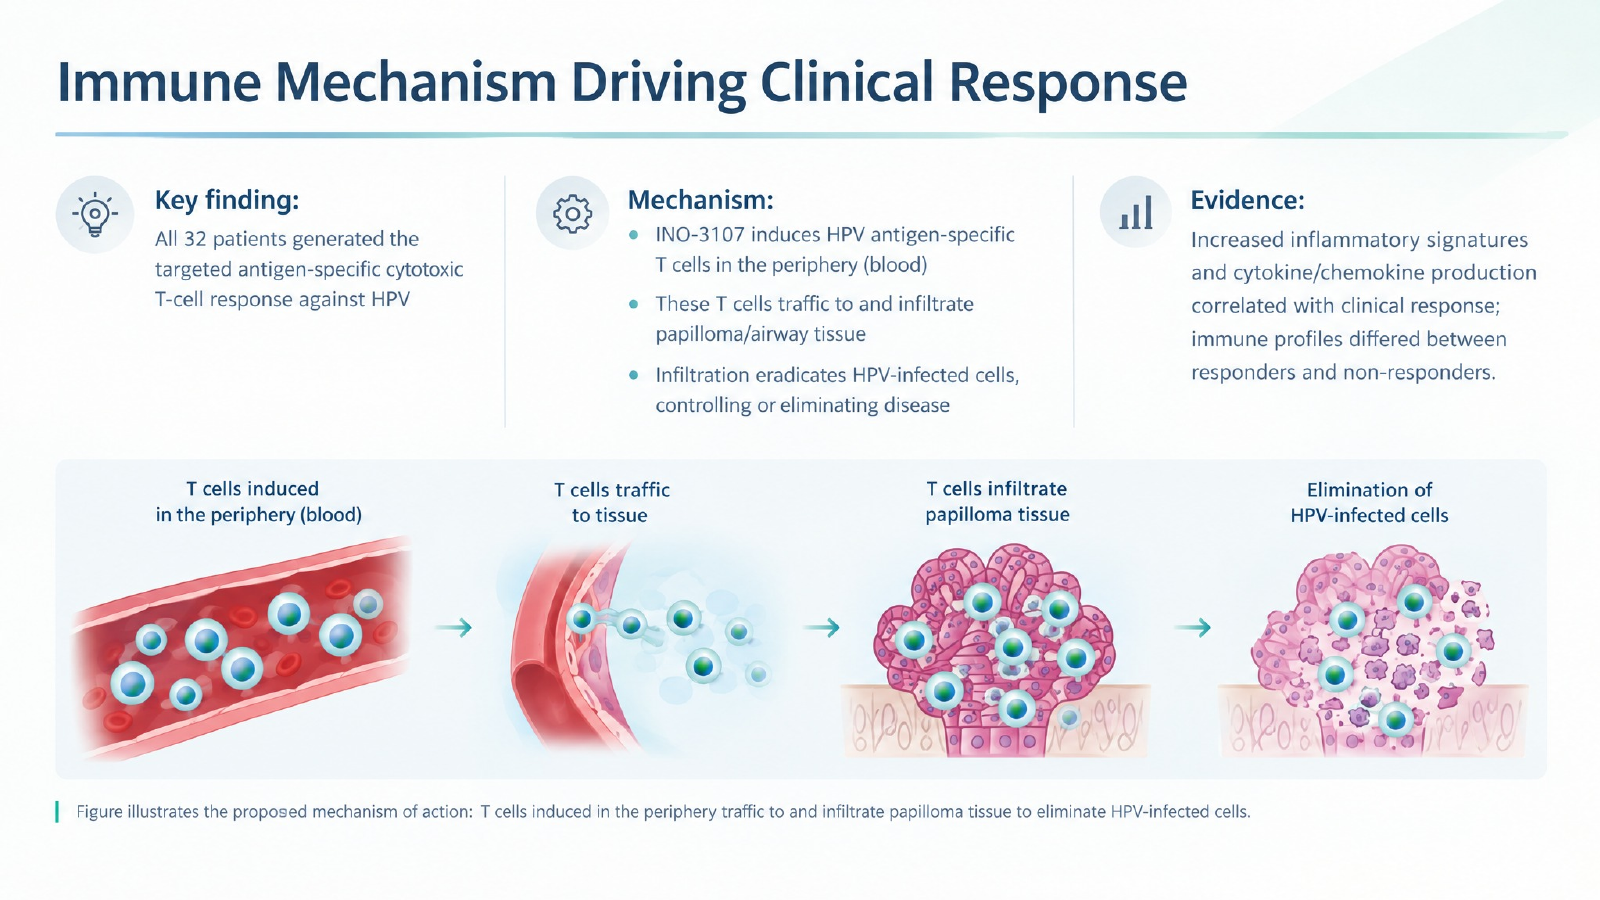
Example deck, slide 7. A sequential diagram helps explain a proposed mechanism; the illustration alone cannot establish causality.
Prepare an interpretation slide from the approved results and discussion.
Separate direct observations, the authors' proposed explanation, alternative explanations, and the next validating experiment.
Use a mechanism diagram only where the source supports it. Distinguish correlations from causal evidence. Keep uncertainty visible in both the diagram labels and speaker notes.
6. A closing slide and reviewer-style Q&A
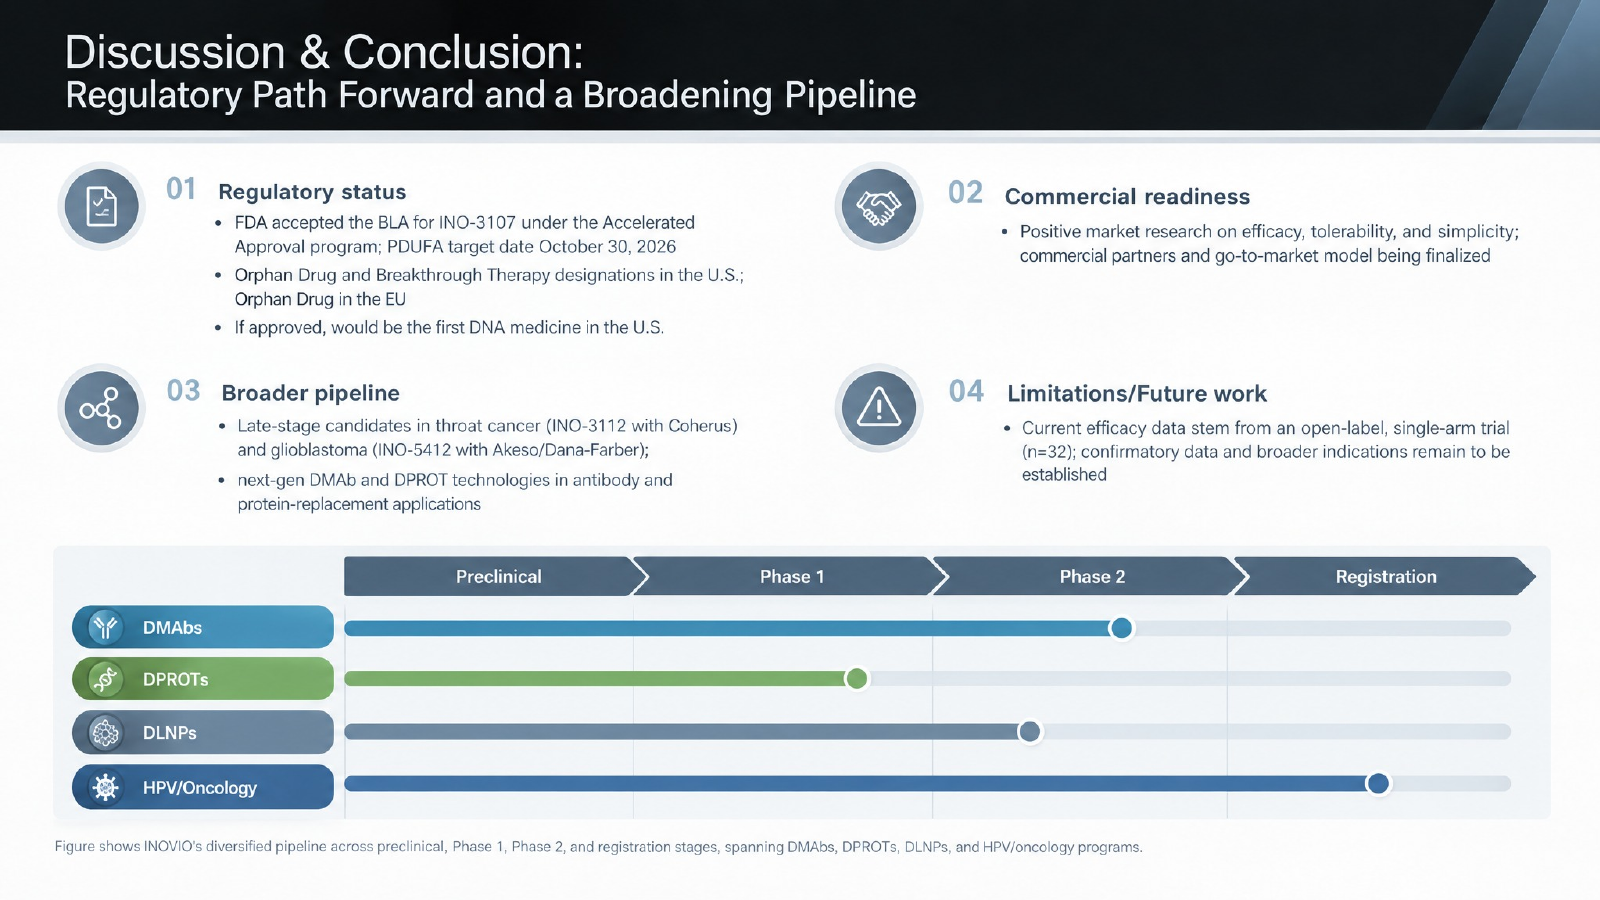
Example deck, slide 8. The four-block layout with a limitations box is a useful closing pattern. The content would fail review: the pipeline bars place the DMAb, DPROT, and DLNP programs further along than INOVIO's own pipeline page lists them (Phase 1 or preclinical), and the regulatory bullets predate the FDA's October 30, 2026 accelerated approval of INO-3107 as VOCERYQ.
Create a closing slide with the research question, supported answer, principal limitation, and next research step.
Then generate eight likely audience questions covering design, confounding, measurement, statistical uncertainty, generalizability, reproducibility, and interpretation.
Draft brief answers using only supplied sources. Distinguish answers available in the data from questions requiring further work. Suggest the backup figure needed for each answer.
Build the presentation in Tosea AI
Upload the approved source pack to Tosea AI, paste the outline prompt, and choose an academic template. Correct claim wording, sequence, and source references in the outline before rendering. You can choose layouts or diagrams during outline preparation and revise them after the slides are generated.
Use a permitted reference image to specify typography, whitespace, palette, and diagram placement. State whether to borrow its layout or include it as content.
Data Studio supports editing chart data, chart types, and styling from recognized source figures or imported Excel and CSV files. Check reconstructed values against the original dataset. For a specialized scientific plot such as a waterfall, forest, or Kaplan-Meier plot, rebuild it from the underlying data or keep the approved figure as an image. Do not let a model redraw it from a picture.
If your deck already contains approved wording, use Beautify PPT/PDF to upload a PDF or PPTX and select a template. Keep source pages retains every slide and redesigns its appearance; use Layout Only for subsequent visual changes. Product availability depends on the plan. Tosea AI product updates document these workflows. For the end-to-end paper workflow, see from research paper to slides in 10 minutes.
Check the deck before presenting
Verify denominators, units, legends, citations, and qualifiers against the paper. Distinguish measurements from hypotheses. Retain detailed methods and full figures in backup slides.
What a review of the example deck caught
A side-by-side check of the eight example slides against public sources found four issues. None is visible at a glance, and all four would matter in front of an expert audience.
- A redrawn chart with the wrong number of data points. The waterfall plot on slide 6 shows 36 patient bars for a 32-patient study. Its colored groups (16 partial and 11 complete responses) disagree with the 14 and 9 printed beneath them. Counting bars against the stated sample size takes one minute and catches this class of error.
- Stages that drifted. The pipeline chart on slide 8 advances three technology platforms by one or more stages compared with INOVIO's published pipeline. Stage bars, timelines, and Gantt-style graphics are easy for image models to misplace because the label and the position are drawn separately.
- Status that went stale. The example deck is dated March 2026 and describes INO-3107 as under FDA review. On October 30, 2026, INOVIO announced accelerated approval of VOCERYQ. Any regulatory, funding, or publication status in a talk needs a "verified as of" date.
- Two header systems in one deck. Slides 4 through 6 and slide 8 use a dark header band; slides 3 and 7 use a light header. Pick one for all content slides. Mixed header styles make the talk feel like two decks stitched together.
The lesson is not that AI-generated slides are unusable. The layouts in this deck are clean and reusable. The lesson is that numbers, stages, and statuses must be checked against the source on every slide, especially where a chart was redrawn rather than imported.
Final pass
Rehearse aloud with a timer. Titles should reveal the argument and figures provide the evidence. Test fonts, equations, dimensions, and figure labels on the delivery computer. Before the session, confirm:
- Every chart's data points match the stated sample size.
- Every status claim carries a date and a source.
- Figure labels are 18 pt or larger after scaling.
- The header style is identical on every content slide.
- Backup slides exist for methods, full figures, and likely questions.
Frequently asked questions
Can Tosea AI redesign my existing PowerPoint without changing the content?
Yes. Upload the PPTX or export it as a PDF and use Beautify PPT/PDF with Keep source pages. Use Layout Only for visual restructuring without intentional rewriting. Compare every label, footnote, number, citation, and image with the original before presenting.
How do I upload a PowerPoint and ask Tosea AI to redesign each slide?
Choose Beautify PPT/PDF, upload your PPTX or PDF, and request that content and sequence remain intact. Select a template or describe the visual direction. Generate the presentation, inspect every page, and test the exported file before your conference.
Can I upload my own PowerPoint template to Tosea AI?
Custom templates are supported on eligible paid plans. Use an approved institutional template and check that required layouts, fonts, colors, logo placement, and master-slide rules appear correctly in the generated presentation and exported PowerPoint.
Can Tosea AI use custom brand colors, fonts, and a logo?
Yes. Specify institutional colors and fonts, supply the approved logo, or use a supported custom template. Custom logo and template features depend on the plan. Verify font availability, color values, contrast, and logo placement after export.
Can Tosea AI match the style of my old company presentations?
A representative presentation can provide design guidance. This does not imply permanent model training. For stronger consistency, use an approved template containing the required typography, colors, layouts, and logo, then compare the output with your current guidelines.
Does Tosea AI preserve PowerPoint formatting after export?
Editable PPTX export aims to remain close to the generated preview. Fonts, complex graphics, and the application used to open the file can affect the result. Test the deck in the exact PowerPoint environment used for delivery.
Can I tell AI to edit the layout only and keep the exact wording?
Yes. Layout Only is intended for visual changes without rewriting approved content. After editing, compare the result with the source, including equations, labels, citations, footnotes, line breaks, and any qualification that changes how a finding should be interpreted.
Continue building your research presentation
For more reusable instructions, see 10 AI prompts for research presentations. For another research-to-slides example, explore the guide to presenting research on AI classroom engagement. If you want a more visual, design-led pipeline, our high-aesthetic AI presentation prompts show a layered approach.
Create your aesthetic academic conference PPT with AI by starting with an approved scientific argument. Tosea AI helps turn that argument and its evidence into an outline, consistent pages, editable charts, and an exportable presentation. Upload your sources, use the prompts above, and refine the deck until each page supports the message you intend to deliver.
Sources
- Technical Presentation — MIT Mechanical Engineering Communication Lab
- Hourglass Communication — MIT AeroAstro Communication Lab (PDF poster)
- Slideshow — Broad Institute of MIT and Harvard Communication Lab
- Make your PowerPoint presentations accessible to people with disabilities — Microsoft Support
- Points of view: Color blindness — Bang Wong, Nature Methods, 2011
- INOVIO Announces FDA Accelerated Approval of VOCERYQ — INOVIO press release filed with the SEC, October 30, 2026
- Current pipeline — INOVIO Pharmaceuticals