How to Create a Year-End Review Presentation with AI: A Universal Framework for Professionals
Build a year-end review presentation with AI: a six-part framework with time weights, copy-ready prompts, a 10-slide structure, and a workflow that turns work records into an editable deck.
A year-end review presentation with AI should help your manager understand what changed because of your work, how you handled difficult situations, and what you will do next. It should not be a twelve-month task diary. This guide gives professionals a universal six-part framework, copy-ready prompts, a 10-slide structure, and a practical workflow for turning work records, spreadsheets, reports, and existing slides into an editable deck with Tosea AI.
This is the personal version of the year-end deck: your role, your contribution, your plan. If you are presenting a company or business-unit review to leadership, our annual business review PowerPoint guide covers that format instead.
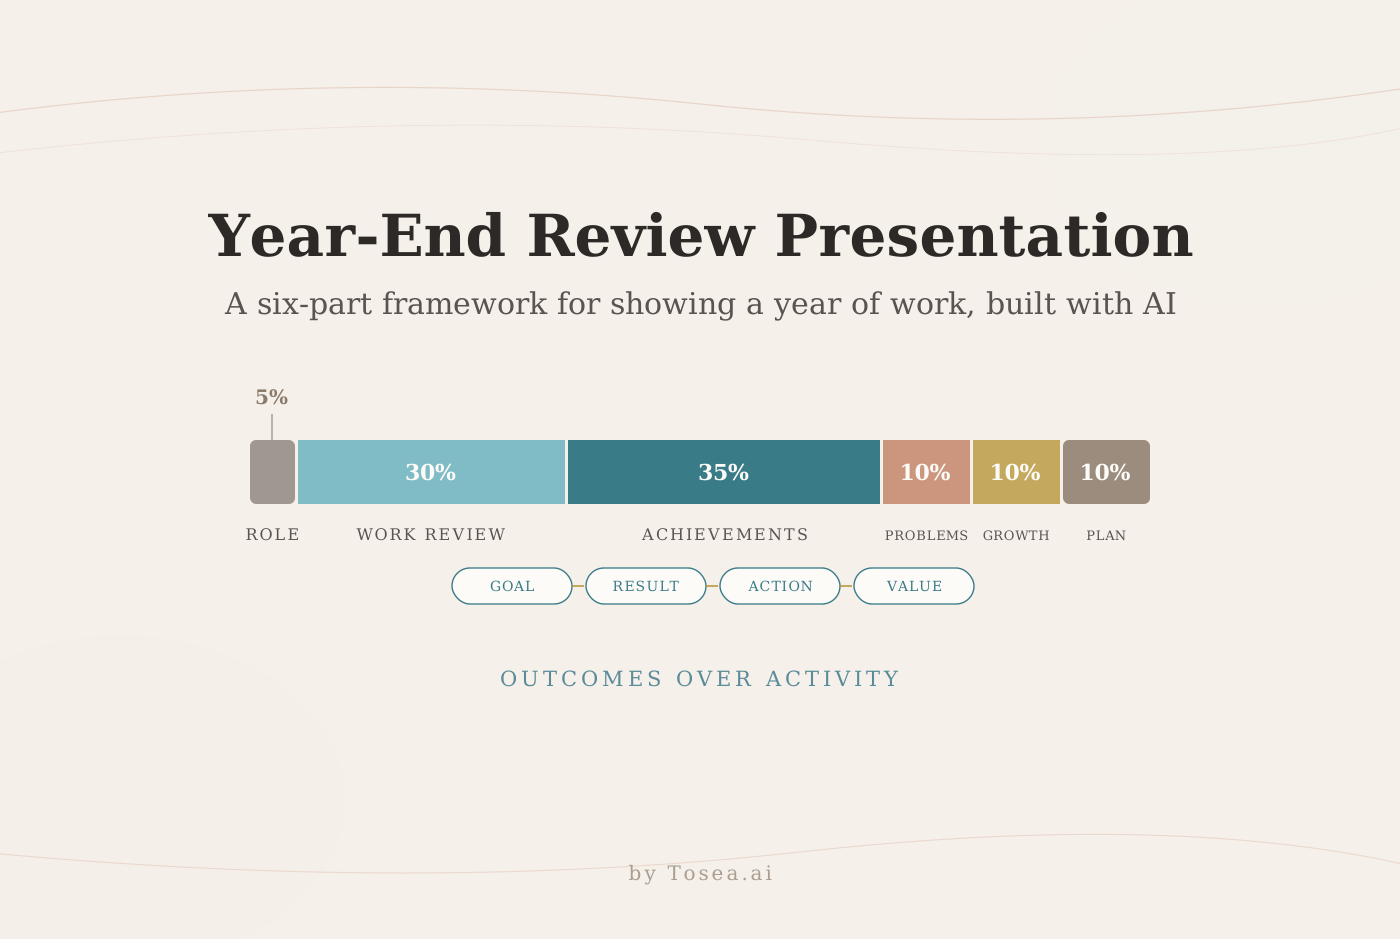
Quick answer: Allocate roughly 5 percent of the presentation to role context, 30 percent to the work review, 35 percent to high-impact achievements, 10 percent to problem solving, 10 percent to professional growth, and 10 percent to the next-year plan. Adjust the mix for your role and audience.
Contents
- What a strong year-end review must prove
- The six-part universal framework
- Turn routine work into evidence
- Copy-ready master prompt
- A practical 10-slide structure
- How to build the deck in Tosea AI
- Common mistakes
- Delivering the review
- Frequently asked questions
What a strong year-end review must prove
The presentation has three jobs. First, establish your scope so people outside your immediate team know what you own. Second, show outcomes with evidence. Third, demonstrate judgment by explaining decisions, trade-offs, and next steps.
This matters because performance is difficult to judge from output volume alone, especially for knowledge work. The CIPD performance management factsheet summarizes the main tools organizations use, from objective setting to reviews and feedback, and recent shifts in thinking about how performance is managed. Gallup's position paper on re-engineering performance management recommends at least two formal progress reviews per year and frames them around clear expectations, accountability, and individualized development. A year-end deck that follows the same logic is easier for a manager to use.
Your emphasis should change with seniority:
| Role level | What the audience needs to see |
|---|---|
| Early career | Reliable execution, learning speed, and evidence that tasks were completed well |
| Mid-level | Ownership of outcomes, cross-functional coordination, and stronger operating methods |
| Senior or manager | Prioritization, team leverage, business impact, risk management, and decisions for next year |
When presenting to another department, add brief context. Your own manager already knows the team structure. A cross-functional leader may not know your mandate, constraints, or contribution.
The six-part universal framework
1. Role and scope: 5 percent
State your role, responsibilities, stakeholders, and any material change in scope. Keep this to one slide. The purpose is orientation, not biography.
Use this prompt:
Write one orientation slide for my year-end review.
Audience: [manager, department leadership, or cross-functional panel].
Use the attached role description and work records.
Explain my role, core responsibilities, stakeholders, and any scope change during the year.
Keep it under 70 words. Do not invent responsibilities.
2. Work review: 30 percent
Show the operating baseline of your year: major responsibilities, recurring work, projects delivered, service quality, and coordination load. Routine work still has value when it protects continuity, prevents errors, or creates capacity. Quantify volume, quality, speed, and reliability where the records support it.
Useful evidence includes completed projects, on-time rate, cycle time, incidents prevented, customer requests handled, systems maintained, and departments supported. Avoid a long list of activities with no comparison or consequence.
3. Achievement stories: 35 percent
This is the center of the deck. Select two or three achievements, then use the same four-part logic for each:
- Goal: What outcome mattered?
- Result: What changed, with a number or verifiable artifact?
- Action: What did you personally decide, build, or coordinate?
- Value: What did the result save, improve, enable, or standardize?
The strongest slide title states the conclusion. Project Overview is a label. A New Intake Process Cut Approval Time by 54 Percent is a finding.
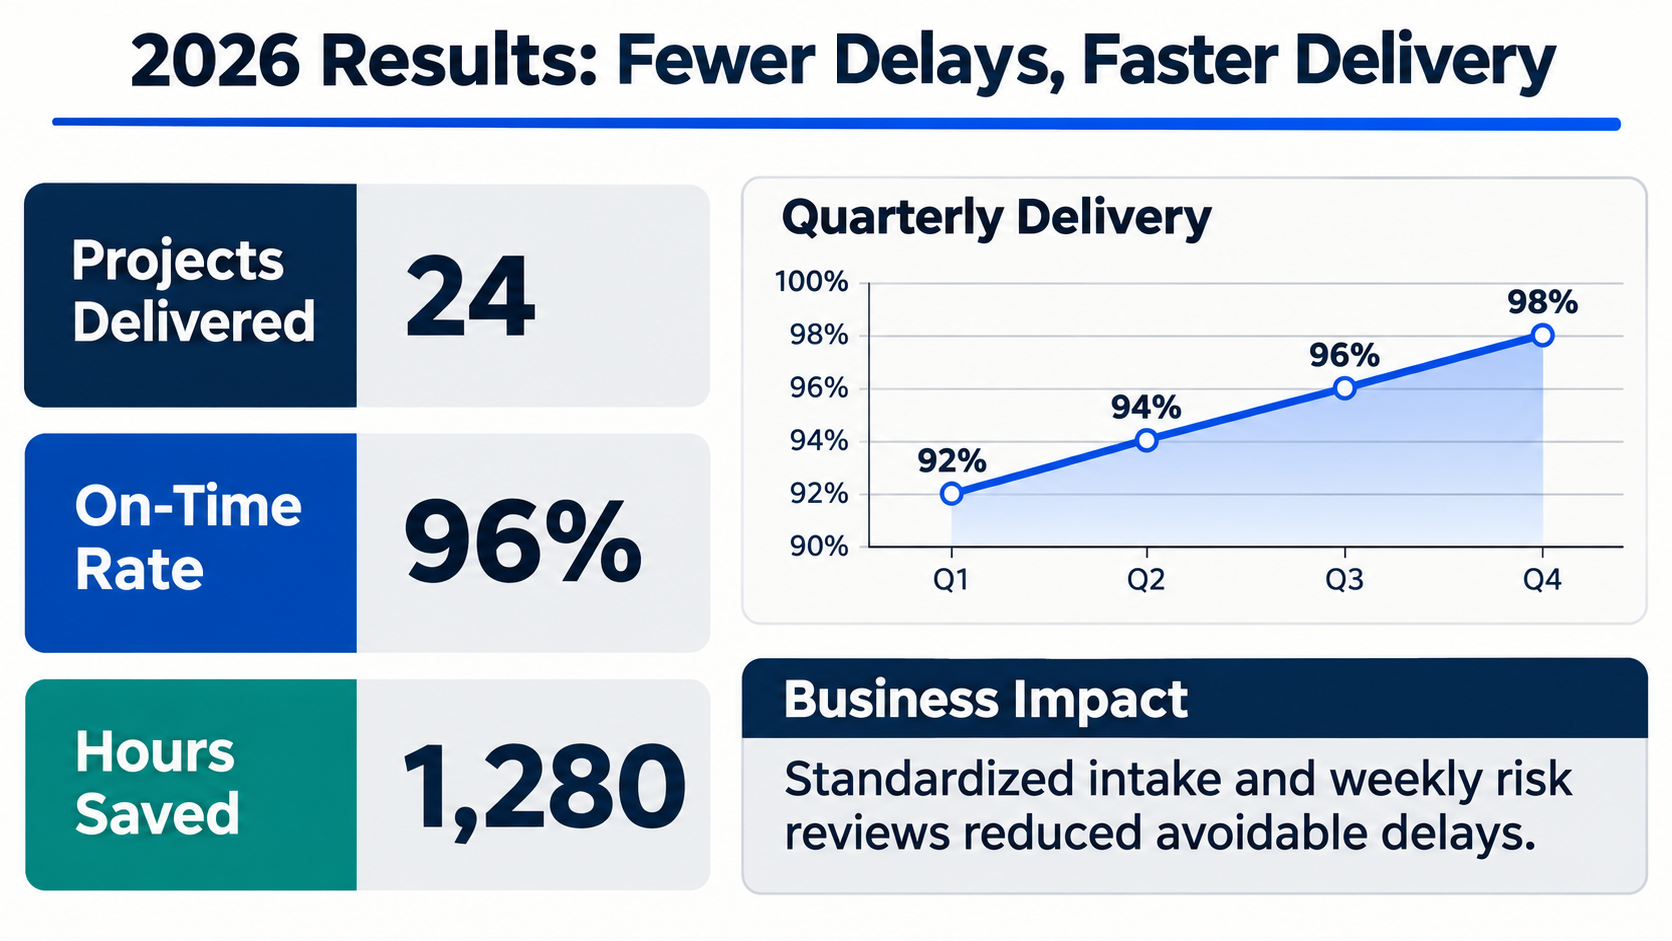
Original editorial example with fictional data. The slide combines outcome cards, a trend, and a plain-language business impact statement, and its title only claims what the evidence on the page supports.
Use this prompt:
Identify the three strongest achievements in the attached work records.
Score each candidate on business impact, evidence quality, personal ownership, and relevance to next-year priorities.
For the top three, write a slide with Goal, Result, Action, and Value.
Use only verified figures. Cite the source file and period for every number.
If impact cannot be quantified, use a concrete operational outcome and label it as qualitative evidence.
4. Problem solving: 10 percent
Managers expect problems. They want to know whether you diagnosed the cause, made a sensible decision, and prevented recurrence. SCQA gives this section a clean structure:
- Situation: The relevant operating context
- Complication: The constraint, conflict, or failure
- Question: The decision that had to be made
- Answer: The action, result, and lesson
Do not turn this page into a complaint log. Name the issue briefly, then spend most of the slide on diagnosis, response, and control. The same storyline logic underpins consulting decks; our BCG-style storyline guide shows how it scales to a full presentation.
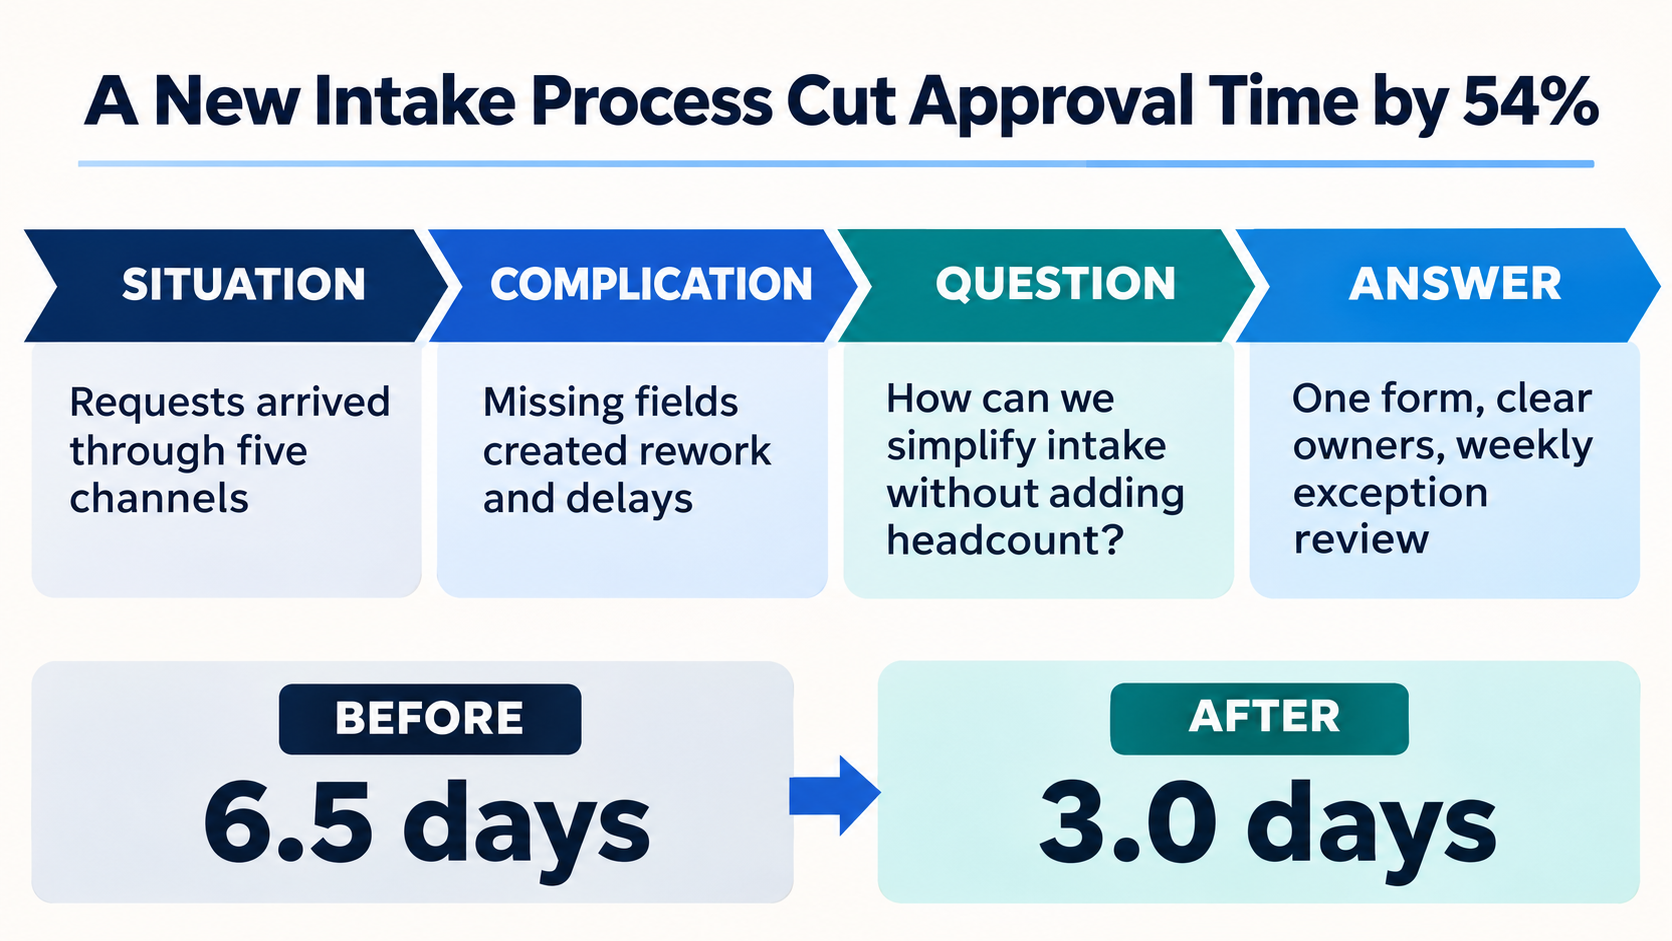
Original editorial example with fictional data. The before-and-after measure makes the response testable: 6.5 days to 3.0 days is a 54 percent reduction.
Use this prompt:
Turn the attached project issue into an SCQA problem-solving slide.
Separate observed facts from assumptions.
Explain the root cause, options considered, chosen action, result, and prevention measure.
Use a before-and-after comparison only if the definitions and periods are consistent.
Write a conclusion title and no more than four short content blocks.
5. Professional growth: 10 percent
Avoid a generic list of courses. Show how your capability changed your work. Cover technical or domain skill, collaboration or management practice, reusable methods, and a revised understanding of the business. A useful example is a checklist that reduced review errors or a playbook that helped colleagues complete work without your direct involvement.
6. Next-year plan: 10 percent
End with a plan that your manager can discuss and support. Set two or three outcome goals, break them into milestones, name the measures, and state the resources or decisions required. Objectives work best when they describe specific outcomes rather than activities. Use SMART or OKR language only when it improves precision.
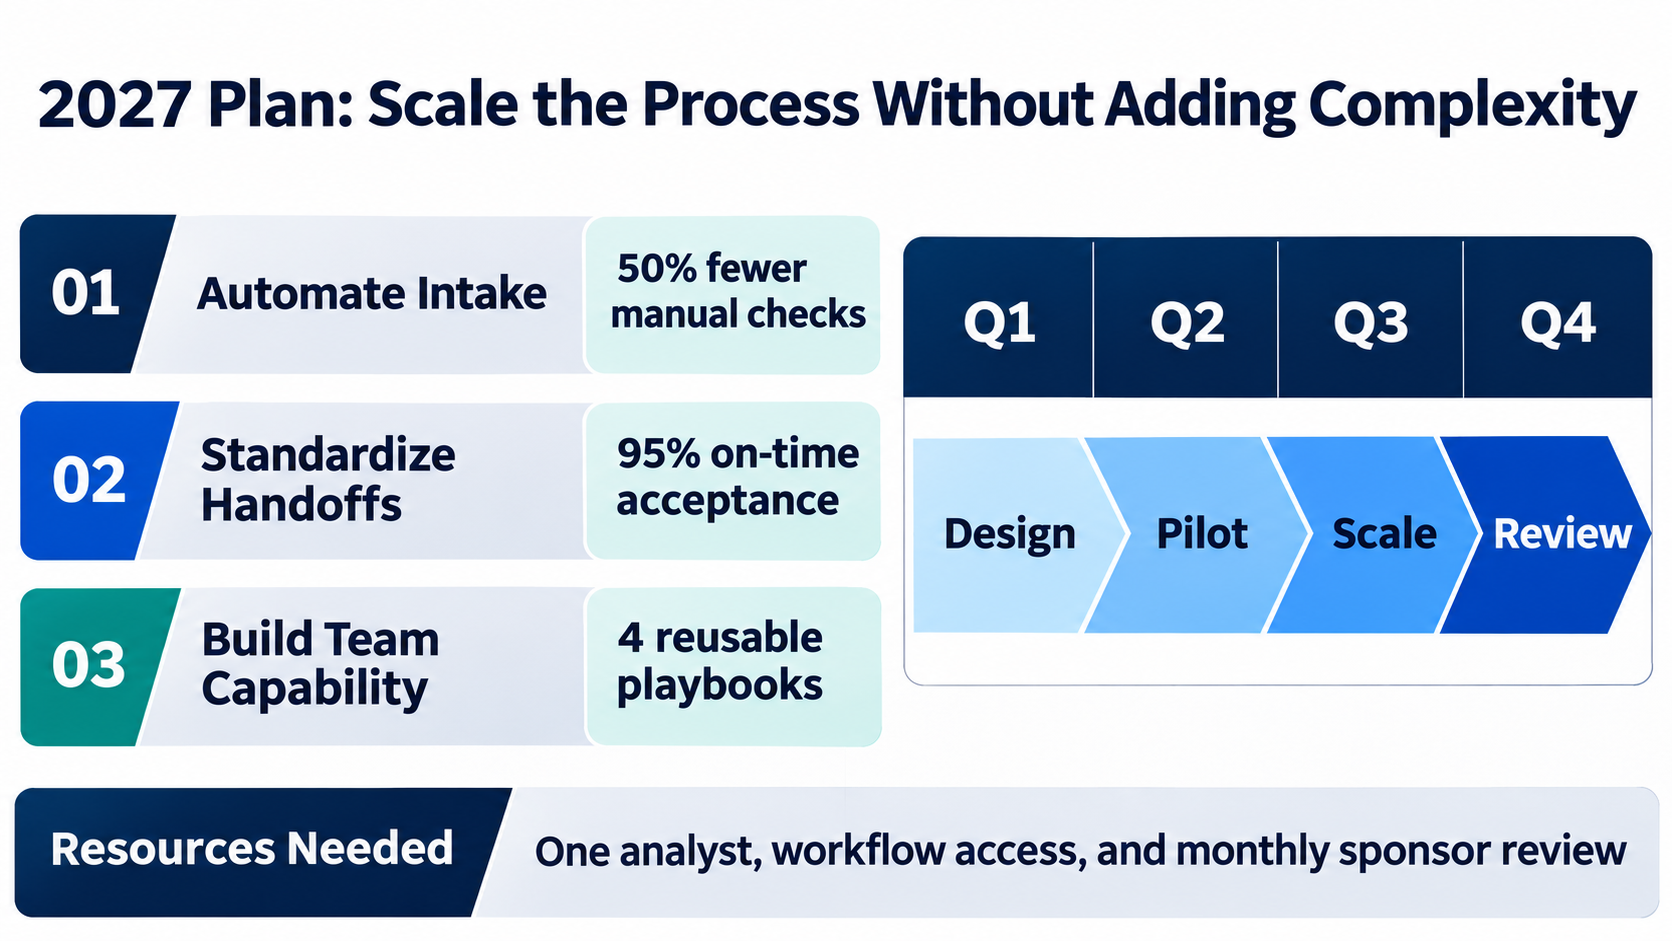
Original editorial example with fictional data. Each priority has an outcome measure, delivery sequence, and explicit resource request.
Use this prompt:
Create a next-year plan from the attached team priorities and this year review.
Propose three outcome goals, each with a baseline, target, owner, milestone, dependency, and review date.
Build a Q1 to Q4 roadmap and list the minimum resources or decisions required.
Do not promise outcomes that depend on unconfirmed budget, staffing, or authority.
Turn routine work into evidence
Most people undersell the 30 percent of their year that was steady, recurring work. The fix is to translate each activity into a consequence the business cares about: reliability, risk, speed, quality, or capacity. AI is good at this rewrite once you give it the raw records, but you must supply the comparison point.
| Role | Weak line | Evidence-based line |
|---|---|---|
| Software engineer | Maintained the billing service | Kept billing at 99.95 percent availability across 4 releases with no customer-facing incidents |
| Marketing | Ran the monthly newsletter | Grew newsletter-sourced demo requests from 40 to 65 per month while reducing send cost |
| Operations | Handled vendor onboarding | Cut vendor onboarding from 15 to 9 working days by standardizing document checks |
| Finance | Prepared month-end reports | Closed the books on day 5 instead of day 8 for nine consecutive months |
| Customer support | Answered tickets | Resolved 3,200 tickets with a 94 percent satisfaction score and wrote 12 help articles that deflected repeat questions |
| People manager | Managed a team of six | Retained all six team members, promoted two, and covered a vacant role without missed deadlines |
The figures in this table are illustrative. The pattern is the point: name the activity, add a measure, add a comparison, and add the consequence. If you do not have a measure, use a verifiable artifact instead, such as a process document, an approved design, or a stakeholder's written feedback.
Collect this evidence before you prompt. Export your project tracker, pull the KPI dashboard for the full year, save meaningful feedback emails, and list the documents you authored. The better the source pack, the less the AI has to guess, and the less you have to correct.
Copy-ready master prompt for a year-end review presentation with AI
Create a 10-slide year-end review presentation from the uploaded files.

Audience: [name the manager or review panel].
Role level: [early career, mid-level, senior, or manager].
Purpose: explain full-year contribution, demonstrate problem-solving judgment, and agree on next-year priorities.

Use this weighting: role and scope 5 percent, work review 30 percent, achievement stories 35 percent, problem solving 10 percent, professional growth 10 percent, next-year plan 10 percent.

For every slide provide a conclusion title, supporting evidence, recommended visual, source reference, and speaker note. Use Goal, Result, Action, and Value for achievement stories. Use SCQA for one problem-solving case. Show actual versus target or prior period where valid.

Preserve names, dates, units, and definitions from the source. Do not invent numbers, causality, ownership, or praise. Mark missing evidence as data required. Protect confidential customer, employee, and financial information.
A practical 10-slide structure
| Slide | Question answered | Recommended visual |
|---|---|---|
| 1 | What is the year in one sentence? | Three findings and one forward-looking message |
| 2 | What did I own? | Role, scope, and stakeholder map |
| 3 | What did I deliver consistently? | Workload and reliability scorecard |
| 4 | Which outcome mattered most? | Achievement story with trend or before-and-after |
| 5 | What was my second major contribution? | Goal, Result, Action, Value |
| 6 | How did I create value across teams? | Process map or stakeholder outcome |
| 7 | How did I solve a difficult problem? | SCQA with root cause and result |
| 8 | How did my capability change? | Skill-to-work evidence matrix |
| 9 | What will I deliver next year? | Three priorities and quarterly roadmap |
| 10 | What support or decision is needed? | Named request, owner, and date |
Ten slides suit a 15 to 20 minute review. If you have only 10 minutes, merge slides 2 and 3, keep one achievement story, and fold growth into the plan. If the panel is senior and unfamiliar with your work, keep slide 2 and cut slide 8 instead.
How to build the deck in Tosea AI
- Collect the source pack: role description, goals, project records, KPI exports, feedback, and prior slides. Remove duplicates and mark final versions.
- Upload the files to Tosea AI, add the master prompt, choose a business template, and set the target slide count.
- Review the outline before rendering. Correct ownership, periods, and unsupported claims while the story is still easy to change.
- Import Excel or CSV into Data Studio for editable charts. Reconcile totals, denominators, units, and comparison periods.
- Generate the slides. Use Layout Only when the wording is approved but the page needs a different visual structure.
- Export an editable PPTX on an eligible plan and test it in the PowerPoint environment used for the review.
If an existing deck already contains the right content, Beautify PPT/PDF can redesign it while keeping the source pages. Keep source pages, the default option, keeps every slide in the original order with its text, data, charts, and images; only layout and visuals are redesigned. Availability depends on the plan. Review every slide after generation. Our guide to beautifying a PowerPoint without changing its content shows the workflow step by step, and the current Tosea AI product update lists availability.
For KPI-heavy roles, the business dashboard PowerPoint guide has layouts for scorecards and trend pages that fit slides 3 and 4.
Six mistakes that weaken a year-end review
- The task diary. A month-by-month list of activities buries the two or three outcomes that matter. Organize by outcome, not by calendar.
- Claiming the team's result as your own. Managers know who did what. Say "the team shipped X; I owned Y" and your credibility goes up, not down.
- Vanity metrics. Emails sent and meetings attended are inputs. Show what those inputs changed.
- Hiding the hard problem. A year with no difficulties reads as either a very easy year or an incomplete account. One honest SCQA slide shows judgment.
- Titles that claim more than the slide shows. If the title says "fewer escalations," the slide needs an escalation number. Otherwise, change the title to match the evidence you have.
- A plan with no asks. If a goal needs budget, headcount, or a decision from your manager, write it down. A plan without dependencies is a wish list.
Delivering the review conversation
The deck supports a conversation; it does not replace one. Send it a day early if your manager prefers to read first, and bring a printed or offline copy in case the meeting room setup fails.
Open with slide 1 and say the one-sentence summary out loud. Spend most of your time on the achievement stories and the problem slide, and pause after each one so your manager can ask questions while the evidence is on screen. Prepare short answers to three questions that come up in almost every review: what you would do differently, where you need support, and how your plan connects to next year's team priorities.
Keep a backup appendix with the raw data behind every headline number. If a figure is challenged, you can show the source in seconds rather than promise to follow up. Close on slide 10 with the specific decision or support you need, and agree on a date to check progress. That turns the year-end review into the first progress review of next year.
Final quality checklist
- Every number has a source, unit, period, and comparison basis.
- Achievements distinguish team results from your personal contribution.
- Routine work is linked to reliability, risk reduction, quality, or capacity.
- Problem slides explain the response rather than dramatizing the failure.
- Next-year goals have measures, dependencies, and review dates.
- Confidential information is removed or approved for the audience.
- Slides use readable text, sufficient contrast, and alt text. Microsoft recommends unique slide titles, a checked reading order, and 18-point or larger text.
Frequently asked questions
Can Tosea AI redesign my existing PowerPoint without changing the content?
Yes. Upload the PPTX or a PDF with Beautify PPT/PDF and choose Keep source pages. Use Layout Only for later visual restructuring without intentional rewriting. Compare every label, number, footnote, and slide element with the original before presenting.
How do I upload a PowerPoint and ask Tosea AI to redesign each slide?
Choose Beautify PPT/PDF, upload the PPTX or PDF, keep the source pages, and choose a template or describe the visual direction. Generate the deck, inspect every page, and correct any exception before export.
Can I upload my own PowerPoint template to Tosea AI?
Tosea AI supports custom templates on eligible paid plans. Check that required layouts, fonts, colors, logo placement, and master-slide rules appear correctly in the output.
Can Tosea AI use custom brand colors, fonts, and a logo?
Yes. Specify the colors and fonts, upload the logo, or use a supported custom template. Verify font availability, color values, contrast, and logo clear space after export.
Can Tosea AI match the style of my old company presentations?
A representative deck can guide the design, but this does not mean permanent model training. Use an approved current template and compare the result with formal brand guidelines.
Does Tosea AI preserve PowerPoint formatting after export?
Editable PPTX export is designed to remain close to the generated preview. Fonts, complex graphics, and presentation software can affect the result, so test the file in the exact delivery environment.
Can I tell AI to edit the layout only and keep the exact wording?
Yes. Layout Only changes visual structure without intentionally rewriting content. Compare the result with the source, including labels, citations, footnotes, numbers, and line breaks.
Related Tosea AI guides
- How to Create an Annual Business Review PowerPoint with AI
- How to Build a Business Dashboard PowerPoint with AI
- 10 Best Business Presentation Prompts for ChatGPT and Claude
- How to Build a Quarterly Business Review Deck
- How to Make a Job Portfolio Presentation with AI
Sources
- Performance management factsheet — CIPD
- Re-Engineering Performance Management — Gallup (PDF)
- Make your PowerPoint presentations accessible to people with disabilities — Microsoft Support