How to Use daily_stock_analysis: Complete Guide to the AI Stock Analysis Tool 2026
A complete guide to daily_stock_analysis, the open-source LLM stock tool: GitHub Actions setup, local install, supported markets, and turning AI stock reports into financial slides.

If you are looking for an AI stock analysis tool you can run yourself, the GitHub repository ZhuLinsen/daily_stock_analysis is one of the most popular places to start. It is an LLM-powered, multi-market stock analysis system that collects market data, news, technical indicators, sentiment signals, and fundamentals, then generates daily AI decision dashboards that can be pushed to WeChat Work, Feishu, Telegram, Discord, Slack, or email. For analysts, researchers, consultants, and investors, it works as the data-to-report layer that comes before you turn financial reports into presentation-ready slides with Tosea.ai.
The project is not a niche experiment. As of mid-2026 it has gathered over 49,000 GitHub stars and more than 43,000 forks, and it was listed as the #1 Python repository of the day on Trendshift. The unusually high fork count is itself a clue about how people use it: the recommended setup is to fork the repo and let GitHub Actions run the analysis on a schedule, so nearly everyone who adopts it forks it.
Quick Overview
daily_stock_analysis is an open-source AI stock analysis project written in Python. It is designed to automate watchlist analysis across multiple markets and produce daily decision reports without you manually checking a dozen data platforms.
Project facts at a glance:
| Attribute | Detail |
|---|---|
| GitHub repo | ZhuLinsen/daily_stock_analysis |
| Language | Python (3.10+) |
| License | MIT |
| Popularity | 49K+ stars, 43K+ forks (mid-2026) |
| Core purpose | LLM-powered stock analysis and automated decision dashboard |
| Markets | A-shares, Hong Kong, US, ETFs, plus partial Japan and Korea ticker support |
| Deployment | GitHub Actions, local run, Docker, FastAPI service, web workstation |
| Notifications | WeChat Work, Feishu, Telegram, Discord, Slack, email |
| AI models | Anspire, AIHubMix, Gemini, OpenAI-compatible APIs, DeepSeek, Qwen, Claude, Ollama local models |
| Data sources | TickFlow, AkShare, Tushare, Pytdx, Baostock, YFinance, Longbridge, plus optional search APIs |
One important caveat up front: this project is an analysis assistant, not a licensed financial advisor. Its outputs should be treated as research support, not investment advice.
What Is daily_stock_analysis?
daily_stock_analysis is a GitHub project for automated AI stock analysis. The README describes it as a multi-market system that generates AI decision reports with core conclusions, scores, trends, buy and sell levels, risk alerts, catalysts, and operation checklists.
It is not a simple stock-price script. It layers several types of input into a single workflow:
- Market and K-line data
- Technical indicators
- Capital flow and chip distribution
- News and announcements
- Fundamentals
- LLM reasoning
- Automated scheduling
- Notification delivery
- A web dashboard
The repository is organized into folders such as api, apps, bot, data_provider, docker, docs, scripts, src, strategies, templates, and tests. That structure signals a complete system rather than a single file — which is also why it earns a place alongside other serious open-source finance tooling such as FinceptTerminal, the free Bloomberg alternative.
For anyone who wants a daily stock report without checking multiple data platforms by hand, this repo is worth studying.
Why Analysts and Investors Care
Financial analysis is repetitive. A human analyst may need to check price action, news, capital flow, fundamentals, sentiment, market review, and risk events every single day, which creates three recurring problems.
Information is fragmented. Prices live in one data source, news in another, fundamentals in a third, and sentiment somewhere else entirely.
Daily tracking is time-consuming. A watchlist of 20 stocks quickly becomes a daily research burden.
Reports need structure. Investors and analysts do not only need raw data — they need a clear decision view: what changed, what matters, what risk increased, and what to watch next.
daily_stock_analysis addresses this with LLMs and scheduled automation. It can run every working day, analyze a configured stock list, and push a structured summary. That makes it useful for AI-assisted market monitoring, and it creates a natural bridge to financial presentations: once you have daily reports, the next step is often a financial deck, an equity research briefing, an annual review, or a consultant-style market update.
How to Use daily_stock_analysis with GitHub Actions
The easiest way to use the project is through GitHub Actions. The README recommends this path because it runs with no server and no additional hosting cost.
Step 1: Fork the Repository
Open the GitHub repo, click Fork, and create your own copy. Everything below happens inside your fork.
Step 2: Configure GitHub Secrets
In your forked repository, go to Settings → Secrets and variables → Actions → New repository secret. You need at least one AI model key and at least one notification channel.
Common AI model secrets include:
ANSPIRE_API_KEYSAIHUBMIX_KEYGEMINI_API_KEYANTHROPIC_API_KEYOPENAI_API_KEYOPENAI_BASE_URLOPENAI_MODEL
Common notification secrets include:
WECHAT_WEBHOOK_URLFEISHU_WEBHOOK_URLTELEGRAM_BOT_TOKENTELEGRAM_CHAT_IDDISCORD_WEBHOOK_URLSLACK_BOT_TOKENSLACK_CHANNEL_IDEMAIL_SENDEREMAIL_PASSWORD
The repo also supports search and news services such as SerpAPI, Tavily, Bocha, Brave Search, MiniMax, and SearXNG. For financial news, search quality matters, because the news an LLM reads can change its final interpretation.
Useful external references while configuring:
Step 3: Configure Your Stock List
The required secret is STOCK_LIST. An example value from the README is:
600519,hk00700,AAPL,7203.T,005930.KS
This means you can analyze a mixed watchlist across A-shares, Hong Kong, US, Japan, and Korea tickers, subject to each market's support boundaries.
Step 4: Enable Actions
Go to the Actions tab and enable workflows. The workflow can run manually or on a schedule. By default it runs on working days at 18:00 Beijing time and skips non-trading days unless forced.
Step 5: Run a Manual Test
Open Actions → 每日股票分析 (Daily Stock Analysis) → Run workflow. After the run completes, you should receive a report through whichever notification channel you configured.
How to Run daily_stock_analysis Locally
If you prefer local execution, the README provides a straightforward path.
Clone the project:
git clone https://github.com/ZhuLinsen/daily_stock_analysis.git
cd daily_stock_analysis
Install dependencies, create your environment file, and edit it with your model keys, data sources, stock list, and notification settings:
pip install -r requirements.txt
cp .env.example .env
Then run the analysis:
python main.py
Common commands include:
python main.py --debug
python main.py --dry-run
python main.py --stocks 600519,hk00700,AAPL
python main.py --market-review
python main.py --schedule
python main.py --serve-only
python main.py --webui
python main.py --webui-only
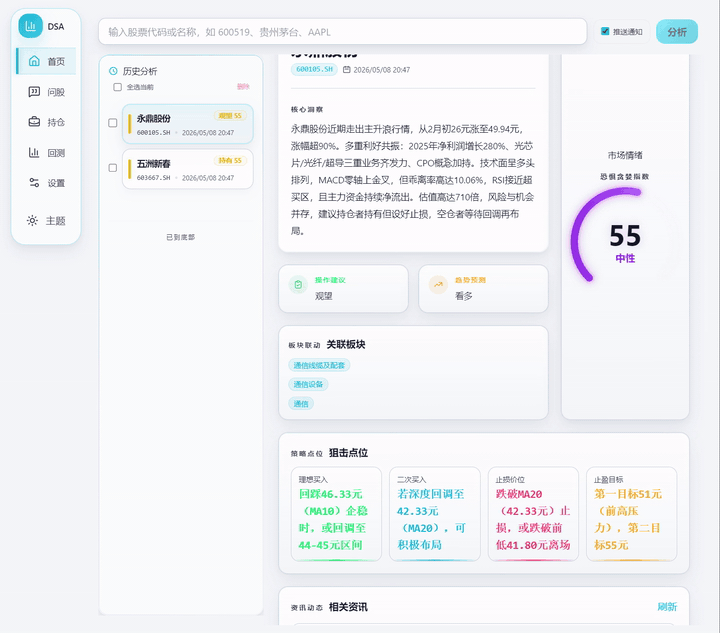
Use --dry-run when testing your configuration, --debug when something fails, and --webui if you want the web workstation experience shown in the screenshot above.
Deployment Options at a Glance
The project supports several deployment modes, and the right one depends on how much control you need.
| Mode | Best for | Trade-off |
|---|---|---|
| GitHub Actions | Hands-off daily runs, no server | Less control over runtime environment |
| Local run | Testing, debugging, custom tweaks | Your machine must be on to run |
| Docker | Reproducible self-hosting | Requires container familiarity |
| FastAPI service | Integrating into other systems | More setup |
| Web workstation | Interactive use, history, backtests | Needs a host to stay available |
For most individual users, GitHub Actions is the lowest-friction starting point. Teams that want an always-on interface tend to move to Docker or the web workstation later.
What Output Do You Get?
The project generates a decision dashboard. The README shows example output that includes:
- Number of analyzed stocks
- Buy, hold, and sell style summary
- Score and trend view
- Sentiment
- Risk alerts and catalysts
- Latest developments
- Market review and sector performance
- Full Markdown reports
The web workstation adds configuration management, task progress, historical reports, complete Markdown output, an "Agent ask-the-stock" feature, backtesting, holdings management, and light or dark themes.
For analysts and consultants, the important point is that the output is not only data — it is already close to a report structure. And a report that is already structured is much easier to turn into a financial presentation.
Best Use Cases
1. Daily Watchlist Monitoring
If you follow names like AAPL, Tencent, Kweichow Moutai, ETFs, or regional stocks, you can configure a watchlist and receive daily AI-generated summaries.
2. Market Review Automation
The market review command generates a broader market snapshot — useful for daily briefings, morning notes, and team discussions. For turning that recurring snapshot into a polished deliverable, see our guide on market performance monitoring for executive presentations.
3. News and Catalyst Tracking
Because the project supports news search providers, it can help surface events, announcements, policy signals, and catalyst narratives that move prices.
4. Research Support for Analysts
Analysts can use the project as a first-pass assistant, then validate the output against official filings, broker research, and exchange data. Useful authoritative sources include:
5. Financial Presentation Preparation
The report output is a strong starting point for a financial deck. A daily dashboard can feed a market update deck, an equity research summary, an investment committee memo deck, a sector rotation report, a portfolio risk review, an annual report presentation, a 10-K summary, or a consultant-style financial snapshot.
From AI Stock Report to Financial PPT
daily_stock_analysis automates the analysis layer. It collects market signals, news, indicators, and AI-generated decision summaries. But a report is not the same thing as a presentation.

A financial deck needs a clear slide narrative, editable charts and tables, an executive summary, source-faithful figures, risk and catalyst slides, professional formatting, speaker notes, and — critically — no hallucinated numbers. That last requirement is where most generic slide generators fall down, and it is exactly the problem we covered in our zero-hallucination AI slides guide.
If you have a financial report PDF, an equity research report, a 10-K, an annual report, or an AI stock analysis Markdown file, Tosea.ai is built to turn it into a structured, editable presentation. The workflow is simple: export the report, then run it through a PDF-to-PowerPoint conversion that preserves your tables and figures instead of rewriting them.
Why You Still Need a Dedicated Presentation Layer
Generic AI slide tools are genuinely useful when you need a quick deck from a short prompt. Financial presentations, however, have stricter requirements: exact numbers, source traceability, preserved tables, chart accuracy, audit-friendly assumptions, clear risk language, and editable PowerPoint output.

If a tool invents a figure or simplifies a table incorrectly, the slide may look polished but become unusable — or worse, misleading. That is why it helps to keep two jobs separate:
| Job | Tool | Output |
|---|---|---|
| Automated stock monitoring and report generation | daily_stock_analysis | Structured Markdown decision report |
| Source-grounded financial PPT from reports, PDFs, or filings | Tosea.ai | Editable, table-faithful slide deck |
For prompt-driven decks built directly inside a chat tool, our roundup of the best ChatGPT prompts for financial presentations covers the complementary approach.
Strengths of daily_stock_analysis
Multi-Market Coverage
The project supports A-shares, Hong Kong stocks, US stocks, and ETFs, with partial support for Japan and Korea tickers.
Multi-Source Data
It combines market data, indicators, news, announcements, and fundamentals from several providers, reducing single-source blind spots.
Multi-Model Support
It works with many LLM providers and OpenAI-compatible APIs, so you are not locked into one vendor.
Automation
GitHub Actions makes scheduled, zero-server runs possible. Local, Docker, FastAPI, and web UI options provide more control when you need it.
Notification Delivery
It can push reports to WeChat Work, Feishu, Telegram, Discord, Slack, and email — meeting your team where it already communicates.
Analyst-Friendly Output
The decision-dashboard format reads more like a research brief than raw market data.
Limitations and Risks
It Is Not Investment Advice
The project can generate analysis, but it cannot replace professional financial judgment. Verify all outputs before acting on them.
Data Quality Can Vary
Market data, news search, and fundamentals depend on third-party providers. APIs can fail, lag, or return incomplete information.
LLMs Can Misinterpret Signals
An LLM may overstate a catalyst, understate a risk, or misread market context. Always check the underlying source data.
Configuration Takes Time
You need model keys, notification setup, stock symbols, search keys, and environment variables. Non-technical users may need help getting started.
It Does Not Replace a Presentation Layer
The repo generates analysis reports. It does not produce editable PowerPoint slides, polished layouts, or document-to-slide conversion — that remains a separate step.
Frequently Asked Questions
What is daily_stock_analysis?
daily_stock_analysis is an open-source AI stock analysis system that uses market data, news, indicators, and LLMs to generate daily stock decision reports and dashboards.
How do I use daily_stock_analysis?
The easiest path is to fork the GitHub repo, configure GitHub Actions secrets, set your stock list, enable Actions, and run the workflow. You can also clone it locally, install dependencies, configure .env, and run python main.py.
Is daily_stock_analysis free?
The repository is open source under the MIT license. Running it through GitHub Actions can be cost-free in many cases, but API keys, data providers, model providers, or search services may carry their own costs.
Does daily_stock_analysis support US stocks?
Yes. The README lists support for US stocks and ETFs, along with A-shares, Hong Kong stocks, and partial support for Japan and Korea tickers.
Can daily_stock_analysis generate financial PPTs?
Not as its main purpose. It generates AI stock analysis reports and dashboards. To turn those reports into financial slides, pair it with a document-to-deck tool such as Tosea.ai.
Can it convert annual reports or 10-Ks to presentations?
The repo is focused on stock analysis automation. For annual-report-to-presentation, 10-K-to-presentation, or equity-research-report-to-PPT workflows, a dedicated presentation tool is the better fit.
Is this safe for investment decisions?
Treat it as research support only. Always verify outputs against official filings, exchange data, company announcements, and trusted financial sources.
What daily_stock_analysis Means for AI Slide Generation
daily_stock_analysis is a clean example of where the analysis job ends and the AI slide generation job begins. The repo is excellent at turning scattered market signals into a structured Markdown decision report on a schedule. What it does not do — and does not claim to do — is build an investor-ready deck. That hand-off is exactly where an AI presentation tool earns its place in the stack.
The connection matters because the deliverable in finance is almost always a deck, not a raw report. An analyst who automates monitoring with daily_stock_analysis still has to produce a market update, a portfolio review, or a board-level summary. The cleaner the source report, the cleaner the document-to-PPT step — and a Markdown report with explicit scores, risks, and catalysts is close to an ideal input for slide structure.
This is the layer Tosea.ai is designed for: a document-to-deck orchestration tool that takes a report, PDF, 10-K, or analysis output and produces a source-grounded, editable slide deck with tables and figures preserved. Because the numbers come from your source document rather than being re-generated, the presentation workflow stays auditable.
If you want to go deeper on the presentation side, three guides pair naturally with this one: our research paper to slides workflow for document-heavy inputs, our framework for presenting data to executives, and our look at how AI is changing the way sector rotations are traded and reported. Together they describe a full path: automate the analysis with daily_stock_analysis, then use a dedicated AI presentation tool to turn the output into a professional slide deck. For analysts, researchers, and consultants who repeat this loop daily, separating monitoring from presentation is what keeps both fast and trustworthy.
Sources
ZhuLinsen/daily_stock_analysis— GitHub repository and README — primary source, accessed June 2026- GitHub Actions documentation — GitHub
- AkShare documentation — AkShare
- YFinance on PyPI — Python Package Index
- SEC EDGAR — U.S. Securities and Exchange Commission
- HKEXnews filings — Hong Kong Stock Exchange
- Yahoo Finance — Yahoo


